Online Training: Accelerated Windows Memory Dump Analysis
Monday, November 22nd, 2021I resume online training sessions. You can now register: https://www.patterndiagnostics.com/accelerated-windows-memory-dump-analysis
I resume online training sessions. You can now register: https://www.patterndiagnostics.com/accelerated-windows-memory-dump-analysis
In addition to the previous Spiking Thread and Distributed Spike CPU consumption analysis patterns we add Spiking Interrupts since they may account for perceived performance degradation such as response lags and system freezes. This pattern also includes DPC activity. We can see the times spent and the number of interrupts using this command and specify CPU number:
0: kd> !prcb 2

PRCB for Processor 2 at ffffe480b3600180:

Current IRQL — 2

Threads–  Current ffffe480b360c240 Next 0000000000000000 Idle ffffe480b360c240

Processor Index 2 Number (0, 2) GroupSetMember 4

Interrupt Count — 0cadbd58

Times — Dpc    0000219c Interrupt 00002ae0

Kernel 00e7808e User      0041303b
0: kd> !whattime  0000219c + 00002ae0

19580 Ticks in Standard Time: 05:05.937s
We can also see the number of DPC requests from the structure itself:
0: kd> dt _KPRCB DPCData

nt!_KPRCB

+0×3340 DpcData : [2] _KDPC_DATA
0: kd> dt _KDPC_DATA

nt!_KDPC_DATA

+0x000 DpcList          : _KDPC_LIST

+0x010 DpcLock          : Uint8B

+0x018 DpcQueueDepth    : Int4B

+0x01c DpcCount         : Uint4B

+0x020 ActiveDpc        : Ptr64 _KDPC

+0x028 LongDpcPresent   : Uint4B

+0×02c Padding          : Uint4B
0: kd> dt _KDPC_DATA ffffe480b3600180+0×3340

nt!_KDPC_DATA

+0×000 DpcList          : _KDPC_LIST

+0×010 DpcLock          : 0

+0×018 DpcQueueDepth    : 0n1

+0×01c DpcCount         : 0×74d9e0

+0×020 ActiveDpc        : 0xffffa30f`e8f1f230 _KDPC

+0×028 LongDpcPresent   : 0

+0×02c Padding          : 0
0: kd> dt _KDPC_DATA ffffe480b3600180+0×3340+30

nt!_KDPC_DATA

+0×000 DpcList          : _KDPC_LIST

+0×010 DpcLock          : 0

+0×018 DpcQueueDepth    : 0n0

+0×01c DpcCount         : 0xd39

+0×020 ActiveDpc        : (null)

+0×028 LongDpcPresent   : 0

+0×02c Padding          : 0
Since these numbers are high and depend on the system age, it is important to compare them with the normal system.
We should be aware that Windows 11 has DPC delegate threads (in addition to Idle threads) that are always shown as running even if they swapped (we can also check their number of context switches and kernel time):
0: kd> !process fffff80443332b00

PROCESS fffff80443332b00

SessionId: none  Cid: 0000    Peb: 00000000  ParentCid: 0000

DirBase: 001ae002  ObjectTable: ffff82869fa52800  HandleCount: 3321.

Image: Idle

VadRoot ffffce8384257f70 Vads 2 Clone 0 Private 9. Modified 2094. Locked 0.

DeviceMap 0000000000000000

Token                             ffff82869fa1f120

ElapsedTime                       3 Days 23:10:01.662

UserTime                          00:00:00.000

KernelTime                        00:00:00.000

QuotaPoolUsage[PagedPool]         0

QuotaPoolUsage[NonPagedPool]      272

Working Set Sizes (now,min,max)  (9, 50, 450) (36KB, 200KB, 1800KB)

PeakWorkingSetSize                2

VirtualSize                       0 Mb

PeakVirtualSize                   0 Mb

PageFaultCount                    9

MemoryPriority                    BACKGROUND

BasePriority                      0

CommitCharge                      15
THREAD fffff80443335bc0  Cid 0000.0000  Teb: 0000000000000000 Win32Thread: 0000000000000000 RUNNING on processor 0

Not impersonating

DeviceMap                 ffff82869fa63c00

Owning Process            fffff80443332b00       Image:         Idle

Attached Process          ffffce83842e6040       Image:         System

Wait Start TickCount      21906707       Ticks: 20013 (0:00:05:12.703)

Context Switch Count      72626555       IdealProcessor: 0

UserTime                  00:00:00.000

KernelTime                3 Days 06:22:34.281

Win32 Start Address nt!KiIdleLoop (0xfffff80442a16a20)

Stack Init fffff8043f4beb70 Current fffff8043f4beb00

Base fffff8043f4bf000 Limit fffff8043f4b8000 Call 0000000000000000

Priority 0 BasePriority 0 PriorityDecrement 0 IoPriority 0 PagePriority 5

Child-SP          RetAddr               Call Site

fffff804`3f4be490 fffff804`428eaa41     nt!PpmIdleGuestExecute+0x1d

fffff804`3f4be4d0 fffff804`428ea256     nt!PpmIdleExecuteTransition+0x661

fffff804`3f4be970 fffff804`42a16a74     nt!PoIdle+0x3a6

fffff804`3f4beb40 00000000`00000000     nt!KiIdleLoop+0x54
THREAD ffffe480b3519240  Cid 0000.0000  Teb: 0000000000000000 Win32Thread: 0000000000000000 RUNNING on processor 1

Not impersonating

DeviceMap                 ffff82869fa63c00

Owning Process            fffff80443332b00       Image:         Idle

Attached Process          ffffce83842e6040       Image:         System

Wait Start TickCount      21905854       Ticks: 20866 (0:00:05:26.031)

Context Switch Count      83248123       IdealProcessor: 1

UserTime                  00:00:00.000

KernelTime                3 Days 08:20:45.812

Win32 Start Address nt!KiIdleLoop (0xfffff80442a16a20)

Stack Init ffffa30fe822fb70 Current ffffa30fe822fb00

Base ffffa30fe8230000 Limit ffffa30fe8229000 Call 0000000000000000

Priority 0 BasePriority 0 PriorityDecrement 0 IoPriority 0 PagePriority 0

Child-SP          RetAddr               Call Site

ffffa30f`e822f490 fffff804`428eaa41     nt!PpmIdleGuestExecute+0x1d

ffffa30f`e822f4d0 fffff804`428ea256     nt!PpmIdleExecuteTransition+0x661

ffffa30f`e822f970 fffff804`42a16a74     nt!PoIdle+0x3a6

ffffa30f`e822fb40 00000000`00000000     nt!KiIdleLoop+0x54
THREAD ffffe480b360c240  Cid 0000.0000  Teb: 0000000000000000 Win32Thread: 0000000000000000 RUNNING on processor 2

Not impersonating

DeviceMap                 ffff82869fa63c00

Owning Process            fffff80443332b00       Image:         Idle

Attached Process          ffffce83842e6040       Image:         System

Wait Start TickCount      21926718       Ticks: 2 (0:00:00:00.031)

Context Switch Count      90942117       IdealProcessor: 2

UserTime                  00:00:00.000

KernelTime                2 Days 15:59:04.671

Win32 Start Address nt!KiIdleLoop (0xfffff80442a16a20)

Stack Init ffffa30fe823fb70 Current ffffa30fe823fb00

Base ffffa30fe8240000 Limit ffffa30fe8239000 Call 0000000000000000

Priority 0 BasePriority 0 PriorityDecrement 0 IoPriority 0 PagePriority 0

Child-SP          RetAddr               Call Site

ffffa30f`e823f6c8 fffff804`42b5d0f6     nt!KeBugCheckEx

ffffa30f`e823f6d0 fffff804`43068f46     nt!PnpBugcheckPowerTimeout+0x76

ffffa30f`e823f730 fffff804`428dcc74     nt!PopBuildDeviceNotifyListWatchdog+0x16

ffffa30f`e823f760 fffff804`428db264     nt!KiProcessExpiredTimerList+0x204

ffffa30f`e823f890 fffff804`42a16abe     nt!KiRetireDpcList+0x714

ffffa30f`e823fb40 00000000`00000000     nt!KiIdleLoop+0x9e
THREAD ffffe480b370c240  Cid 0000.0000  Teb: 0000000000000000 Win32Thread: 0000000000000000 RUNNING on processor 3

Not impersonating

DeviceMap                 ffff82869fa63c00

Owning Process            fffff80443332b00       Image:         Idle

Attached Process          ffffce83842e6040       Image:         System

Wait Start TickCount      21905684       Ticks: 21036 (0:00:05:28.687)

Context Switch Count      66067949       IdealProcessor: 3

UserTime                  00:00:00.000

KernelTime                3 Days 08:02:26.906

Win32 Start Address nt!KiIdleLoop (0xfffff80442a16a20)

Stack Init ffffa30fe824fb70 Current ffffa30fe824fb00

Base ffffa30fe8250000 Limit ffffa30fe8249000 Call 0000000000000000

Priority 0 BasePriority 0 PriorityDecrement 0 IoPriority 0 PagePriority 0

Child-SP          RetAddr               Call Site

ffffa30f`e824f490 fffff804`428eaa41     nt!PpmIdleGuestExecute+0x1d

ffffa30f`e824f4d0 fffff804`428ea256     nt!PpmIdleExecuteTransition+0x661

ffffa30f`e824f970 fffff804`42a16a74     nt!PoIdle+0x3a6

ffffa30f`e824fb40 00000000`00000000     nt!KiIdleLoop+0x54
THREAD ffffe480b380c240  Cid 0000.0000  Teb: 0000000000000000 Win32Thread: 0000000000000000 RUNNING on processor 4

Not impersonating

DeviceMap                 ffff82869fa63c00

Owning Process            fffff80443332b00       Image:         Idle

Attached Process          ffffce83842e6040       Image:         System

Wait Start TickCount      21905843       Ticks: 20877 (0:00:05:26.203)

Context Switch Count      91986345       IdealProcessor: 4

UserTime                  00:00:00.000

KernelTime                3 Days 05:20:02.156

Win32 Start Address nt!KiIdleLoop (0xfffff80442a16a20)

Stack Init ffffa30fe825fb70 Current ffffa30fe825fb00

Base ffffa30fe8260000 Limit ffffa30fe8259000 Call 0000000000000000

Priority 0 BasePriority 0 PriorityDecrement 0 IoPriority 0 PagePriority 0

Child-SP          RetAddr               Call Site

ffffa30f`e825f490 fffff804`428eaa41     nt!PpmIdleGuestExecute+0x1d

ffffa30f`e825f4d0 fffff804`428ea256     nt!PpmIdleExecuteTransition+0x661

ffffa30f`e825f970 fffff804`42a16a74     nt!PoIdle+0x3a6

ffffa30f`e825fb40 00000000`00000000     nt!KiIdleLoop+0x54
THREAD ffffe480b389d240  Cid 0000.0000  Teb: 0000000000000000 Win32Thread: 0000000000000000 RUNNING on processor 5

Not impersonating

DeviceMap                 ffff82869fa63c00

Owning Process            fffff80443332b00       Image:         Idle

Attached Process          ffffce83842e6040       Image:         System

Wait Start TickCount      21905822       Ticks: 20898 (0:00:05:26.531)

Context Switch Count      78668897       IdealProcessor: 5

UserTime                  00:00:00.000

KernelTime                3 Days 08:24:03.187

Win32 Start Address nt!KiIdleLoop (0xfffff80442a16a20)

Stack Init ffffa30fe826fb70 Current ffffa30fe826fb00

Base ffffa30fe8270000 Limit ffffa30fe8269000 Call 0000000000000000

Priority 0 BasePriority 0 PriorityDecrement 0 IoPriority 0 PagePriority 0

Child-SP          RetAddr               Call Site

ffffa30f`e826f490 fffff804`428eaa41     nt!PpmIdleGuestExecute+0x1d

ffffa30f`e826f4d0 fffff804`428ea256     nt!PpmIdleExecuteTransition+0x661

ffffa30f`e826f970 fffff804`42a16a74     nt!PoIdle+0x3a6

ffffa30f`e826fb40 00000000`00000000     nt!KiIdleLoop+0x54
THREAD ffffe480b39b3240  Cid 0000.0000  Teb: 0000000000000000 Win32Thread: 0000000000000000 RUNNING on processor 6

Not impersonating

DeviceMap                 ffff82869fa63c00

Owning Process            fffff80443332b00       Image:         Idle

Attached Process          ffffce83842e6040       Image:         System

Wait Start TickCount      21905853       Ticks: 20867 (0:00:05:26.046)

Context Switch Count      96137826       IdealProcessor: 6

UserTime                  00:00:00.000

KernelTime                3 Days 06:36:10.375

Win32 Start Address nt!KiIdleLoop (0xfffff80442a16a20)

Stack Init ffffa30fe827fb70 Current ffffa30fe827fb00

Base ffffa30fe8280000 Limit ffffa30fe8279000 Call 0000000000000000

Priority 0 BasePriority 0 PriorityDecrement 0 IoPriority 0 PagePriority 0

Child-SP          RetAddr               Call Site

ffffa30f`e827f490 fffff804`428eaa41     nt!PpmIdleGuestExecute+0x1d

ffffa30f`e827f4d0 fffff804`428ea256     nt!PpmIdleExecuteTransition+0x661

ffffa30f`e827f970 fffff804`42a16a74     nt!PoIdle+0x3a6

ffffa30f`e827fb40 00000000`00000000     nt!KiIdleLoop+0x54
THREAD ffffe480b3b0c240  Cid 0000.0000  Teb: 0000000000000000 Win32Thread: 0000000000000000 RUNNING on processor 7

Not impersonating

DeviceMap                 ffff82869fa63c00

Owning Process            fffff80443332b00       Image:         Idle

Attached Process          ffffce83842e6040       Image:         System

Wait Start TickCount      21905670       Ticks: 21050 (0:00:05:28.906)

Context Switch Count      39349487       IdealProcessor: 7

UserTime                  00:00:00.000

KernelTime                3 Days 06:49:50.156

Win32 Start Address nt!KiIdleLoop (0xfffff80442a16a20)

Stack Init ffffa30fe828fb70 Current ffffa30fe828fb00

Base ffffa30fe8290000 Limit ffffa30fe8289000 Call 0000000000000000

Priority 0 BasePriority 0 PriorityDecrement 0 IoPriority 0 PagePriority 0

Child-SP          RetAddr               Call Site

ffffa30f`e828f490 fffff804`428eaa41     nt!PpmIdleGuestExecute+0x1d

ffffa30f`e828f4d0 fffff804`428ea256     nt!PpmIdleExecuteTransition+0x661

ffffa30f`e828f970 fffff804`42a16a74     nt!PoIdle+0x3a6

ffffa30f`e828fb40 00000000`00000000     nt!KiIdleLoop+0x54
THREAD ffffce8384321140  Cid 0000.002c  Teb: 0000000000000000 Win32Thread: 0000000000000000 RUNNING on processor 0

Not impersonating

DeviceMap                 ffff82869fa63c00

Owning Process            fffff80443332b00       Image:         Idle

Attached Process          ffffce83842e6040       Image:         System

Wait Start TickCount      21906745       Ticks: 19975 (0:00:05:12.109)

Context Switch Count      55086          IdealProcessor: 0

UserTime                  00:00:00.000

KernelTime                00:00:00.234

Win32 Start Address nt!KiExecuteDpcDelegate (0xfffff804429bb820)

Stack Init ffffa30fe82bfb70 Current ffffa30fe82bf8b0

Base ffffa30fe82c0000 Limit ffffa30fe82b9000 Call 0000000000000000

Priority 63 BasePriority 0 PriorityDecrement 0 IoPriority 0 PagePriority 0

Child-SP          RetAddr               Call Site

ffffa30f`e82bf8f0 fffff804`4285dc17     nt!KiSwapContext+0×76

ffffa30f`e82bfa30 fffff804`429bb87c     nt!KiSwapThread+0×3a7

ffffa30f`e82bfb10 fffff804`42a16c24     nt!KiExecuteDpcDelegate+0×5c

ffffa30f`e82bfb40 00000000`00000000     nt!KiStartSystemThread+0×34
THREAD ffffce8384362080  Cid 0000.0034  Teb: 0000000000000000 Win32Thread: 0000000000000000 RUNNING on processor 1

Not impersonating

DeviceMap                 ffff82869fa63c00

Owning Process            fffff80443332b00       Image:         Idle

Attached Process          ffffce83842e6040       Image:         System

Wait Start TickCount      16926767       Ticks: 4999953 (0:21:42:04.265)

Context Switch Count      4968           IdealProcessor: 1

UserTime                  00:00:00.000

KernelTime                00:00:00.015

Win32 Start Address nt!KiExecuteDpcDelegate (0xfffff804429bb820)

Stack Init ffffa30fe82cfb70 Current ffffa30fe82cf8b0

Base ffffa30fe82d0000 Limit ffffa30fe82c9000 Call 0000000000000000

Priority 63 BasePriority 0 PriorityDecrement 0 IoPriority 0 PagePriority 0

Child-SP          RetAddr               Call Site

ffffa30f`e82cf8f0 fffff804`4285dc17     nt!KiSwapContext+0×76

ffffa30f`e82cfa30 fffff804`429bb87c     nt!KiSwapThread+0×3a7

ffffa30f`e82cfb10 fffff804`42a16c24     nt!KiExecuteDpcDelegate+0×5c

ffffa30f`e82cfb40 00000000`00000000     nt!KiStartSystemThread+0×34
THREAD ffffce83842f7040  Cid 0000.003c  Teb: 0000000000000000 Win32Thread: 0000000000000000 RUNNING on processor 2

Not impersonating

DeviceMap                 ffff82869fa63c00

Owning Process            fffff80443332b00       Image:         Idle

Attached Process          ffffce83842e6040       Image:         System

Wait Start TickCount      21631408       Ticks: 295312 (0:01:16:54.250)

Context Switch Count      522            IdealProcessor: 2

UserTime                  00:00:00.000

KernelTime                00:00:00.000

Win32 Start Address nt!KiExecuteDpcDelegate (0xfffff804429bb820)

Stack Init ffffa30fe82dfb70 Current ffffa30fe82df8b0

Base ffffa30fe82e0000 Limit ffffa30fe82d9000 Call 0000000000000000

Priority 63 BasePriority 0 PriorityDecrement 0 IoPriority 0 PagePriority 0

Child-SP          RetAddr               Call Site

ffffa30f`e82df8f0 fffff804`4285dc17     nt!KiSwapContext+0×76

ffffa30f`e82dfa30 fffff804`429bb87c     nt!KiSwapThread+0×3a7

ffffa30f`e82dfb10 fffff804`42a16c24     nt!KiExecuteDpcDelegate+0×5c

ffffa30f`e82dfb40 00000000`00000000     nt!KiStartSystemThread+0×34
THREAD ffffce8384367040  Cid 0000.0044  Teb: 0000000000000000 Win32Thread: 0000000000000000 RUNNING on processor 3

Not impersonating

DeviceMap                 ffff82869fa63c00

Owning Process            fffff80443332b00       Image:         Idle

Attached Process          ffffce83842e6040       Image:         System

Wait Start TickCount      21667748       Ticks: 258972 (0:01:07:26.437)

Context Switch Count      301            IdealProcessor: 3

UserTime                  00:00:00.000

KernelTime                00:00:00.000

Win32 Start Address nt!KiExecuteDpcDelegate (0xfffff804429bb820)

Stack Init ffffa30fe82efb70 Current ffffa30fe82ef8b0

Base ffffa30fe82f0000 Limit ffffa30fe82e9000 Call 0000000000000000

Priority 63 BasePriority 0 PriorityDecrement 0 IoPriority 0 PagePriority 0

Child-SP          RetAddr               Call Site

ffffa30f`e82ef8f0 fffff804`4285dc17     nt!KiSwapContext+0×76

ffffa30f`e82efa30 fffff804`429bb87c     nt!KiSwapThread+0×3a7

ffffa30f`e82efb10 fffff804`42a16c24     nt!KiExecuteDpcDelegate+0×5c

ffffa30f`e82efb40 00000000`00000000     nt!KiStartSystemThread+0×34
THREAD ffffce8384369040  Cid 0000.004c  Teb: 0000000000000000 Win32Thread: 0000000000000000 RUNNING on processor 4

Not impersonating

DeviceMap                 ffff82869fa63c00

Owning Process            fffff80443332b00       Image:         Idle

Attached Process          ffffce83842e6040       Image:         System

Wait Start TickCount      20333183       Ticks: 1593537 (0:06:54:59.015)

Context Switch Count      405            IdealProcessor: 4

UserTime                  00:00:00.000

KernelTime                00:00:00.000

Win32 Start Address nt!KiExecuteDpcDelegate (0xfffff804429bb820)

Stack Init ffffa30fe82ffb70 Current ffffa30fe82ff8b0

Base ffffa30fe8300000 Limit ffffa30fe82f9000 Call 0000000000000000

Priority 63 BasePriority 0 PriorityDecrement 0 IoPriority 0 PagePriority 0

Child-SP          RetAddr               Call Site

ffffa30f`e82ff8f0 fffff804`4285dc17     nt!KiSwapContext+0×76

ffffa30f`e82ffa30 fffff804`429bb87c     nt!KiSwapThread+0×3a7

ffffa30f`e82ffb10 fffff804`42a16c24     nt!KiExecuteDpcDelegate+0×5c

ffffa30f`e82ffb40 00000000`00000000     nt!KiStartSystemThread+0×34
THREAD ffffce838436b040  Cid 0000.0054  Teb: 0000000000000000 Win32Thread: 0000000000000000 RUNNING on processor 5

Not impersonating

DeviceMap                 ffff82869fa63c00

Owning Process            fffff80443332b00       Image:         Idle

Attached Process          ffffce83842e6040       Image:         System

Wait Start TickCount      4760713        Ticks: 17166007 (3:02:30:18.859)

Context Switch Count      118            IdealProcessor: 5

UserTime                  00:00:00.000

KernelTime                00:00:00.000

Win32 Start Address nt!KiExecuteDpcDelegate (0xfffff804429bb820)

Stack Init ffffa30fe830fb70 Current ffffa30fe830f8b0

Base ffffa30fe8310000 Limit ffffa30fe8309000 Call 0000000000000000

Priority 63 BasePriority 0 PriorityDecrement 0 IoPriority 0 PagePriority 0

Child-SP          RetAddr               Call Site

ffffa30f`e830f8f0 fffff804`4285dc17     nt!KiSwapContext+0×76

ffffa30f`e830fa30 fffff804`429bb87c     nt!KiSwapThread+0×3a7

ffffa30f`e830fb10 fffff804`42a16c24     nt!KiExecuteDpcDelegate+0×5c

ffffa30f`e830fb40 00000000`00000000     nt!KiStartSystemThread+0×34
THREAD ffffce838436d040  Cid 0000.005c  Teb: 0000000000000000 Win32Thread: 0000000000000000 RUNNING on processor 6

Not impersonating

DeviceMap                 ffff82869fa63c00

Owning Process            fffff80443332b00       Image:         Idle

Attached Process          ffffce83842e6040       Image:         System

Wait Start TickCount      20662898       Ticks: 1263822 (0:05:29:07.218)

Context Switch Count      249            IdealProcessor: 6

UserTime                  00:00:00.000

KernelTime                00:00:00.000

Win32 Start Address nt!KiExecuteDpcDelegate (0xfffff804429bb820)

Stack Init ffffa30fe831fb70 Current ffffa30fe831f8b0

Base ffffa30fe8320000 Limit ffffa30fe8319000 Call 0000000000000000

Priority 63 BasePriority 0 PriorityDecrement 0 IoPriority 0 PagePriority 0

Child-SP          RetAddr               Call Site

ffffa30f`e831f8f0 fffff804`4285dc17     nt!KiSwapContext+0×76

ffffa30f`e831fa30 fffff804`429bb87c     nt!KiSwapThread+0×3a7

ffffa30f`e831fb10 fffff804`42a16c24     nt!KiExecuteDpcDelegate+0×5c

ffffa30f`e831fb40 00000000`00000000     nt!KiStartSystemThread+0×34
THREAD ffffce838436f040  Cid 0000.0064  Teb: 0000000000000000 Win32Thread: 0000000000000000 RUNNING on processor 7

Not impersonating

DeviceMap                 ffff82869fa63c00

Owning Process            fffff80443332b00       Image:         Idle

Attached Process          ffffce83842e6040       Image:         System

Wait Start TickCount      20547550       Ticks: 1379170 (0:05:59:09.531)

Context Switch Count      196            IdealProcessor: 7

UserTime                  00:00:00.000

KernelTime                00:00:00.000

Win32 Start Address nt!KiExecuteDpcDelegate (0xfffff804429bb820)

Stack Init ffffa30fe832fb70 Current ffffa30fe832f8b0

Base ffffa30fe8330000 Limit ffffa30fe8329000 Call 0000000000000000

Priority 63 BasePriority 0 PriorityDecrement 0 IoPriority 0 PagePriority 0

Child-SP          RetAddr               Call Site

ffffa30f`e832f8f0 fffff804`4285dc17     nt!KiSwapContext+0×76

ffffa30f`e832fa30 fffff804`429bb87c     nt!KiSwapThread+0×3a7

ffffa30f`e832fb10 fffff804`42a16c24     nt!KiExecuteDpcDelegate+0×5c

ffffa30f`e832fb40 00000000`00000000     nt!KiStartSystemThread+0×34
- Dmitry Vostokov @ DumpAnalysis.org + TraceAnalysis.org -
Raw stack memory region analysis is more productive with Region Clusters analysis pattern. Here we apply simple clustering techniques to organize various region values into disjoint sets with chosen semantics. For our purposes simple sort suffices to generate such clusters that can be visually inspected. We take the same stack.csv file from Region Profile analysis pattern. It’s values are sorted and the results are shown in sorted order with corresponding count of occurrences and symbolic references (we use the internal version of Narrascope written in C++, a narrative debugger, but you can use your favorite scripting language here):
0  count: 13718

1  count: 273

2  count: 23

3  count: 22

4  count: 28

5  count: 9

6  count: 5

7  count: 18

8  count: 35

9  count: 5

a  count: 24

b  count: 12

c  count: 4

d  count: 3

e  count: 1

f  count: 28

10  count: 14

...

c0000034  count: 2

c0000388  count: 2

c01c0001  count: 1

c0a70000  count: 1

d0908070  count: 1

dcae0fa0  count: 1

e30000e3  count: 1

f80004fc  count: 2

ffff5815  count: 2

fffffed3  count: 2

fffffffd  count: 2

ffffffff  count: 18

100000000  count: 6

100000001  count: 4

100001f80  count: 1

100001fa0  count: 16

100001fa4  count: 2

100003033  count: 2

100010000  count: 1

...

7ff700000000  count: 1

7ff700000001  count: 2

7ff70000000d  count: 1

7ff747390000 Photoshop_exe count: 1

7ff74ebd4ec0 Photoshop_exe+0x7844ec0 count: 1

7ff74ef351c7 Photoshop_exe+0x7ba51c7 count: 1

7ff74ef4e2f0 Photoshop_exe+0x7bbe2f0 count: 1

7ff74ef4e5a9 Photoshop_exe+0x7bbe5a9 count: 1

...

7fff00000000  count: 21

7fff00000001  count: 7

7fff00000002  count: 1

7fff00000003  count: 1

7fff00000004  count: 1

7fff00000011  count: 1

7fff00000020  count: 1

7fff00000040  count: 3

7fff00000102  count: 1

7fff0000029e  count: 3

7fff00140000  count: 1

7fff02000002  count: 1

7fff4782c33b libcef!GetHandleVerifier+0x61d7b count: 1

7fff4782c884 libcef!GetHandleVerifier+0x622c4 count: 1

7fff493749cc libcef!cef_time_to_timet+0x1a9228 count: 2

...

7fff9a0c1e57 GdiPlus!GpGraphics::MeasureString+0x333 count: 1

7fff9a128c2a GdiPlus!FastTextImager::MeasureString+0x32 count: 1

7fff9a174e18 GdiPlus!GpFontFamily::vftable' count: 2

7fff9b6055b3 DWrite!FontFace::GetDesignGlyphAdvances+0x57 count: 1

7fffa7e6c260 comctl32!ListBox_WndProc count: 5

7fffa7e6c357 comctl32!ListBox_WndProc+0xf7 count: 2

7fffb1373c18 npmproxy!INotifyNetworkListManagerEventsProxyVtbl+0x1b8 count: 1

7fffb2c14e96 msvcp140!_Mbrtowc+0x66 [f:\dd\vctools\crt\crtw32\stdcpp\xmbtowc.c @ 156] count: 1

...

7fffc09f0359 ntdll!qsort+0x379 count: 1

7fffc09fa1e4 ntdll!woutput_s+0x8e8 count: 1

7fffc09fa297 ntdll!write_string+0x3f count: 1

7fffc09fbd30 ntdll!NtdllDefWindowProc_W count: 2

7fffc09fbf10 ntdll!NtdllDispatchHook_W count: 2

7fffc09ffc54 ntdll!KiUserCallForwarder+0x24 count: 1

7fffc09ffdb4 ntdll!KiUserCallbackDispatcherContinue count: 2

800000000000  count: 1

800000000001  count: 2

800063640000  count: 36

800066660000  count: 38

80006f6f0000  count: 2

800072720000  count: 8

800075750000  count: 1

974b00000000  count: 1

974b8118d10d  count: 1

a76b00000000  count: 1

a76bb8365307  count: 1

a76bb8378c47  count: 1

a76bb8378f77  count: 1

a76bb837bfd7  count: 1

a8c300000000  count: 1

a8c311cf265f  count: 1

...

30000000000000  count: 1

30000000310030  count: 1

30000300470048  count: 1

30002000100000  count: 1

3000300030007b  count: 1

3000300031002d  count: 1

30003000310031  count: 2

300031002d0037  count: 1

30003800390032  count: 3

31000000000000  count: 1

310000007d0036  count: 1

31002d00310037  count: 1

310032002d0035  count: 1

...

7fdf7fbd7f9c7f7b  count: 2

8000800000000001  count: 1

8000800000001fa0  count: 1

8000800080000000  count: 6

8000800080008000  count: 52

80121a254b25250a  count: 1

923800003f000000  count: 2

bf000000bf000000  count: 1

bff0000000000000  count: 2

e5b2a56118358cbe  count: 2

ffff0072656c6c6f  count: 1

fffffdb773438b57  count: 3

ffffff0000000005  count: 1

ffffff7bc010786f  count: 1

ffffff7bc010787f  count: 1

fffffffb00000000  count: 1

ffffffff00000000  count: 4

ffffffff00000001  count: 3

ffffffff00000005  count: 1

ffffffff00001fa0  count: 2

ffffffff4c494146  count: 2

ffffffffffffc3ce  count: 1

fffffffffffffef6  count: 1

ffffffffffffff00  count: 2

ffffffffffffff01  count: 2

fffffffffffffffe  count: 166

ffffffffffffffff  count: 38
We can easily identify error values, module boundaries, and Regular Data. The sorting can also be done for double word or word values, for example to isolate errors or wide character values, but this will have to be seen whether it is useful.
This clustering approach can be depicted in the following idealized diagram:
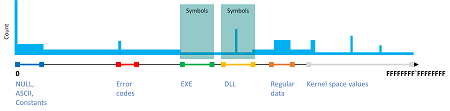
The full output can be found here: stack-clusters.txt for stack.csv file.
- Dmitry Vostokov @ DumpAnalysis.org + TraceAnalysis.org -
Sometimes we have complex plugins or subsystems consisting from several modules that are loaded in the same process address space (and this is also possible in kernel space as well). Usually subsystem components reside in the same persistent folder (including its possible subfolders):
0:000> lmf

start             end                 module name

...

00007fff`46ee0000 00007fff`4cde8000   libcef   C:\Program Files\Adobe\Adobe Photoshop CC 2019\Required\Plug-ins\Spaces\libcef.dll

…

00007fff`7fa40000 00007fff`7fbc2000   Spaces   C:\Program Files\Adobe\Adobe Photoshop CC 2019\Required\Plug-ins\Spaces\Spaces.8li

…

00007fff`8ba50000 00007fff`8bae3000   chrome_elf C:\Program Files\Adobe\Adobe Photoshop CC 2019\Required\Plug-ins\Spaces\chrome_elf.dll

…
When we know product architecture we can group modules according to the known design not only by their physical locations.
This analysis pattern, that we call Subsystem Modules, is useful for the analysis of possibles relationships of Stack Traces from Stack Trace Collections and other Historical Information during the root cause analysis of various crash and hang issues. This can also be applicable to .NET managed space analysis that includes various multi-file assemblies.
- Dmitry Vostokov @ DumpAnalysis.org + TraceAnalysis.org -
Stack Overflow (user mode) analysis pattern relied on prominent stack trace signs. However, in cases of low memory condition there may not be an opportunity to create a new guard page for the expanding stack region and the exception itself may be Hidden Exception:
0:003> kc

# Call Site

00 KERNELBASE!GetModuleHandleExW

01 EdgeContent!wil::details::GetModuleInformation

02 EdgeContent!wil::details::GetCurrentModuleName

03 EdgeContent!wil::details::LogFailure

04 EdgeContent!wil::details::ReportFailure

05 EdgeContent!wil::details::ReportFailure_Hr

06 EdgeContent!wil::details::in1diag3::FailFast_Hr

07 EdgeContent!`anonymous namespace'::MemoryLimitWatchdogThreadProc

08 kernel32!BaseThreadInitThunk

09 ntdll!RtlUserThreadStart
0:003> .exr -1

ExceptionAddress: 00007ff992f6391b (KERNELBASE!GetModuleHandleExW+0x000000000000007b)

ExceptionCode: c00000fd (Stack overflow)

ExceptionFlags: 00000000

NumberParameters: 2

Parameter[0]: 0000000000000001

Parameter[1]: 000000fe709fdfc8
0:003> r

rax=0000000000000001 rbx=0000000000000006 rcx=00007ff945e3fa80

rdx=000000fe709fe020 rsi=00007ff945e3fa80 rdi=000000fe709fe030

rip=00007ff992f6391b rsp=000000fe709fdfd0 rbp=0000000000000040

r8=000000fe709fe030  r9=0000000000000040 r10=00000fff28bc7dba

r11=0440000001000010 r12=00007ff94606be60 r13=000000000000013f

r14=0000000000000003 r15=0000000000000000

iopl=0         nv up ei pl nz na pe nc

cs=0033  ss=002b  ds=002b  es=002b  fs=0053  gs=002b             efl=00010200

KERNELBASE!GetModuleHandleExW+0x7b:

00007ff9`92f6391b ff1597f31200    call    qword ptr [KERNELBASE!_imp_RtlPcToFileHeader (00007ff9`93092cb8)] ds:00007ff9`93092cb8={ntdll!RtlPcToFileHeader (00007ff9`960d0f50)}
The stack trace is short and the exception seem happened during call so we examine the stack pointer:
0:003> !address 000000fe709fdfd0

Usage:                  Stack

Base Address:           000000fe`709fb000

End Address:            000000fe`70a00000

Region Size:            00000000`00005000 (  20.000 kB)

State:                  00001000          MEM_COMMIT

Protect:                00000004          PAGE_READWRITE

Type:                   00020000          MEM_PRIVATE

Allocation Base:        000000fe`70900000

Allocation Protect:     00000004          PAGE_READWRITE
The committed stack region is very small so we expect its surrounding from the output of !address WinDbg command (without any address parameters):
Opened log file 'c:\MemoryDumps\stack.txt'

0:003> !address 000000fe709fdfd0

[...]

+       fe`70600000       fe`706fb000        0`000fb000 MEM_PRIVATE MEM_RESERVE                                    Stack      [~1; 1f50.21d4]

fe`706fb000       fe`706fe000        0`00003000 MEM_PRIVATE MEM_COMMIT  PAGE_READWRITE|PAGE_GUARD          Stack      [~1; 1f50.21d4]

fe`706fe000       fe`70700000        0`00002000 MEM_PRIVATE MEM_COMMIT  PAGE_READWRITE                     Stack      [~1; 1f50.21d4]

+       fe`70700000       fe`70800000        0`00100000             MEM_FREE    PAGE_NOACCESS                      Free

+       fe`70800000       fe`708f9000        0`000f9000 MEM_PRIVATE MEM_RESERVE                                    Stack      [~2; 1f50.460c]

fe`708f9000       fe`708fc000        0`00003000 MEM_PRIVATE MEM_COMMIT  PAGE_READWRITE|PAGE_GUARD          Stack      [~2; 1f50.460c]

fe`708fc000       fe`70900000        0`00004000 MEM_PRIVATE MEM_COMMIT  PAGE_READWRITE                     Stack      [~2; 1f50.460c]

+       fe`70900000       fe`709fb000        0`000fb000 MEM_PRIVATE MEM_RESERVE                                    Stack      [~3; 1f50.4f80]

fe`709fb000       fe`70a00000        0`00005000 MEM_PRIVATE MEM_COMMIT  PAGE_READWRITE                     Stack      [~3; 1f50.4f80]

+       fe`70a00000       fe`70afc000        0`000fc000 MEM_PRIVATE MEM_RESERVE                                    Stack      [~4; 1f50.4ff4]

fe`70afc000       fe`70aff000        0`00003000 MEM_PRIVATE MEM_COMMIT  PAGE_READWRITE|PAGE_GUARD          Stack      [~4; 1f50.4ff4]

fe`70aff000       fe`70b00000        0`00001000 MEM_PRIVATE MEM_COMMIT  PAGE_READWRITE                     Stack      [~4; 1f50.4ff4]

+       fe`70b00000       fe`70bf9000        0`000f9000 MEM_PRIVATE MEM_RESERVE                                    Stack      [~5; 1f50.5ea0]

fe`70bf9000       fe`70bfc000        0`00003000 MEM_PRIVATE MEM_COMMIT  PAGE_READWRITE|PAGE_GUARD          Stack      [~5; 1f50.5ea0]

fe`70bfc000       fe`70c00000        0`00004000 MEM_PRIVATE MEM_COMMIT  PAGE_READWRITE                     Stack      [~5; 1f50.5ea0]

[…]
We see that there is no guard page for the stack ~3 compared to other stacks and there is plenty of reserved space before that to create a new guard page in the normal circumstances. We also recall that the stack overflow exception is about the inability to create a guard page:
0:003> !error c00000fd

Error code: (NTSTATUS) 0xc00000fd (3221225725) - A new guard page for the stack cannot be created.
Looking at Stack Trace Collection we find the thread ~11 that was doing System Call:
0:003> ~*kc

[...]
11  Id: 1f50.2424 Suspend: 1 Teb: 000000fe`6fec8000 Unfrozen

# Call Site

00 ntdll!NtAllocateVirtualMemory

01 KERNELBASE!VirtualAlloc

02 eShims!NS_ACGLockdownTelemetry::APIHook_VirtualAlloc

03 Chakra!Memory::VirtualAllocWrapper::AllocPages

[…]
For this thread the last error value show that there was low memory condition, perhaps the page file was full to create new committed pages:
0:003> ~11s

ntdll!NtAllocateVirtualMemory+0x14:

00007ff9`9615aca4 c3              ret
0:011> !teb

TEB at 000000fe6fec8000

ExceptionList:        0000000000000000

StackBase:            000000fe71e00000

StackLimit:           000000fe7140a000

SubSystemTib:         0000000000000000

FiberData:            0000000000001e00

ArbitraryUserPointer: 0000000000000000

Self:                 000000fe6fec8000

EnvironmentPointer:   0000000000000000

ClientId:             0000000000001f50 . 0000000000002424

RpcHandle:            0000000000000000

Tls Storage:          0000023c84be2c70

PEB Address:          000000fe6fe97000

LastErrorValue:       1455

LastStatusValue:      c000012d

Count Owned Locks:    0

HardErrorMode:        0
0:011> !error c000012d

Error code: (NTSTATUS) 0xc000012d (3221225773) - {Out of Virtual Memory}  Your system is low on virtual memory. To ensure that Windows runs properly, increase the size of your virtual memory paging file. For more information, see Help.
0:011> !error 0n1455

Error code: (Win32) 0x5af (1455) - The paging file is too small for this operation to complete.
Because the original analysis you see above was done on the memory dump from the working computer we are not able to provide that memory dump for security reasons. So, to model this behavior, we created an application that has two threads: one leaks committed virtual memory and when the next allocation fails it creates a separate thread that attempts to do stack overflow. We then launched 20 copies of that process to limit the size of the individual crash dump. The example memory dump and the application PDB file can be downloaded from here.
- Dmitry Vostokov @ DumpAnalysis.org + TraceAnalysis.org -
When we have Active Thread:
0:001> kL

# Child-SP          RetAddr           Call Site

00 (Inline Function) --------`-------- Windows_Web!JsonParser::ParseString+0x96

01 0000007f`56efdb00 00007fff`700198c5 Windows_Web!JsonParser::ParseValue+0x3b7

02 0000007f`56efdb80 00007fff`70018ab3 Windows_Web!JsonParser::ParseArray+0xf5

03 0000007f`56efdbd0 00007fff`70018f72 Windows_Web!JsonParser::ParseValue+0x663

04 0000007f`56efdc50 00007fff`700186fb Windows_Web!JsonParser::ParseObject+0x422

05 0000007f`56efdda0 00007fff`700198c5 Windows_Web!JsonParser::ParseValue+0x2ab

06 0000007f`56efde20 00007fff`70018ab3 Windows_Web!JsonParser::ParseArray+0xf5

07 0000007f`56efde70 00007fff`70018f72 Windows_Web!JsonParser::ParseValue+0x663

08 0000007f`56efdef0 00007fff`700186fb Windows_Web!JsonParser::ParseObject+0x422

09 0000007f`56efe040 00007fff`70018f72 Windows_Web!JsonParser::ParseValue+0x2ab

0a 0000007f`56efe0c0 00007fff`700186fb Windows_Web!JsonParser::ParseObject+0x422

0b 0000007f`56efe210 00007fff`70011a69 Windows_Web!JsonParser::ParseValue+0x2ab

0c 0000007f`56efe290 00007fff`700119d2 Windows_Web!JsonValueImpl::ParseInternal+0x75

0d 0000007f`56efe2d0 00007fff`700118e8 Windows_Web!JsonValueImpl::InitializeFromString+0x16

0e 0000007f`56efe300 00007fff`70011876 Windows_Web!JsonValueFactory::TryParseInternal+0x50

0f 0000007f`56efe330 00007fff`3a6fe48e Windows_Web!JsonValueFactory::TryParse+0x36

10 0000007f`56efe360 00007fff`3a78f95c eModel!JsonUtils::GetJsonObject+0x82

[...]
which is also Spiking Thread:
0:001> !runaway f

User Mode Time

Thread       Time

1:1a2c     0 days 0:03:37.562

8:52a8     0 days 0:00:36.890

[…]
Kernel Mode Time

Thread       Time

8:52a8     0 days 0:00:10.625

1:1a2c     0 days 0:00:18.078

[...]
we can look at the relative proportion of User Mode / Kernel Mode times to infer Active Space. This can be further confirmed if we have Step Dumps, for example, in our case we had an earlier memory dump with the same Active Thread and Constant Subtrace (with Variable Subtraces in the same Active Space):
0:001> kL

# Child-SP          RetAddr           Call Site

00 0000007f`56efd8d0 00007fff`a1109453 ntdll!RtlpHpLfhSlotAllocate+0×126

01 0000007f`56efd9c0 00007fff`a110a8db ntdll!RtlpAllocateHeapInternal+0×313

02 0000007f`56efdaa0 00007fff`9ea09960 ntdll!RtlpHpAllocWithExceptionProtection+0×3b

03 0000007f`56efdb70 00007fff`7001ba1b msvcrt!malloc+0×70

04 0000007f`56efdba0 00007fff`700187ca Windows_Web!operator new+0×23

05 (Inline Function) ——–`——– Windows_Web!StringBuilder::EnsureBufferSpace+0×18

06 (Inline Function) ——–`——– Windows_Web!JsonParser::ParseString+0×59

07 0000007f`56efdbd0 00007fff`70018f72 Windows_Web!JsonParser::ParseValue+0×37a

08 0000007f`56efdc50 00007fff`700186fb Windows_Web!JsonParser::ParseObject+0×422

09 0000007f`56efdda0 00007fff`700198c5 Windows_Web!JsonParser::ParseValue+0×2ab

0a 0000007f`56efde20 00007fff`70018ab3 Windows_Web!JsonParser::ParseArray+0xf5

0b 0000007f`56efde70 00007fff`70018f72 Windows_Web!JsonParser::ParseValue+0×663

0c 0000007f`56efdef0 00007fff`700186fb Windows_Web!JsonParser::ParseObject+0×422

0d 0000007f`56efe040 00007fff`70018f72 Windows_Web!JsonParser::ParseValue+0×2ab

0e 0000007f`56efe0c0 00007fff`700186fb Windows_Web!JsonParser::ParseObject+0×422

0f 0000007f`56efe210 00007fff`70011a69 Windows_Web!JsonParser::ParseValue+0×2ab

10 0000007f`56efe290 00007fff`700119d2 Windows_Web!JsonValueImpl::ParseInternal+0×75

11 0000007f`56efe2d0 00007fff`700118e8 Windows_Web!JsonValueImpl::InitializeFromString+0×16

12 0000007f`56efe300 00007fff`70011876 Windows_Web!JsonValueFactory::TryParseInternal+0×50

13 0000007f`56efe330 00007fff`3a6fe48e Windows_Web!JsonValueFactory::TryParse+0×36

14 0000007f`56efe360 00007fff`3a78f95c eModel!JsonUtils::GetJsonObject+0×82

[…]
Even in the absence of Active Threads in process memory dumps it is useful to look at time spent in kernel and user modes to see any anomalies, especially when threads are blocked in System Calls. Then the high value of kernel mode time should suggest to inspect kernel Activity Space (for example, via a kernel dump). If we have an indication of high values of user mode time in a kernel memory dump we may need to obtain process memory Step Dumps.
- Dmitry Vostokov @ DumpAnalysis.org + TraceAnalysis.org -
In addition to Exception Thread analysis pattern (or several threads when we have Multiple Exceptions) that we named Exception Stack Trace there may be a separated thread that reports such exceptions (Exception Reporting Thread):
This dump file has an exception of interest stored in it.

The stored exception information can be accessed via .ecxr.

(4a0c.2ab4): Application hang - code cfffffff (first/second chance not available)

win32u!NtUserCreateWindowEx+0x14:
0:002> kc

# Call Site

00 win32u!NtUserCreateWindowEx

01 user32!VerNtUserCreateWindowEx

02 user32!CreateWindowInternal

03 user32!CreateWindowExW

04 CoreMessaging!Microsoft::CoreUI::Dispatch::UserAdapter:: InitializeWindow

05 CoreMessaging!Microsoft::CoreUI::Dispatch::UserAdapter::Initialize

06 CoreMessaging!Microsoft::CoreUI::Dispatch::EventLoop::Callback_Run

07 CoreMessaging!Microsoft::CoreUI::Messaging::MessageSession$R:: Microsoft__CoreUI__IExportMessageSession_Impl::Run

08 CoreMessaging!Microsoft::CoreUI:: IExportMessageSession$X__ExportAdapter::Run

09 CoreMessaging!Windows::System::DispatcherQueue::RunLoop

0a CoreMessaging!Windows::System::DispatcherQueueController:: DispatcherQueueThreadProc

0b kernel32!BaseThreadInitThunk

0c ntdll!RtlUserThreadStart
0:002> ~42kc

# Call Site

00 ntdll!NtWaitForMultipleObjects

01 ntdll!WerpWaitForCrashReporting

02 ntdll!RtlReportExceptionEx

03 eModel!s_ReportAsyncBoundaryHangOnSuspendedThread

04 kernel32!BaseThreadInitThunk

05 ntdll!RtlUserThreadStart
We can spot such a thread in Stack Trace Collection.
Although the example above is for application hang (Blocked Thread) and also illustrates Self-Diagnosis, similar threads may report Handled Exceptions. Usually, Exception Threads are also Exception Reporting Threads as shown in Invalid Parameter analysis pattern example.
- Dmitry Vostokov @ DumpAnalysis.org + TraceAnalysis.org -
Windows processes may contain Execution Residue such as ASCII window class names in mapped memory regions pointing to other running processes (perhaps as a result of Hooksware). For example, calc.exe process memory dump saved on my Windows 10 notebook “knows” about Visio and WinDbg windows that were opened at that time:
0:000> s-a 0 L?FFFFFFFFFFFFFFFF "VISIOA"

00000015`42c6bdd0  56 49 53 49 4f 41 00 00-00 00 00 00 00 00 00 00  VISIOA.............
0:000> s-a 0 L?FFFFFFFFFFFFFFFF "WinDbg"

00000015`42d19720  57 69 6e 44 62 67 46 72-61 6d 65 43 6c 61 73 73  WinDbgFrameClass
This may be useful for some troubleshooting scenarios, for example, pointing to processes which are known for their problematic behavior or Special Processes. Of course, we assume that those windows or classes were genuine, not faked. We call this analysis pattern Window Hint similar to Environment Hint and Module Hint analysis patterns.
Going deeper, we can dump strings from the whole region limiting the output to the strings with length more than 5:
0:000> !address 00000015`42d19720
Usage:                  <unknown>

Base Address:           00000015`42b20000

End Address:            00000015`42d3a000

Region Size:            00000000`0021a000 (   2.102 MB)

State:                  00001000          MEM_COMMIT

Protect:                00000002          PAGE_READONLY

Type:                   00040000          MEM_MAPPED

Allocation Base:        00000015`42b20000

Allocation Protect:     00000002          PAGE_READONLY
Content source: 1 (target), length: 208e0
0:000> s-[l5]sa 00000015`42b20000 00000015`42d3a000

00000015`42b20a60  “#32769″

00000015`42b20cc0  “Message”

00000015`42b20f40  “#32774″

00000015`42b21060  “#32772″

00000015`42b21510  “Ghost”

00000015`42b215e0  “LivePreview”

00000015`42b216f0  “UserAdapterWindowClass”

00000015`42b21ce0  “MSCTFIME Composition”

00000015`42b222a0  “#32772″

00000015`42b22390  “#32772″

00000015`42b22460  “RichEdit20W”

00000015`42b22530  “RichEdit20A”

00000015`42b22600  “ToolbarWindow32″

00000015`42b226e0  “tooltips_class32″

00000015`42b227c0  “msctls_statusbar32″

00000015`42b228a0  “SysListView32″

00000015`42b22980  “SysHeader32″

00000015`42b22a50  “SysTabControl32″

00000015`42b22b30  “SysTreeView32″

00000015`42b22c10  “msctls_trackbar32″

00000015`42b22cf0  “msctls_updown32″

00000015`42b22dd0  “msctls_progress32″

00000015`42b22eb0  “msctls_hotkey32″

00000015`42b22f8f  “‘SysAnimate32″

00000015`42b230f0  “SysIPAddress32″

00000015`42b231d0  “ReBarWindow32″

00000015`42b232b0  “ComboBoxEx32″

00000015`42b23390  “SysMonthCal32″

00000015`42b23470  “SysDateTimePick32″

00000015`42b23550  “DropDown”

00000015`42b23620  “SysLink”

00000015`42b236f0  “SysPager”

00000015`42b23960  “msctls_netaddress”
[...]
00000015`42d175e0  "OutlookFbThreadWnd"

00000015`42d19720  "WinDbgFrameClass"

00000015`42d19750  "DockClass"

00000015`42d19770  "GhostClass"

00000015`42d19a30  "ATL:00007FF60D792730"

00000015`42d1a0f0  "MSCTFIME Composition"

00000015`42d1a4af  "%OleMainThreadWndClass"

00000015`42d1be10  "CicMarshalWndClass"

00000015`42d1c0e0  "VSyncHelper-00000040EC4CA5F0-1f8"

00000015`42d1c100  "8855daf"

00000015`42d1c190  "URL Moniker Notification Window"

00000015`42d1c390  "UserAdapterWindowClass"

00000015`42d1d080  "@>zG#"

00000015`42d1dcaf  "!VSyncHelper-00000040D60C5850-1e"

00000015`42d1dccf  "ef0477df"

00000015`42d20d50  "VSyncHelper-00000040F39C5650-1f0"

00000015`42d20d70  "313c5a0"

00000015`42d250d0  "#32770"

00000015`42d250f0  "URL Moniker Notification Window"

00000015`42d29270  "VSyncHelper-00000079321C32E0-1f2"

00000015`42d29290  "fb11f8c"

00000015`42d2a1d0  "MSCTFIME Composition"

00000015`42d2a480  "CicMarshalWndClass"

00000015`42d2ac80  "MSCTFIME Composition"

00000015`42d2b8d0  "ShockwaveFlashFullScreen"

00000015`42d2bbb8  "P?U!\"

00000015`42d2c690  "Xaml_WindowedPopupClass"

00000015`42d30a10  "ShockwaveFlashFullScreen"

00000015`42d30b50  "MSCTFIME UI"

00000015`42d30b90  "WinBaseClass"

00000015`42d3441f  "!Alternate Owner"

00000015`42d34460  "ShockwaveFlashFullScreen"

00000015`42d344a0  "ATL:00007FF60D792530"

00000015`42d34a50  "SysAnimate32"

00000015`42d34a7f  "'ComboBoxEx32"

00000015`42d34ed0  "tooltips_class32"

00000015`42d34f00  "msctls_statusbar32"

00000015`42d35e70  "RawInputClass"

00000015`42d36a10  "SysTabControl32"

00000015`42d38650  "CicMarshalWndClass"

00000015`42d38eb0  "#32772"

00000015`42d3951f  "!VSyncHelper-000000C9DA06CD10-1f"

00000015`42d3953f  "110e8d16"
- Dmitry Vostokov @ DumpAnalysis.org + TraceAnalysis.org -
We found out that in Windows 10 (at least on our working system) Notepad is no longer a single threaded application even without opening any common dialogs (like in Evental Dumps analysis pattern example). It has at least 3 additional threads (and other modeling applications we use for our training also have additional threads):
0:000> ~*k
   0  Id: 3a64.3b38 Suspend: 1 Teb: 00007ff6`a914d000 Unfrozen

# Child-SP          RetAddr           Call Site

00 000000e5`6298f938 00007ffa`e57cf8e5 USER32!NtUserGetMessage+0xa

01 000000e5`6298f940 00007ff6`a9603470 USER32!GetMessageW+0x25

02 000000e5`6298f970 00007ff6`a96141f5 notepad!WinMain+0x178

03 000000e5`6298f9f0 00007ffa`e3b42d92 notepad!WinMainCRTStartup+0x1c5

04 000000e5`6298fab0 00007ffa`e5bc9f64 KERNEL32!BaseThreadInitThunk+0x22

05 000000e5`6298fae0 00000000`00000000 ntdll!RtlUserThreadStart+0x34
   1  Id: 3a64.38b0 Suspend: 1 Teb: 00007ff6`a914b000 Unfrozen

# Child-SP          RetAddr           Call Site

00 000000e5`62bffa58 00007ffa`e5bf93a5 ntdll!NtWaitForWorkViaWorkerFactory+0xa

01 000000e5`62bffa60 00007ffa`e3b42d92 ntdll!TppWorkerThread+0x295

02 000000e5`62bffe60 00007ffa`e5bc9f64 KERNEL32!BaseThreadInitThunk+0x22

03 000000e5`62bffe90 00000000`00000000 ntdll!RtlUserThreadStart+0x34
   2  Id: 3a64.3940 Suspend: 1 Teb: 00007ff6`a9149000 Unfrozen

# Child-SP          RetAddr           Call Site

00 000000e5`62c7f718 00007ffa`e5bf93a5 ntdll!NtWaitForWorkViaWorkerFactory+0xa

01 000000e5`62c7f720 00007ffa`e3b42d92 ntdll!TppWorkerThread+0x295

02 000000e5`62c7fb20 00007ffa`e5bc9f64 KERNEL32!BaseThreadInitThunk+0x22

03 000000e5`62c7fb50 00000000`00000000 ntdll!RtlUserThreadStart+0x34
   3  Id: 3a64.1030 Suspend: 1 Teb: 00007ff6`a9147000 Unfrozen

# Child-SP          RetAddr           Call Site

00 000000e5`62d1f878 00007ffa`e5bf93a5 ntdll!NtWaitForWorkViaWorkerFactory+0xa

01 000000e5`62d1f880 00007ffa`e3b42d92 ntdll!TppWorkerThread+0x295

02 000000e5`62d1fc80 00007ffa`e5bc9f64 KERNEL32!BaseThreadInitThunk+0x22

03 000000e5`62d1fcb0 00000000`00000000 ntdll!RtlUserThreadStart+0x34
This gave us an idea for the analysis pattern we call Not My Thread since additional threads can be started by any other process DLLs, for example, by Hooksware. However, we need to distinguish between unexpectedly added threads, threads with Special Stack Traces and Special Threads, for example, from .NET support.
- Dmitry Vostokov @ DumpAnalysis.org + TraceAnalysis.org -