Archive for the ‘Science of Software Tracing’ Category
Sunday, September 23rd, 2012
Learn from this Webinar about phenomenological, hermeneutical and analytical approaches to software diagnostics and its knowledge, foundations, norms, theories, logic, methodology, language, ontology, nature and truth. This seminar is hosted by Software Diagnostics Services.

Title: Introduction to Philosophy of Software Diagnostics
Date: 17th of December, 2012
Time: 19:00 GMT
Duration: 60 minutes
Space is limited.
Reserve your Webinar seat now at:
https://www3.gotomeeting.com/register/872846486
- Dmitry Vostokov @ DumpAnalysis.org + TraceAnalysis.org -
Posted in Announcements, Computer Science, Core Dump Analysis, Crash Dump Analysis, Crash Dump Patterns, Debugging, Debugging Methodology, Education and Research, Escalation Engineering, First Fault Software Diagnostics, Hermeneutics of Memory Dumps and Traces, Logic, Memiotics (Memory Semiotics), Memoretics, Memory Dump Analysis Methodology, Performance Monitoring, Phenomenology of Software Diagnostics, Philosophy, Philosophy of Software Diagnostics, Root Cause Analysis, Science of Memory Dump Analysis, Science of Software Tracing, Semiotics, Software Behavior Patterns, Software Diagnostics, Software Diagnostics Institute, Software Diagnostics Pattern Language, Software Diagnostics Patterns, Software Diagnostics Services, Software and Philosophy, Systems Theory, Systems Thinking, Testing, The Way of Philip Marlowe, Trace Analysis Patterns, Unified Software Diagnostics, Webinars | No Comments »
Tuesday, July 3rd, 2012
When depicting trace analysis patterns I used two-dimensional diagrams based on CDF (ETW) traces such as this one for a bifurcation point:

While working today on a new pattern I needed a new expressive way to graphically illustrate the same idea of trace bifurcation points but without too much drawing. Traces from particle chambers and scattering diagrams came to my imagination after draw the first few diagrams illustrating bifurcation points:

Time directional arrow end can be omitted:

Trace variation after a bifurcation point can be indicated by angle partition:

The case when a variation also happens before is illustrated on this diagram:

and the case with several bifurcations:

Are N-bifurcations like on the diagram below possible?

Yes, they are, if the course of execution depends on some non-binary trace message parameter such as a loaded module that implements a required interface differently.
- Dmitry Vostokov @ DumpAnalysis.org + TraceAnalysis.org -
Posted in CDF Analysis Tips and Tricks, Event Tracing for Windows (ETW), Science of Software Tracing, Software Narratology, Software Trace Analysis, Software Trace Diagramming, Software Trace Visualization, Trace Analysis Patterns | 1 Comment »
Sunday, April 15th, 2012
In a week this short full color book should appear in online bookstores:
- Title: Software Narratology: An Introduction to the Applied Science of Software Stories
- Authors: Dmitry Vostokov, Memory Dump Analysis Services
- Description: This is a transcript of Memory Dump Analysis Services Webinar about Software Narratology: an exciting new discipline and a field of research founded by DumpAnalysis.org. When software executes it gives us its stories in the form of UI events, software traces and logs. Such stories can be analyzed for their structure and patterns for troubleshooting, debugging and problem resolution purposes. Topics also include software narremes and their types, anticipatory software construction and software diagnostics.
- Publisher: OpenTask (April 2012)
- Language: English
- Product Dimensions: 28.0 x 21.6
- Paperback: 26 pages
- ISBN-13: 978-1908043078

- Dmitry Vostokov @ DumpAnalysis.org + TraceAnalysis.org -
Posted in Announcements, Books, CDF Analysis Tips and Tricks, Code Reading, Computer Science, Debugging, Debugging Methodology, Debugging Trends, Education and Research, Escalation Engineering, Event Tracing for Windows (ETW), Hermeneutics of Memory Dumps and Traces, Ideas, Narralog Programming Language, New Debugging School, Pattern-Driven Debugging, Pattern-Driven Software Support, Presentations, Publishing, Root Cause Analysis, SPDL, Science of Software Tracing, Software Behavior DNA, Software Behavior Patterns, Software Behavioral Genome, Software Diagnostics, Software Engineering, Software Narrative Fiction, Software Narrative Science, Software Narratology, Software Narremes, Software Problem Description Patterns, Software Problem Solving, Software Technical Support, Software Trace Analysis, Software Trace Analysis and History, Software Trace Deconstruction, Software Trace Linguistics, Software Trace Modeling, Software Trace Reading, Software Trace Visualization, Software Tracing Implementation Patterns, Software Troubleshooting Patterns, Structural Trace Patterns, Systems Thinking, Testing, Tools, Trace Analysis Patterns, Training and Seminars, Troubleshooting Methodology, UI Problem Analysis Patterns, Unified Debugging Patterns, Unified Software Diagnostics, Webinars | No Comments »
Monday, April 9th, 2012
Memory Dump Analysis Services organizes a free Webinar on Unified Software Diagnostics (USD) and the new scalable cost-effective software support model called Pattern-Driven Software Support devised to address various shortcomings in existing tiered software support organizations. Examples cover Windows, Mac OS and Linux.

Date: 22nd of June, 2012
Time: 17:00 (BST) 12:00 (EST) 09:00 (PST)
Duration: 60 minutes
Space is limited.
Reserve your Webinar seat now at:
https://www3.gotomeeting.com/register/172771078
- Dmitry Vostokov @ DumpAnalysis.org + TraceAnalysis.org -
Posted in Announcements, Best Practices, Crash Dump Analysis, Crash Dump Patterns, Debugging, Debugging Methodology, Debugging Trends, Economics, Escalation Engineering, Event Tracing for Windows (ETW), JIT Crash Analysis, JIT Memory Space Analysis, Malware Analysis, Malware Patterns, Memoretics, Memory Analysis Forensics and Intelligence, Memory Dump Analysis Methodology, Memory Dump Analysis Services, New Acronyms, New Debugging School, Pattern Prediction, Pattern-Driven Debugging, Pattern-Driven Software Support, Root Cause Analysis, Science of Memory Dump Analysis, Science of Software Tracing, Software Behavior DNA, Software Behavior Patterns, Software Behavioral Genome, Software Diagnostics, Software Engineering, Software Narratology, Software Problem Description Patterns, Software Problem Solving, Software Support Patterns, Software Technical Support, Software Trace Analysis, Software Troubleshooting Patterns, Software Victimology, Software and Economics, Structural Memory Patterns, Structural Trace Patterns, Systems Thinking, Testing, Tools, Trace Analysis Patterns, Training and Seminars, Troubleshooting Methodology, UI Problem Analysis Patterns, Unified Debugging Patterns, Unified Software Diagnostics, Victimware, Webinars, Workaround Patterns | No Comments »
Tuesday, March 20th, 2012
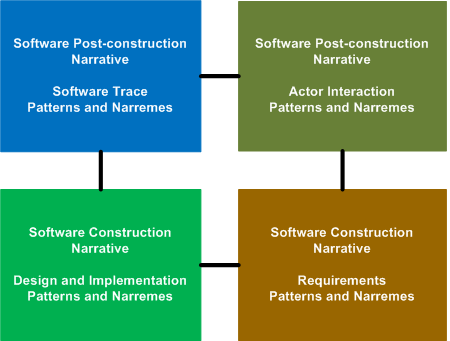
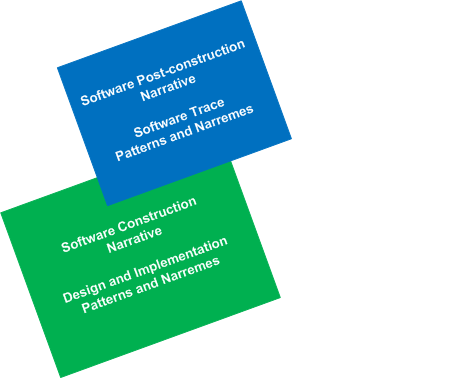
The previous definition of software narratology was restricted to software traces and logs (the top left quadrant on a software narrative square, also the part of Memoretics which studies memory snapshots). Now, with the broadening of the domain of software narratology to the whole world of software narrative stories including actor interactions with software in construction requirements use cases and post-construction incidents we give another definition:
Software narrative is a representation of software events and changes of state. Software Narratology is a discipline that studies such software narratives (software narrative science).
- Dmitry Vostokov @ DumpAnalysis.org + TraceAnalysis.org -
Posted in Announcements, Cloud Computing, Code Reading, Computer Forensics, Computer Science, Crash Dump Analysis, Crash Dump Patterns, Debugging, Memoretics, Science of Memory Dump Analysis, Science of Software Tracing, Software Behavior DNA, Software Behavior Patterns, Software Behavioral Genome, Software Engineering, Software Narrative Science, Software Narratology, Software Narremes, Software Problem Description Patterns, Software Problem Solving, Software Technical Support, Software Trace Analysis, Software Trace Deconstruction, Software Trace Modeling, Software Trace Reading, Structural Trace Patterns, Testing, Trace Analysis Patterns | No Comments »
Sunday, March 11th, 2012
After introducing software narrative planes it is logical to expand the field of software narratology to cover the whole domain of software construction and post-construction. We therefore combine both pairs of planes to create a narratological square:
Please also register for the forthcoming free Webinar: Introduction to Software Narratology where I plan to provide a coherent overview of the recent developments in this new field.
- Dmitry Vostokov @ DumpAnalysis.org + TraceAnalysis.org -
Posted in Computer Science, Debugging, Science of Software Tracing, Software Engineering, Software Narrative Science, Software Narratology, Software Narremes, Software Problem Description Patterns, Software Problem Solving, Software Trace Analysis | No Comments »
Sunday, March 11th, 2012
Based on an idea of expression and content planes from glossematics with a basic unit of glosseme we can organize software traces with corresponding patterns and software trace narremes (basic units of software narrative such as traces and event logs) into 2 planes: software trace narrative plane (expression) with narremes and the corresponding program lines of traces (PLOTs) source code and design plane (content) with their own set of construction narremes such as collaboration of software constructs. All this corresponds to the following diagram:
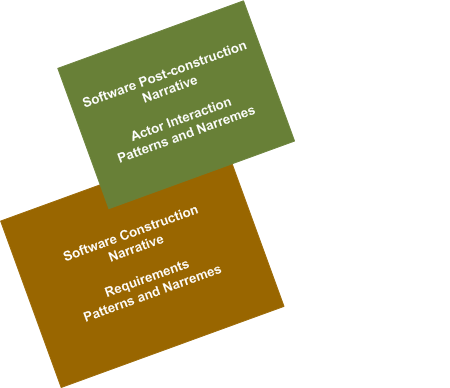
The same can be said about actor interaction level of software construction (what ought to be) and post-construction (what is) phases having their own construction and post-construction narratives, patterns and narremes such as in requirements (use cases) and in problem and software incident descriptions:
In the forthcoming articles I provide more examples and explanations including specific software narremes useful from the practical post-construction software problem solving perspective. Please also register for the forthcoming free Webinar: Introduction to Software Narratology where I plan to provide a coherent overview of this new field.
- Dmitry Vostokov @ DumpAnalysis.org + TraceAnalysis.org -
Posted in Computer Science, Science of Software Tracing, Software Narratology, Software Narremes, Software Problem Solving, Software Trace Analysis, Software Trace Linguistics | No Comments »
Sunday, February 19th, 2012
Memory Dump Analysis Services (DumpAnalysis.com) organizes a free Webinar about software narratology: an application of ideas from narratology to software narrative stories.

Learn about this exciting new discipline and a field of research. When software executes it gives us its stories in the form of UI events, software traces and logs. Such stories can be analyzed for their structure and patterns for troubleshooting, debugging and problem resolution purposes.
Prerequisites: basic software troubleshooting and ability to read software generated logs.
Audience: anyone can benefit from this new perspective: from software users to software engineers and managers.
Space is limited.
Reserve your Webinar seat now at:
https://www3.gotomeeting.com/register/603136294
- Dmitry Vostokov @ DumpAnalysis.org + TraceAnalysis.org -
Posted in Announcements, Computer Science, Debugging, Escalation Engineering, Intelligence Analysis Patterns, Memory Dump Analysis Services, SPDL, Science of Software Tracing, Security, Software Behavior DNA, Software Behavior Patterns, Software Behavioral Genome, Software Engineering, Software Narrative Fiction, Software Narratology, Software Problem Description Patterns, Software Problem Solving, Software Technical Support, Software Trace Analysis, Software Trace Deconstruction, Software Trace Linguistics, Software Trace Modeling, Software Trace Reading, Software Trace Visualization, Software Tracing Implementation Patterns, Software Tracing for Dummies, Software Troubleshooting Patterns, Software Victimology, Structural Trace Patterns, Testing, Tools, Trace Analysis Patterns, Troubleshooting Methodology, UI Problem Analysis Patterns, Unified Debugging Patterns, Unit Testing, Victimware, Webinars, Windows System Administration | No Comments »
Monday, January 2nd, 2012
Based on ideas of Roman Jakobson about “marked” and “unmarked” categories we propose another pattern called Marked Message that groups trace messages based on having some feature or property. For example, marked messages may point to some domain of software activity such related to functional requirements and therefore may help in troubleshooting and debugging. Unmarked messages include all other messages that don’t say anything about such activities (although may include messages pointing to such activities indirectly we unaware of) or messages that say explicitly that no such activity has occurred. We can even borrow a notation of distinctive features from phonology and annotate any trace or log after analysis to compare it with a master trace, for example, compose the following list of software trace distinctive features:
session database queries [+]
session initialization [-]
socket activity [+]
process A launched [+]
process B launched [-]
process A exited [-]
[…]
Here [+] means the activity is present in the trace and [-] means the activity is either undetected or definitely not present. Sometime a non-present activity can be a marked activity corresponding to all inclusive unmarked present activity (see, for example, No Activity pattern).
- Dmitry Vostokov @ DumpAnalysis.org + TraceAnalysis.org -
Posted in Debugging, Science of Software Tracing, Software Narratology, Software Trace Analysis, Software Trace Linguistics, Software Trace Reading, Trace Analysis Patterns | No Comments »
Saturday, December 17th, 2011
The number of software trace analysis patterns approaches the critical mass of 50 and we have decided to focus on software tracing and logging in the forthcoming year. Some books on tracing including Volume 7 of Memory Dump Analysis Anthology will be published by OpenTask during that year and our efforts will be to further advance software narratology, software trace linguistics, and software trace analysis in the context of memory dump analysis, generative debugging and modeling software behavior.
- Dmitry Vostokov @ DumpAnalysis.org + TraceAnalysis.org -
Posted in Announcements, CDF Analysis Tips and Tricks, Debugging, Generative Debugging, Memoretics, Science of Software Tracing, Software Behavior DNA, Software Behavior Patterns, Software Behavioral Genome, Software Narratology, Software Trace Analysis, Software Trace Analysis and History, Software Trace Deconstruction, Software Trace Linguistics, Software Trace Reading, Software Trace Visualization, Software Tracing Implementation Patterns, Software Tracing for Dummies, Trace Analysis Patterns | No Comments »
Monday, December 12th, 2011
More than 4 years passed since I provided a longer structuralist definition. Recently I came to recognize a pattern-driven iterative and incremental nature of memory and software trace analysis and post-construction software problem solving in general and therefore a one sentence definition became necessary:
“Recognition and interpretation of patterns of software behavior”
- Dmitry Vostokov @ DumpAnalysis.org + TraceAnalysis.org -
Posted in Announcements, Crash Dump Analysis, Crash Dump Patterns, Malware Analysis, Malware Patterns, Memiotics (Memory Semiotics), Memoretics, Memory Analysis Forensics and Intelligence, Science of Memory Dump Analysis, Science of Software Tracing, Software Behavior Patterns, Software Narratology, Software Problem Solving, Software Trace Analysis, Structural Memory Patterns, Structural Trace Patterns, Trace Analysis Patterns, Victimware | No Comments »
Thursday, November 3rd, 2011
The new 6th volume contains revised, edited, cross-referenced, and thematically organized selected DumpAnalysis.org blog posts about memory dump and software trace analysis, software troubleshooting and debugging written in November 2010 - October 2011 for software engineers developing and maintaining products on Windows platforms, quality assurance engineers testing software on Windows platforms, technical support and escalation engineers dealing with complex software issues, and security researchers, malware analysts and reverse engineers. The sixth volume features:
- 56 new crash dump analysis patterns including 14 new .NET memory dump analysis patterns
- 4 new pattern interaction case studies
- 11 new trace analysis patterns
- New Debugware pattern
- Introduction to UI problem analysis patterns
- Introduction to intelligence analysis patterns
- Introduction to unified debugging pattern language
- Introduction to generative debugging, metadefect template library and DNA of software behaviour
- The new school of debugging and trends
- .NET memory dump analysis checklist
- Software trace analysis checklist
- Introduction to close and deconstructive readings of a software trace
- Memory dump analysis compass
- Computical and Stack Trace Art
- The abductive reasoning of Philip Marlowe
- Orbifold memory space and cloud computing
- Memory worldview
- Interpretation of cyberspace
- Relationship of memory dumps to religion
- Fully cross-referenced with Volume 1, Volume 2, Volume 3, Volume 4, and Volume 5
Product information:
- Title: Memory Dump Analysis Anthology, Volume 6
- Author: Dmitry Vostokov
- Language: English
- Product Dimensions: 22.86 x 15.24
- Paperback: 300 pages
- Publisher: Opentask (December 2011)
- ISBN-13: 978-1-908043-19-1
- Hardcover: 300 pages
- Publisher: Opentask (January 2012)
- ISBN-13: 978-1-908043-20-7

Back cover features 3d memory space visualization image created with ParaView.
- Dmitry Vostokov @ DumpAnalysis.org + TraceAnalysis.org -
Posted in .NET Debugging, Announcements, Art, Books, Cloud Computing, Cloud Memory Dump Analysis, Common Mistakes, Complete Memory Dump Analysis, Computer Science, Computicart (Computical Art), Crash Dump Analysis, Crash Dump Patterns, Cyber Intelligence, Cyber Problems, Cyber Security, Cyber Space, Cyber Warfare, DebugWare Patterns, Debugging, Debugging Industry, Debugging Methodology, Debugging Slang, Debugging Trends, Escalation Engineering, Generative Debugging, Intelligence Analysis Patterns, Kernel Development, Memoidealism, Memoretics, Memory Visualization, Metadefect Template Library, New Debugging School, Philosophy, Physicalist Art, Publishing, Root Cause Analysis, Science of Memory Dump Analysis, Science of Software Tracing, Security, Software Behavior DNA, Software Behavior Patterns, Software Behavioral Genome, Software Engineering, Software Narratology, Software Technical Support, Software Trace Analysis, Software Trace Deconstruction, Software Trace Reading, Software Victimology, Testing, The Way of Philip Marlowe, Tools, Trace Analysis Patterns, Training and Seminars, Troubleshooting Methodology, UI Problem Analysis Patterns, Unified Debugging Patterns, Victimware, WinDbg Tips and Tricks, Windows 7, Windows Azure, Windows Data Structures, Windows Server 2008, Windows System Administration, x64 Windows | No Comments »
Wednesday, September 21st, 2011
The Memory Worldview consists of 3 parts:
1. The Science of Memoretics
2. The Philosophy of Memoidealism (including Memory as the first principle)
3. The Memory Religion (Memorianity)

- Dmitry Vostokov @ DumpAnalysis.org + TraceAnalysis.org -
Posted in Computer Science, Memoidealism, Memoretics, Memory Religion (Memorianity), Metaphysics of Memory Worldview, Philosophy, Religion, Science of Memory Dump Analysis, Science of Software Tracing | No Comments »
Wednesday, September 21st, 2011
Memoretics promotes pattern-driven memory dump and software trace analysis which has many uses but not limited to:
- Software and site reliability
- Software Debugging
- QA and Software Testing
- Computer Security
- Software Troubleshooting
- Malware Research and Analysis
- Tools as a Service (TaaS)
- Supportability
- Software Diagnostics

- Dmitry Vostokov @ DumpAnalysis.org + TraceAnalysis.org -
Posted in Cloud Memory Dump Analysis, Computer Forensics, Crash Dump Analysis, Crash Dump Patterns, DebugWare Patterns, Debugging, Debugging Trends, Escalation Engineering, Malware Analysis, Malware Patterns, Memiotics (Memory Semiotics), Memoretics, Memory Analysis Forensics and Intelligence, Metadefect Template Library, Metamalware, Pattern Models, Pattern Prediction, Reverse Engineering, Root Cause Analysis, Science of Memory Dump Analysis, Science of Software Tracing, Security, Software Behavior DNA, Software Behavior Patterns, Software Behavioral Genome, Software Defect Construction, Software Engineering, Software Generalist, Software Narratology, Software Support Patterns, Software Technical Support, Software Trace Analysis, Software Troubleshooting Patterns, Structural Memory Patterns, Structural Trace Patterns, Systems Thinking, Testing, Tools, Trace Analysis Patterns, Troubleshooting Methodology, UI Problem Analysis Patterns, Unified Debugging Patterns, Victimware, Windows System Administration, Workaround Patterns | No Comments »
Wednesday, September 21st, 2011
Memoretics as a science of memory snapshots borrows many ideas from the following disciplines (the list is not exhaustive):
- Troubleshooting and Debugging
- Intelligence Analysis
- Critical Thinking
- Forensics
- Linguistics
- Archaeology
- Psychoanalysis
- History
- Mathematics: Sets and Categories
- Literary Criticism and Narratology
It also contributes many ideas back. The following diagram depicts such an interaction:

- Dmitry Vostokov @ DumpAnalysis.org + TraceAnalysis.org -
Posted in Archaeology of Computer Memory, Categorical Debugging, Computer Forensics, Computer Science, Countefactual Debugging, Crash Dump Analysis, Crash Dump De-analysis, Crash Dump Patterns, Debugging, Debugging Methodology, Dublin School of Security, Education and Research, Escalation Engineering, General Memory Analysis, Generative Debugging, Hermeneutics of Memory Dumps and Traces, History, Intelligence Analysis Patterns, M->analysis, Malware Analysis, Malware Patterns, Mathematics of Debugging, Memiotics (Memory Semiotics), Memoretics, Memory Analysis Forensics and Intelligence, Memory Dump Analysis and History, Memory Systems Language, Memory Visualization, Metadefect Template Library, Metamalware, New Debugging School, Paleo-debugging, Pattern Models, Pattern Prediction, Psychoanalysis of Software Maintenance and Support, Psychology, Reverse Engineering, Root Cause Analysis, Science of Memory Dump Analysis, Science of Software Tracing, Security, Software Architecture, Software Behavior DNA, Software Behavior Patterns, Software Behavioral Genome, Software Chorography, Software Chorology, Software Defect Construction, Software Engineering, Software Narratology, Software Technical Support, Software Trace Analysis, Software Trace Analysis and History, Software Trace Deconstruction, Software Trace Linguistics, Software Trace Reading, Software Trace Visualization, Software Tracing Implementation Patterns, Software Troubleshooting Patterns, Software Victimology, Software and History, Structural Memory Analysis and Social Sciences, Structural Memory Patterns, Structural Trace Patterns, Systems Thinking, Testing, Tools, Trace Analysis Patterns, Troubleshooting Methodology, UI Problem Analysis Patterns, Unified Debugging Patterns, Victimware, Virtualization, Visual Dump Analysis, Workaround Patterns | No Comments »
Sunday, April 17th, 2011
I’m pleased to announce that MDAA, Volume 5 is available in PDF format:
www.dumpanalysis.org/Memory+Dump+Analysis+Anthology+Volume+5
It features:
- 25 new crash dump analysis patterns
- 11 new pattern interaction case studies (including software tracing)
- 16 new trace analysis patterns
- 7 structural memory patterns
- 4 modeling case studies for memory dump analysis patterns
- Discussion of 3 common analysis mistakes
- Malware analysis case study
- Computer independent architecture of crash analysis report service
- Expanded coverage of software narratology
- Metaphysical and theological implications of memory dump worldview
- More pictures of memory space and physicalist art
- Classification of memory visualization tools
- Memory visualization case studies
- Close reading of the stories of Sherlock Holmes: Dr. Watson’s observational patterns
- Fully cross-referenced with Volume 1, Volume 2, Volume 3, and Volume 4
Its table of contents is available here:
www.dumpanalysis.org/MDAA/MDA-Anthology-V5-TOC.pdf
Paperback and hardcover versions should be available in a week or two. I also started working on Volume 6 that should be available in November-December.
- Dmitry Vostokov @ DumpAnalysis.org + TraceAnalysis.org -
Posted in Aesthetics of Memory Dumps, Analysis Notation, Announcements, AntiPatterns, Archaeology of Computer Memory, Art, Assembly Language, Best Practices, Books, C and C++, CDF Analysis Tips and Tricks, Categorical Debugging, Citrix, Common Mistakes, Common Questions, Complete Memory Dump Analysis, Computer Forensics, Computer Science, Crash Analysis Report Environment (CARE), Crash Dump Analysis, Crash Dump De-analysis, Crash Dump Patterns, Crash Dumps for Dummies, Cyber Warfare, Debugging, Debugging Bureau, Debugging Industry, Debugging Methodology, Debugging Slang, Debugging Trends, Deep Down C++, Dr. Watson, Dublin School of Security, Education and Research, Escalation Engineering, Fun with Crash Dumps, Fun with Debugging, Fun with Software Traces, General Memory Analysis, Hermeneutics of Memory Dumps and Traces, Images of Computer Memory, Kernel Development, Malware Analysis, Mathematics of Debugging, Memiotics (Memory Semiotics), Memory Analysis Forensics and Intelligence, Memory Diagrams, Memory Dump Analysis Services, Memory Dumps in Myths, Memory Space Art, Memory Systems Language, Memory Visualization, Memory and Glitches, Metaphysics of Memory Worldview, Multithreading, Music for Debugging, New Acronyms, New Debugging School, New Words, Pattern Models, Philosophy, Physicalist Art, Publishing, Reverse Engineering, Science of Memory Dump Analysis, Science of Software Tracing, Security, Software Architecture, Software Behavior Patterns, Software Chorography, Software Chorology, Software Defect Construction, Software Engineering, Software Generalist, Software Maintenance Institute, Software Narratology, Software Technical Support, Software Trace Analysis, Software Trace Reading, Software Trace Visualization, Software Tracing for Dummies, Software Troubleshooting Patterns, Software Victimology, Structural Memory Patterns, Structural Trace Patterns, Systems Thinking, Testing, The Way of Philip Marlowe, Tools, Trace Analysis Patterns, Training and Seminars, Troubleshooting Methodology, Victimware, Vista, Webinars, WinDbg Scripting Extensions, WinDbg Scripts, WinDbg Tips and Tricks, WinDbg for GDB Users, Windows 7, Windows Server 2008, Windows System Administration, Workaround Patterns, x64 Windows | No Comments »
Saturday, January 1st, 2011
With the new year starts the new initiative to integrate traditional multidisciplinary debugging approaches and methodologies with multiplatform pattern-driven software problem solving, unified debugging patterns, best practices in memory dump analysis and software tracing, computer security, economics, and the new emerging trends I’m going to write about during this year.
- Dmitry Vostokov @ DumpAnalysis.org + TraceAnalysis.org -
Posted in Announcements, Best Practices, Computer Forensics, Computer Science, Countefactual Debugging, Crash Analysis Report Environment (CARE), Crash Dump Analysis, Crash Dump Patterns, DebugWare Patterns, Debugging, Debugging Industry, Debugging Methodology, Debugging Trends, Dublin School of Security, Economics, Education and Research, Escalation Engineering, First Fault Problem Solving, Malware Analysis, Malware Patterns, Mathematics of Debugging, Memiotics (Memory Semiotics), Memoretics, Memory Analysis Forensics and Intelligence, Memory Analysis Report System, Memory Dump Analysis Services, Memory Systems Language, Memory Visualization, New Debugging School, Science of Memory Dump Analysis, Science of Software Tracing, Security, Software Behavior Patterns, Software Defect Construction, Software Engineering, Software Generalist, Software Maintenance Institute, Software Narratology, Software Trace Analysis, Software Trace Visualization, Software Tracing Implementation Patterns, Software Troubleshooting Patterns, Structural Memory Patterns, Structural Trace Patterns, Systems Thinking, Testing, Tool Objects, Tools, Trace Analysis Patterns, Training and Seminars, Troubleshooting Methodology, Unified Debugging Patterns, Victimware, Visual Dump Analysis, Webinars, Workaround Patterns | No Comments »
Friday, December 17th, 2010
As the new decade is approaching (2011-2020) we would like to make a few previews and predictions:
- Increased complexity of software will bring more methods from biological, social sciences and humanities in addition to existing methods of automated debugging and computer science techniques
- Focus on first fault software problem solving (when aspect)
- Focus on pattern-driven software problem solving (how aspect)
- Fusion of debugging and malware analysis into a unified structural and behavioral pattern framework
- Visual debugging, memory and software trace visualization techniques
- Software maintenance certification
- Focus on domain-driven troubleshooting and debugging tools as a service (debugware TaaS)
- Focus on security issues related to memory dumps and software traces
- New scripting languages and programming language extensions for debugging
- The maturation of the science of memory snapshots and software traces (memoretics)
Imagining is not not limited to the above and more to come and explain in the forthcoming parts.
- Dmitry Vostokov @ DumpAnalysis.org + TraceAnalysis.org -
Posted in Announcements, Anthropology, Archaeology of Computer Memory, Biology, Certification, Computer Science, Countefactual Debugging, Crash Analysis Report Environment (CARE), Crash Dump Analysis, Crash Dump Patterns, DebugWare Patterns, Debugging, Debugging Industry, Debugging Methodology, Debugging Trends, Dublin School of Security, EasyDbg, Economics, Escalation Engineering, Evolution, First Fault Problem Solving, Futuristic Memory Dump Analysis, General Memory Analysis, General Science, Geography, Hardware, Hermeneutics of Memory Dumps and Traces, History, Humanities, Language, Laws of Troubleshooting and Debugging, Logic, Malware Analysis, Malware Patterns, Mathematics of Debugging, Memiotics (Memory Semiotics), Memoretics, Memory Analysis Forensics and Intelligence, Memory Analysis Report System, Memory Dump Analysis and History, Memory Systems Language, Memory Visualization, Paleo-debugging, Pattern Models, Pattern Prediction, Physics, Psychology, Publishing, Science of Memory Dump Analysis, Science of Software Tracing, Security, Social Media, Social Sciences, Software Architecture, Software Behavior Patterns, Software Chorography, Software Chorology, Software Defect Construction, Software Engineering, Software Generalist, Software Maintenance Institute, Software Narrative Fiction, Software Narratology, Software Technical Support, Software Trace Analysis, Software Trace Analysis and History, Software Trace Deconstruction, Software Trace Linguistics, Software Trace Visualization, Software Troubleshooting Patterns, Software Victimology, Statistics, Structural Memory Analysis and Social Sciences, Structural Memory Patterns, Structural Trace Patterns, Systems Thinking, Testing, Tools, Trace Analysis Patterns, Troubleshooting Methodology, Unified Debugging Patterns, Uses of UML, Victimware, Virtualization, Visual Dump Analysis, Windows System Administration, Workaround Patterns | No Comments »
Friday, November 12th, 2010
Five volumes of cross-disciplinary Anthology (dubbed by the author “The Summa Memorianica”) lay the foundation of the scientific discipline of Memoretics (study of computer memory snapshots and their evolution in time) that is also called Memory Dump and Software Trace Analysis.ca
The 5th volume contains revised, edited, cross-referenced, and thematically organized selected DumpAnalysis.org blog posts about crash dump, software trace analysis and debugging written in February 2010 - October 2010 for software engineers developing and maintaining products on Windows platforms, quality assurance engineers testing software on Windows platforms, technical support and escalation engineers dealing with complex software issues, and security researchers, malware analysts and reverse engineers. The fifth volume features:
- 25 new crash dump analysis patterns
- 11 new pattern interaction case studies (including software tracing)
- 16 new trace analysis patterns
- 7 structural memory patterns
- 4 modeling case studies for memory dump analysis patterns
- Discussion of 3 common analysis mistakes
- Malware analysis case study
- Computer independent architecture of crash analysis report service
- Expanded coverage of software narratology
- Metaphysical and theological implications of memory dump worldview
- More pictures of memory space and physicalist art
- Classification of memory visualization tools
- Memory visualization case studies
- Close reading of the stories of Sherlock Holmes: Dr. Watson’s observational patterns
- Fully cross-referenced with Volume 1, Volume 2, Volume 3, and Volume 4
Product information:
- Title: Memory Dump Analysis Anthology, Volume 5
- Author: Dmitry Vostokov
- Language: English
- Product Dimensions: 22.86 x 15.24
- Paperback: 400 pages
- Publisher: Opentask (10 December 2010)
- ISBN-13: 978-1-906717-96-4
- Hardcover: 400 pages
- Publisher: Opentask (10 December 2010)
- ISBN-13: 978-1-906717-97-1

Back cover features memory space art image Hot Computation: Memory on Fire.
- Dmitry Vostokov @ DumpAnalysis.org + TraceAnalysis.org -
Posted in Aesthetics of Memory Dumps, Announcements, Archaeology of Computer Memory, Art, Assembly Language, Books, C and C++, CDF Analysis Tips and Tricks, Categorical Debugging, Common Mistakes, Complete Memory Dump Analysis, Computer Science, Crash Analysis Report Environment (CARE), Crash Dump Analysis, Crash Dump De-analysis, Crash Dump Patterns, Debugging, Debugging Methodology, Debugging Slang, Deep Down C++, Dr. Watson, Dublin School of Security, Education and Research, Escalation Engineering, Fun with Crash Dumps, Fun with Debugging, Fun with Software Traces, General Memory Analysis, Hermeneutics of Memory Dumps and Traces, Images of Computer Memory, Kernel Development, Malware Analysis, Malware Patterns, Mathematics of Debugging, Memiotics (Memory Semiotics), Memoidealism, Memoretics, Memory Analysis Culture, Memory Analysis Forensics and Intelligence, Memory Analysis Report System, Memory Diagrams, Memory Dreams, Memory Dump Analysis Jobs, Memory Dump Analysis Services, Memory Dump Analysis and History, Memory Dumps in Movies, Memory Dumps in Myths, Memory Religion (Memorianity), Memory Space Art, Memory Systems Language, Memory Visualization, Memory and Glitches, Memuonics, Metaphysical Society of Ireland, Minidump Analysis, Movies and Debugging, Multithreading, Museum of Debugging, Music for Debugging, Music of Computation, New Acronyms, New Words, Paleo-debugging, Pattern Models, Pattern Prediction, Philosophy, Physicalist Art, Psychoanalysis of Software Maintenance and Support, Publishing, Science of Memory Dump Analysis, Science of Software Tracing, Security, Software Architecture, Software Behavior Patterns, Software Chorography, Software Chorology, Software Defect Construction, Software Engineering, Software Generalist, Software Maintenance Institute, Software Narratology, Software Technical Support, Software Trace Analysis, Software Trace Analysis and History, Software Trace Deconstruction, Software Trace Reading, Software Trace Visualization, Software Tracing for Dummies, Software Troubleshooting Patterns, Software Victimology, Stack Trace Collection, Structural Memory Analysis and Social Sciences, Structural Memory Patterns, Structural Trace Patterns, Systems Thinking, Testing, Theology, Tool Objects, Tools, Trace Analysis Patterns, Training and Seminars, Troubleshooting Methodology, Uses of UML, Victimware, Virtualization, Vista, Visual Dump Analysis, Webinars, WinDbg Scripts, WinDbg Tips and Tricks, WinDbg for GDB Users, Windows 7, Windows Server 2008, Windows System Administration, Workaround Patterns, x64 Windows | No Comments »
Saturday, November 6th, 2010
I’m pleased to announce that MDAA, Volume 4 is available in PDF format:
www.dumpanalysis.org/Memory+Dump+Analysis+Anthology+Volume+4
It features:
- 15 new crash dump analysis patterns
- 13 new pattern interaction case studies
- 10 new trace analysis patterns
- 6 new Debugware patterns and case study
- Workaround patterns
- Updated checklist
- Fully cross-referenced with Volume 1, Volume 2 and Volume 3
- Memory visualization tutorials
- Memory space art
Its table of contents is available here:
http://www.dumpanalysis.org/MDAA/MDA-Anthology-V4-TOC.pdf
Paperback and hardcover versions should be available in a week or two. I also started working on Volume 5 that should be available in December.
- Dmitry Vostokov @ DumpAnalysis.org + TraceAnalysis.org -
Posted in .NET Debugging, Aesthetics of Memory Dumps, Announcements, AntiPatterns, Art, Assembly Language, Books, C and C++, CDF Analysis Tips and Tricks, Categorical Debugging, Common Mistakes, Complete Memory Dump Analysis, Computer Science, Countefactual Debugging, Crash Dump Analysis, Crash Dump Patterns, DebugWare Patterns, Debugging, Debugging Slang, Deep Down C++, Education and Research, Escalation Engineering, Fun with Crash Dumps, Fun with Debugging, Images of Computer Memory, Kernel Development, Memiotics (Memory Semiotics), Memoidealism, Memoretics, Memory Space Art, Memory Visualization, Memuonics, Metaphysics of Memory Worldview, Multithreading, Opcodism, Philosophy, Physicalist Art, Publishing, Science Fiction, Science of Memory Dump Analysis, Science of Software Tracing, Security, Software Architecture, Software Behavior Patterns, Software Defect Construction, Software Engineering, Software Narratology, Software Technical Support, Software Trace Analysis, Software Trace Reading, Software Victimology, Stack Trace Collection, Testing, Tools, Trace Analysis Patterns, Troubleshooting Methodology, Uses of UML, Victimware, Virtualization, Vista, Visual Dump Analysis, WinDbg Scripts, WinDbg Tips and Tricks, Windows 7, Windows Server 2008, Windows System Administration, Workaround Patterns, x64 Windows | No Comments »