Archive for the ‘Software Technical Support’ Category
Tuesday, June 24th, 2014
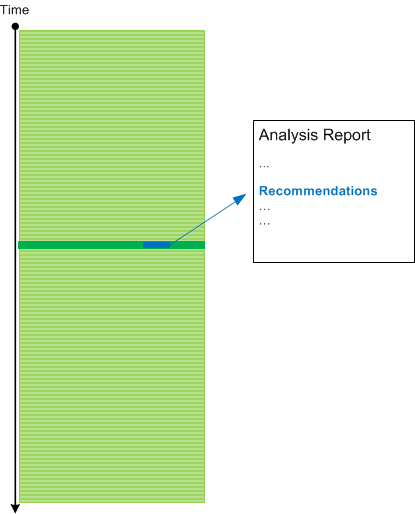
The previous patterns such as Basic Facts and Vocabulary Index address the mapping of a problem description to software execution artefacts such traces and logs. Indirect Facts analysis pattern addresses the problem of an incomplete problem description. However, we need another pattern for completeness that addresses the mapping from a log to troubleshooting and debugging recommendations. We call it Hidden Facts which are uncovered by trace analysis. Of course, there can be many such hidden facts and usually they are uncovered after narrowing down analysis to particular Threads of Activity, Adjoint Threads, Message Context, Message Set, or Data Flow. The need for that pattern had arisen during the pattern-oriented analysis of the trace case study from Malcolm McCaffery and can be illustrated on this diagram:
- Dmitry Vostokov @ DumpAnalysis.org + TraceAnalysis.org -
Posted in Debugging Environment, Log Analysis, Software Technical Support, Software Trace Analysis, Software Trace Reading, Trace Analysis Patterns, Troubleshooting Methodology | No Comments »
Monday, May 5th, 2014
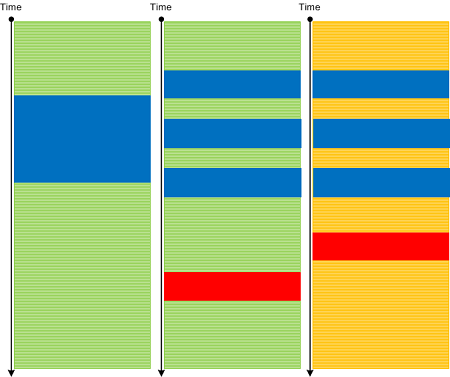
So far we have been discussing trace analysis patterns related to execution of a particular software version. However, software code changes and also its tracing and logging output: from large scale changes where components are replaced to small scale code refactoring affecting message structure and format. On a software narratological level this corresponds to a narrative about a software trace or log, it evolution. Such Meta Trace analysis pattern is different from Master Trace pattern where the latter is similar to what Metanarrative is usually meant in narratology: a master or grand idea - an expected trace if all functional requirements were correctly identified and implemented during software construction and non-functional ones are met during software execution.
- Dmitry Vostokov @ DumpAnalysis.org + TraceAnalysis.org -
Posted in Code Reading, Debugging, Log Analysis, Software Engineering, Software Narrative Science, Software Narratology, Software Technical Support, Software Trace Analysis, Software Trace Analysis and History, Software Trace Deconstruction, Software Trace Diagramming, Software Trace Reading, Software Trace Visualization, Trace Analysis Patterns | No Comments »
Friday, January 4th, 2013
Before deciding on whether to retrospect on 2012 we found that since March 14, 2008 this site has had more than 1 million visitors with more than 33% returning. So instead of just 2012 we decided to retrospect on that interval up to December 31, 2012. Google Analytics has improved since last January, 2012 and now made our task easier. So we start with the first one hundred sites referring to us:
| Source / Medium |
Visits
|
| google |
698156
|
| (direct) |
164142
|
| bing |
27923
|
| google.com |
17868
|
| windbg.org |
12994
|
| yahoo |
8682
|
| stackoverflow.com |
7194
|
| yandex |
5985
|
| windbg.dumpanalysis.org |
5375
|
| dumpanalysis.com |
5369
|
| live |
5310
|
| google.co.in |
4598
|
| blogs.msdn.com |
4385
|
| baike.baidu.com |
3475
|
| twitter.com |
2972
|
| facebook.com |
2733
|
| dumpanalysis.org |
2708
|
| images.google.com |
2314
|
| t.co |
2095
|
| baidu |
1916
|
| winvistaclub.com |
1862
|
| google.co.uk |
1449
|
| advancedwindowsdebugging.com |
1427
|
| jasonhaley.com |
1370
|
| search |
1328
|
| rsdn.ru |
1294
|
| en.wikipedia.org |
1276
|
| msn |
1256
|
| nynaeve.net |
1256
|
| blog.codeimproved.net |
1213
|
| google.de |
1074
|
| google.ca |
979
|
| reddit.com |
951
|
| bytetalk.net |
908
|
| citrixblogger.org |
819
|
| stumbleupon.com |
819
|
| linkedin.com |
780
|
| social.technet.microsoft.com |
774
|
| analyze-v.com |
757
|
| naver |
750
|
| forum.sysinternals.com |
735
|
| google.ru |
710
|
| blogs.microsoft.co.il |
693
|
| kumo.com |
678
|
| google.co.kr |
658
|
| google.com.au |
654
|
| blog.naver.com |
646
|
| reconstructer.org |
645
|
| community.citrix.com |
632
|
| blog.not-a-kernel-guy.com |
604
|
| itdatabase.com |
601
|
| advanceddotnetdebugging.com |
581
|
| serverfault.com |
564
|
| voneinem-windbg.blogspot.com |
561
|
| support.citrix.com |
555
|
| debuggingexperts.com |
549
|
| blog.miniasp.com |
527
|
| google.fr |
495
|
| caloni.com.br |
488
|
| google.com.br |
479
|
| ask |
459
|
| msuiche.net |
439
|
| insidewindows.kr |
432
|
| google.es |
430
|
| gynvael.coldwind.pl |
430
|
| blog.flexilis.com |
429
|
| aol |
418
|
| netfxharmonics.com |
416
|
| advdbg.org |
413
|
| images.google.co.uk |
401
|
| google.it |
391
|
| images.google.co.in |
391
|
| google.nl |
354
|
| serious-code.net |
340
|
| admin.itdatabase.com |
337
|
| blogs.technet.com |
334
|
| brianmadden.com |
327
|
| google.pl |
319
|
| google.com.ua |
318
|
| experts-exchange.com |
316
|
| delicious.com |
312
|
| images.google.de |
305
|
| opentask.com |
301
|
| codemachine.com |
296
|
| driveronline.org |
287
|
| google.com.tw |
282
|
| wasm.ru |
275
|
| debuglab.com |
265
|
| isisaka.com |
262
|
| literatescientist.com |
261
|
| blog.zoller.lu |
258
|
| shellexecute.wordpress.com |
257
|
| google.com.hk |
256
|
| managementbits.com |
253
|
| d.hatena.ne.jp |
251
|
| bloglines.com |
249
|
| google.com.tr |
248
|
| clausbrod.de |
246
|
| bing.com |
243
|
Next table is distribution of visits among countries:
| Country / Territory |
Visits
|
| United States |
342291
|
| India |
89303
|
| United Kingdom |
76131
|
| Russia |
46472
|
| Germany |
44472
|
| China |
40155
|
| Canada |
34781
|
| Japan |
24985
|
| France |
24084
|
| South Korea |
21056
|
| Australia |
20606
|
| Taiwan |
17949
|
| Netherlands |
15607
|
| Ireland |
15579
|
| Israel |
13514
|
| Ukraine |
13449
|
| Italy |
12542
|
| Brazil |
11834
|
| Spain |
11786
|
| Singapore |
11703
|
| Sweden |
11201
|
| Poland |
10340
|
| Romania |
9423
|
| (not set) |
8909
|
| Czech Republic |
8355
|
| Belgium |
6731
|
| Switzerland |
6624
|
| Finland |
6596
|
| Norway |
5585
|
| Malaysia |
5289
|
| Philippines |
5052
|
| Austria |
5046
|
| Denmark |
4980
|
| Hong Kong |
4914
|
| Turkey |
4728
|
| Slovakia |
4599
|
| New Zealand |
4369
|
| Portugal |
4228
|
| Argentina |
3712
|
| Belarus |
3518
|
| Hungary |
3465
|
| Bulgaria |
3301
|
| Mexico |
2960
|
| South Africa |
2945
|
| Vietnam |
2721
|
| Greece |
2712
|
| Indonesia |
2527
|
| Croatia |
1881
|
| Serbia |
1843
|
| Iran |
1842
|
| Thailand |
1726
|
| Pakistan |
1660
|
| Egypt |
1519
|
| Malta |
1422
|
| Estonia |
1385
|
| Slovenia |
1334
|
| Lithuania |
1304
|
| United Arab Emirates |
1167
|
| Chile |
1104
|
| Saudi Arabia |
1096
|
| Colombia |
1067
|
| Latvia |
922
|
| Kazakhstan |
725
|
| Peru |
649
|
| Morocco |
585
|
| Sri Lanka |
516
|
| Luxembourg |
516
|
| Moldova |
439
|
| Uruguay |
435
|
| Venezuela |
431
|
| Jordan |
425
|
| Tunisia |
425
|
| Bolivia |
418
|
| Armenia |
371
|
| Algeria |
362
|
| Costa Rica |
355
|
| Iceland |
353
|
| Panama |
352
|
| Macedonia [FYROM] |
347
|
| Bosnia and Herzegovina |
327
|
| Cyprus |
317
|
| Bangladesh |
314
|
| Nigeria |
298
|
| Puerto Rico |
296
|
| Jamaica |
251
|
| Ecuador |
248
|
| Kuwait |
239
|
| Lebanon |
218
|
| Qatar |
217
|
| Kenya |
195
|
| Georgia |
194
|
| Mongolia |
189
|
| Dominican Republic |
163
|
| Macau |
156
|
| Trinidad and Tobago |
147
|
| Bahrain |
143
|
| Uzbekistan |
142
|
| Guatemala |
141
|
| Azerbaijan |
134
|
| Mauritius |
128
|
| Oman |
117
|
| Nepal |
110
|
| El Salvador |
106
|
| Syria |
103
|
| Iraq |
102
|
| Ghana |
96
|
| Kyrgyzstan |
86
|
| Cambodia |
72
|
| Albania |
71
|
| Serbia and Montenegro |
63
|
| Ethiopia |
63
|
| Uganda |
61
|
| Brunei |
57
|
| Honduras |
55
|
| Isle of Man |
55
|
| Yemen |
55
|
| Cuba |
54
|
| Sudan |
54
|
| Palestinian Territories |
52
|
| Barbados |
49
|
| Myanmar [Burma] |
48
|
| Paraguay |
45
|
| Liechtenstein |
43
|
| Montenegro |
43
|
| Rwanda |
42
|
| Libya |
41
|
| Namibia |
41
|
| Jersey |
40
|
| Maldives |
40
|
| Turks and Caicos Islands |
39
|
| Bermuda |
38
|
| Zimbabwe |
34
|
| Fiji |
32
|
| Nicaragua |
32
|
| Tanzania |
29
|
| Réunion |
27
|
| Gibraltar |
26
|
| New Caledonia |
26
|
| Bahamas |
25
|
| Monaco |
25
|
| Netherlands Antilles |
24
|
| Aruba |
24
|
| Botswana |
24
|
| Cayman Islands |
23
|
| Angola |
22
|
| Madagascar |
20
|
| Guam |
19
|
| Afghanistan |
17
|
| Côte d’Ivoire |
17
|
| Papua New Guinea |
17
|
| Dominica |
16
|
| Guernsey |
16
|
| Guyana |
16
|
| Suriname |
16
|
| Andorra |
14
|
| Belize |
14
|
| Congo [DRC] |
14
|
| Lesotho |
14
|
| Mozambique |
13
|
| Antigua and Barbuda |
12
|
| Laos |
12
|
| French Polynesia |
11
|
| Zambia |
11
|
| Saint Lucia |
10
|
| San Marino |
10
|
| Senegal |
10
|
| Saint Vincent and the Grenadines |
10
|
| Benin |
9
|
| Guinea |
9
|
| Guadeloupe |
9
|
| Malawi |
9
|
| Turkmenistan |
9
|
| U.S. Virgin Islands |
8
|
| Faroe Islands |
7
|
| Grenada |
7
|
| Haiti |
7
|
| British Virgin Islands |
7
|
| Cameroon |
6
|
| French Guiana |
6
|
| Greenland |
6
|
| Martinique |
6
|
| Seychelles |
6
|
| Timor-Leste |
6
|
| Mali |
5
|
| Tajikistan |
5
|
| Gabon |
4
|
| Anguilla |
3
|
| Å land Islands |
3
|
| Swaziland |
3
|
| Burundi |
2
|
| Congo [Republic] |
2
|
| Cape Verde |
2
|
| Djibouti |
2
|
| Saint Kitts and Nevis |
2
|
| Liberia |
2
|
| Somalia |
2
|
| Togo |
2
|
| Vanuatu |
2
|
| Burkina Faso |
1
|
| Bhutan |
1
|
| Falkland Islands [Islas Malvinas] |
1
|
| Gambia |
1
|
| Equatorial Guinea |
1
|
| Guinea-Bissau |
1
|
| Comoros |
1
|
| Mauritania |
1
|
| Palau |
1
|
| Sierra Leone |
1
|
| Vatican City |
1
|
| Samoa |
1
|
Then the first 100 network locations:
| Service Provider |
Visits
|
| microsoft corp |
33646
|
| comcast cable communications inc. |
18544
|
| road runner holdco llc |
16529
|
| internet service provider |
12815
|
| comite gestor da internet no brasil |
10995
|
| hewlett-packard company |
10961
|
| deutsche telekom ag |
9889
|
| japan network information center |
9746
|
| verizon internet services inc. |
7851
|
| network of citrix systems inc |
6945
|
| intel corporation |
6873
|
| symantec corporation |
6812
|
| chunghwa telecom data communication business group |
6381
|
| ip pools |
6314
|
| insignium llc |
6206
|
| reliance communications ltd |
5870
|
| charter communications |
5583
|
| uunet non-portable customer assignment |
4931
|
| verizon online llc |
4900
|
| comcast cable communications holdings inc |
4700
|
| at&t internet services |
4617
|
| eircom |
4567
|
| cox communications |
4540
|
| proxad / free sas |
4451
|
| korea telecom |
4397
|
| abts (karnataka) |
4251
|
| nib (national internet backbone) |
4243
|
| chinanet guangdong province network |
4189
|
| comcast cable communications |
3896
|
| unknown |
3279
|
| xo communications |
3274
|
| chinanet shanghai province network |
3248
|
| shaw communications inc. |
3179
|
| qwest communications company llc |
3156
|
| telstra internet |
3130
|
| tw telecom holdings inc. |
3091
|
| citrix systems inc. |
3029
|
| data general corporation |
2998
|
| cox communications inc. |
2946
|
| bellsouth.net inc. |
2925
|
| optimum online (cablevision systems) |
2853
|
| china unicom beijing province network |
2850
|
| chtd chunghwa telecom co. ltd. |
2791
|
| krnic |
2786
|
| ntt communications corporation |
2779
|
| psinet inc. |
2599
|
| emc corporation |
2499
|
| comcast cable communications ip services |
2435
|
| arcor ag |
2371
|
| cisco systems inc. |
2364
|
| (not set) |
2335
|
| broadband multiplay project o/o dgm bb noc bsnl bangalore |
2285
|
| research in motion limited |
2283
|
| samtel |
2257
|
| rcs & rds s.a. |
2246
|
| computer associates international |
2166
|
| honeywell international inc. |
2106
|
| telus communications inc. |
2103
|
| customers ie |
1954
|
| sympatico hse |
1929
|
| comcast business communications llc |
1853
|
| telefonica de espana sau |
1843
|
| iinet limited |
1840
|
| ziggo consumers |
1810
|
| easynet ltd |
1758
|
| comcast business communications inc. |
1738
|
| microsoft |
1717
|
| kaspersky lab internet |
1698
|
| appense |
1687
|
| chinanet jiangsu province network |
1665
|
| dell computer corporation |
1656
|
| eircom ltd |
1644
|
| taipei taiwan |
1612
|
| abts tamilnadu |
1594
|
| network of ign arch. and design gb |
1578
|
| starhub cable vision ltd |
1555
|
| wipro technologies |
1537
|
| level 3 communications inc. |
1522
|
| tpg internet pty ltd. |
1510
|
| siemens ag |
1483
|
| microsoft corporation |
1478
|
| global crossing |
1433
|
| singnet pte ltd |
1429
|
| dynamic pools |
1426
|
| this space is statically assigned. |
1425
|
| videsh sanchar nigam ltd - india. |
1414
|
| provider local registry |
1403
|
| abts delhi |
1385
|
| qwest communications corporation |
1356
|
| kla instruments corp. |
1316
|
| telia network services |
1311
|
| cncgroup beijing province network |
1278
|
| frontier communications of america inc. |
1264
|
| telecom italia s.p.a. tin easy lite |
1257
|
| videotron ltee |
1255
|
| oracle datenbanksysteme gmbh |
1234
|
| neostrada plus |
1228
|
| suddenlink communications |
1214
|
| dynamic ip pool for broadband customers |
1202
|
| eset s.r.o. |
1200
|
Then the first 100 search keywords and phrases that led to us:
| Keyword |
Visits
|
| (not provided) |
53903
|
| kifastsystemcallret |
10644
|
| crash dump analysis |
10348
|
| crash dump |
9863
|
| ntdll!kifastsystemcallret |
4305
|
| dump analysis |
4143
|
| adplus |
3332
|
| win32 error 0n2 |
2553
|
| windbg commands |
2198
|
| memory dump analysis |
2183
|
| windbg |
2131
|
| crash dumps |
1825
|
| dumpanalysis.org |
1818
|
| nt!_gshandlercheck_seh |
1734
|
| dmitry vostokov |
1718
|
| crashdump |
1683
|
| symbol file could not be found |
1669
|
| bugcheck 3b |
1458
|
| memory dump analysis anthology |
1393
|
| crash dump analyzer |
1360
|
| warning: frame ip not in any known module. following frames may be wrong. |
1347
|
| windbg cheat sheet |
1318
|
| windbg crash dump analysis |
1271
|
| minidump analysis |
1259
|
| adplus download |
1214
|
| core dump analysis |
1167
|
| fnodobfm |
1159
|
| dumpanalysis |
1142
|
| windows 7 crash dump |
1142
|
| windbg analyze |
1118
|
| kisystemservicecopyend |
1066
|
| frame ip not in any known module |
1010
|
| getcontextstate failed, 0×80070026 |
949
|
| crash dump windows 7 |
930
|
| the stored exception information can be accessed via .ecxr. |
925
|
| windbg script |
922
|
| error: symbol file could not be found |
912
|
| vista crash dump |
895
|
| windows crash dump analysis |
888
|
| system_thread_exception_not_handled |
857
|
| анализ дампа памяти |
857
|
| dump analyzer |
847
|
| дамп памяти |
821
|
| pool corruption |
820
|
| time travel debugging |
776
|
| system_service_exception |
772
|
| kernel_mode_exception_not_handled |
741
|
| ntdll kifastsystemcallret |
741
|
| the stored exception information can be accessed via .ecxr |
734
|
| kmode_exception_not_handled |
726
|
| trap frame |
719
|
| idna trace |
695
|
| windbg crash dump |
694
|
| kiuserexceptiondispatcher |
691
|
| minidump analyzer |
672
|
| bugcheck 7e |
670
|
| kernel32!pnlsuserinfo |
643
|
| windbg scripts |
641
|
| rtlpwaitoncriticalsection |
635
|
| minidump |
628
|
| bugcheck system_service_exception |
621
|
| exception_double_fault |
597
|
| warning: stack unwind information not available. following frames may be wrong. |
584
|
| application_fault_status_breakpoint |
583
|
| crash dump vista |
582
|
| memory dump analysis tool |
576
|
| getcontextstate failed, 0xd0000147 |
575
|
| memoretics |
544
|
| dumpanalysis.org/asmpedia |
537
|
| failure_bucket_id |
524
|
| “dec 15″ module windbg |
511
|
| error: symbol file could not be found. |
511
|
| download adplus |
507
|
| basethreadinitthunk |
505
|
| dr watson vista |
505
|
| ntkrnlmp.exe crash dump |
499
|
| ntdll.dll!kifastsystemcallret |
492
|
| rtlplowfragheapfree |
488
|
| analyze minidump |
477
|
| adplus tutorial |
473
|
| application_hang_blockedon_fileio |
468
|
| bios disassembly ninjutsu uncovered |
460
|
| ntdll.kifastsystemcallret |
460
|
| analyze crash dump |
459
|
| windows dump analysis |
459
|
| debug_flr_image_timestamp |
456
|
| system_thread_exception_not_handled (7e) |
456
|
| windbg dump analysis |
446
|
| windbg hang |
438
|
| windows debugging: practical foundations |
434
|
| crash dump analysis windbg |
432
|
| dynamicbase aslr |
422
|
| crash dump analysis tool |
419
|
| nt!kebugcheckex |
414
|
| rtluserthreadstart |
414
|
| type referenced: kernel32!pnlsuserinfo |
407
|
| error: symbol file could not be found. defaulted to export symbols for ntkrnlmp.exe |
405
|
| memory dump |
403
|
| warning: frame ip not in any known module. following frames may be wrong |
399
|
| application_hang_busyhang |
398
|
Then browser stats (we have never thought that there are so many of them):
| Browser |
Visits
|
| Internet Explorer |
446051
|
| Firefox |
356686
|
| Chrome |
184535
|
| Opera |
45787
|
| Safari |
24123
|
| Mozilla |
3780
|
| Mozilla Compatible Agent |
2401
|
| Android Browser |
1337
|
| Konqueror |
1057
|
| IE with Chrome Frame |
982
|
| Opera Mini |
705
|
| SeaMonkey |
503
|
| Safari (in-app) |
197
|
| Lunascape |
144
|
| BlackBerry8900 |
128
|
| Camino |
126
|
| RockMelt |
124
|
| (not set) |
96
|
| Netscape |
72
|
| Playstation 3 |
36
|
| IUC |
34
|
| Googlebot |
29
|
| Lynx |
24
|
| Unsupported Browser Version |
22
|
| BlackBerry9630 |
21
|
| NetFront |
17
|
| BlackBerry9700 |
15
|
| Microsoft-Symbol-Server |
14
|
| BlackBerry9000 |
12
|
| Galeon |
11
|
| Midori |
9
|
| NokiaE63 |
9
|
| Yahoo! Slurp |
9
|
| BlackBerry8530 |
8
|
| BlackBerry8520 |
7
|
| PagePeeker.com |
7
|
| SAMSUNG-SGH-I617 |
7
|
| BlackBerry9530 |
6
|
| JUC |
6
|
| MSR-ISRCCrawler |
6
|
| OpenWave |
6
|
| anonimo |
5
|
| BlackBerry9300 |
5
|
| HTC_HD2_T8585 Opera |
5
|
| Nokia5233 |
5
|
| Space Bison |
5
|
| -Vasya |
4
|
| Blazer |
4
|
| Uzbl |
4
|
-^_^- Hello  |
3
|
| <?echo ‘<pre>’; system |
3
|
| 12345 |
3
|
| BlackBerry9330 |
3
|
| BlackBerry9650 |
3
|
| HTC_P3700 Opera |
3
|
| HTC_TyTN_II Mozilla |
3
|
| NOKIAN78 |
3
|
| Playstation Portable |
3
|
| PPC; 240×320; HTC_P3450 |
3
|
| undefined GoogleToolbarBB |
3
|
| anonymous |
2
|
| Empty |
2
|
| GreatBrowse |
2
|
| Helyi user agent |
2
|
| HTC_Touch_Pro2_T7373 Opera |
2
|
| HTC_Touch2_T3333 Opera |
2
|
| J2ME |
2
|
| Mozilla 5.0 |
2
|
| NokiaC1-01 |
2
|
| NokiaC3-00 |
2
|
| NokiaC7-00 |
2
|
| NokiaX2-01 |
2
|
| nwzfq |
2
|
| test |
2
|
| — |
1
|
| ?M5 |
1
|
| “PagePeeker.com” |
1
|
| <?include |
1
|
| <script>alert |
1
|
| <SCRIPT>window.location=’http: |
1
|
| 2.0.0.11 |
1
|
| 31337′ |
1
|
| 8900b |
1
|
| AltaVista Intranet V2.0 evreka.com crawler@evreka.com |
1
|
| annoying |
1
|
| AppEngine-Google; |
1
|
| BlackBerry9500 |
1
|
| BlackBerry9550 |
1
|
| bwh3_user_agent |
1
|
| Citrix |
1
|
| EBABrowser |
1
|
| EY |
1
|
| fake_user_agent Mozilla |
1
|
| FAST Enterprise Crawler 6 used by Reed Exhibitions |
1
|
| foo |
1
|
| General Browser |
1
|
| GOOGLEBOT |
1
|
| HD_mini_T5555 Opera |
1
|
| Hellbrowser 6.66 |
1
|
| holy_teacher FirePHP |
1
|
| HTC_P3490 Opera |
1
|
| HTC_P4550 Mozilla |
1
|
| HTC_Polaris Mozilla |
1
|
| HTC_Touch_3G_T3232 Opera |
1
|
| HTC_Touch_HD_T8282 Opera |
1
|
| HTC_Touch_Pro_T7272 Opera |
1
|
| HTC_Touch2_T3320 Opera |
1
|
| HTC-8900 |
1
|
| IE 8 |
1
|
| IE6 |
1
|
| iTunes |
1
|
| Keep Out |
1
|
| KraftwayBrowser2 |
1
|
| Links |
1
|
| Maemo Browser |
1
|
| Medusa |
1
|
| MERONG |
1
|
| Motorola_ES405B |
1
|
| mozilla |
1
|
| Mozilla Firefox |
1
|
| MS-OC 4.0 |
1
|
| msie |
1
|
| NCSA Mosaic |
1
|
| NightDynamo AdminPanel v0.2.1 |
1
|
| Nokia2700c-2 |
1
|
| Nokia2730c-1 |
1
|
| Nokia305 |
1
|
| Nokia5230 |
1
|
| Nokia5310XpressMusic |
1
|
| Nokia5800 XpressMusic |
1
|
| Nokia6300 |
1
|
| Nokia6700c-1 |
1
|
| NokiaC2-01 |
1
|
| NokiaC2-02 |
1
|
| NokiaC2-03 |
1
|
| NokiaC5-03 |
1
|
| nokiac6-00 |
1
|
| NokiaC6-00 |
1
|
| NOKIAE65 |
1
|
| NokiaE66 |
1
|
| NokiaE71 |
1
|
| NokiaE71-2;Mozilla |
1
|
| NokiaE72-1 |
1
|
| NokiaN-GageQD |
1
|
| NokiaN70-1 |
1
|
| NokiaNokia 6210s |
1
|
| NoneOfYourBusiness |
1
|
| nothisname_wangxiaoyang3 |
1
|
| OmniWeb |
1
|
| Palm750 |
1
|
| Peeplo Screenshot Bot |
1
|
| PerTrUsTsQuiD |
1
|
| pippos.7 |
1
|
| PPC; 480×800; HTC_Touch_HD_T8282; OpVer 34.159.1.612 |
1
|
| PriceGoblin User Agent |
1
|
| Private |
1
|
| Privoxy |
1
|
| Read Later |
1
|
| SAMSUNG-GT-E2222 |
1
|
| samsung-gt-s3653 |
1
|
| samsung-gt-s3653 UNTRUSTED |
1
|
| SAMSUNG-S8000 |
1
|
| SAMSUNG-SGH-I637 |
1
|
| Samsung-SPHM540 Polaris |
1
|
| SmallProxy 3.5.4 |
1
|
| SonyEricssonK750 |
1
|
| Surf |
1
|
| tdhbrowser |
1
|
| TiFiC Client Z |
1
|
| union update table sd_users set userid=9 where username=’coco |
1
|
| unknown |
1
|
| Unknown |
1
|
| UNTRUSTED |
1
|
| Updownerbot |
1
|
| WIN |
1
|
| WinXP SP2 |
1
|
| Wlwap |
1
|
| WM5 PIE |
1
|
| Xda_orbit_2; 240×320 |
1
|
| Xyi znat kakoi browser MRA 5.7 |
1
|
| ZooShot 0.1a |
1
|
| ZooShot 0.42 |
1
|
and finally mobile devices stats (you may find your own device there):
| Mobile Device Info |
Visits
|
| Apple iPhone |
2292
|
| Apple iPad |
1940
|
| (not set) |
1099
|
| Samsung GT-I9100 Galaxy S II |
167
|
| Apple iPod Touch |
112
|
| Asus Eee Pad Transformer TF101 |
112
|
| SonyEricsson LT15i Xperia Arc |
94
|
| Motorola Xoom |
47
|
| Samsung Galaxy Nexus |
47
|
| Samsung GT-I9000 Galaxy S |
34
|
| Samsung GT-P7510 Galaxy Tab 10.1 |
30
|
| Google Nexus S Samsung Nexus S |
26
|
| HTC EVO 4G |
26
|
| Google Nexus 7 |
21
|
| RIM BlackBerry Bold Touch 9900 Dakota |
21
|
| Samsung GT-N7000 Galaxy Note |
21
|
| Acer A500 Picasso |
17
|
| Asus Eee Pad TF201 Transformer Prime |
17
|
| HTC Desire HD |
17
|
| Motorola DroidX |
17
|
| Motorola XT862 Droid 3 |
17
|
| Samsung GT-S5830 Galaxy Ace |
17
|
| Samsung SGH-I747 Galaxy SIII |
17
|
| Samsung SGH-i917 Omnia 7 |
17
|
| Verizon Droid2 |
17
|
| Google Nexus One |
13
|
| Google Nexus One HTC Nexus One |
13
|
| HTC ADR6300 Incredible |
13
|
| Motorola Droid 2 |
13
|
| Samsung GT-P7500 P4 |
13
|
| Samsung SHW-M250K GALAXY S II (KT) |
13
|
| Apple iPod |
9
|
| BlackBerry 9780 |
9
|
| BlackBerry 9800 Torch |
9
|
| Dell Venue Pro |
9
|
| HTC Desire |
9
|
| HTC G2 HTC Sappire |
9
|
| HTC HD7 |
9
|
| HTC T9292 HD7 |
9
|
| Motorola MB860 Atrix |
9
|
| Nokia E63 |
9
|
| RIM BlackBerry 8530 Curve |
9
|
| Samsung GT-I9001 |
9
|
| Samsung GT-I9300 Galaxy S3 |
9
|
| Samsung GT-N8000 Galaxy Note 10.1 |
9
|
| Samsung GT-P1000 Galaxy Tab |
9
|
| Sharp IS03 IS03 for KDDI |
9
|
| T-Mobile myTouch4G |
9
|
| Toshiba AT100 |
9
|
| ZTE N860 |
9
|
| Acer A101 Vangogh |
4
|
| Acer A200 Picasso_E |
4
|
| Acer Acer E310 Liquid Mini |
4
|
| Asus TF300T Transformer Pad TF300T |
4
|
| BlackBerry 8520 Curve |
4
|
| BlackBerry 9900 Dakota |
4
|
| DoCoMo L-05D Optimus it |
4
|
| DoCoMo P502i |
4
|
| Fujitsu F-12C F-12C for DoCoMo |
4
|
| Google Nexus S |
4
|
| Google Wireless Transcoder |
4
|
| HTC A8181 Desire |
4
|
| HTC ADR6350 Droid Incredible 2 |
4
|
| HTC ADR6400L Thunderbolt |
4
|
| HTC ADR6400L Thunderbolt 4G |
4
|
| HTC APC715CKT EVO Design 4G |
4
|
| HTC Bravo |
4
|
| HTC Desire X0H6T |
4
|
| HTC Glacier |
4
|
| HTC Incredible S Incredible S |
4
|
| HTC Inspire 4G |
4
|
| HTC ISW12HT EVO 3D ISW12HT for KDDI |
4
|
| HTC Mozart 7 Mozart |
4
|
| HTC PC36100 EVO 4G |
4
|
| HTC PJ83100 One X |
4
|
| HTC Radar 4G |
4
|
| HTC S510e Desire S |
4
|
| HTC T7380 TouchFLO |
4
|
| HTC X515 EVO 3D |
4
|
| Huawei M860 Ascend |
4
|
| Huawei u8800 Ideos X5 |
4
|
| kddi ISW11HT HTC EVO WiMAX ISW11HT for KDDI |
4
|
| LG C900 Quantum |
4
|
| LG E900 Optimus 7 |
4
|
| LG LS670 Optimus S |
4
|
| LG MS690 Optimus M |
4
|
| LG VM670 Optimus V |
4
|
| LG VS910 4G Revolution |
4
|
| Motorola A953 MILESTONE 2 |
4
|
| Motorola ISW11M PHOTON ISW11M for KDDI |
4
|
| Motorola MB501 |
4
|
| Motorola MB525 DEFY |
4
|
| Motorola MB611 |
4
|
| Motorola MOTXT912B Droid Razr 4G |
4
|
| Motorola MZ601 Xoom |
4
|
| Motorola MZ604 Xoom |
4
|
| Motorola MZ605 Xoom |
4
|
| Motorola xt875 Droid Bionic |
4
|
| Nokia 5800d XpressMusic |
4
|
| Nokia C3-00 |
4
|
| Nokia C5-03 C5 |
4
|
| Nokia C6-00 |
4
|
| Nokia Lumia 710 |
4
|
| Nokia Lumia 800 |
4
|
| RIM BlackBerry 9300 Curve 3G |
4
|
| RIM BlackBerry 9700 Bold |
4
|
| RIM BlackBerry 9800 Torch |
4
|
| RIM Blackberry Bold Touch 9930 |
4
|
| Samsung GT i5700 Galaxy Spica |
4
|
| Samsung GT I9000T Galaxy S |
4
|
| Samsung GT-I9100G Galaxy S II |
4
|
| Samsung GT-I9100P Galaxy S II NFC |
4
|
| Samsung GT-I9103 |
4
|
| Samsung GT-I9300 Galaxy SIII |
4
|
| Samsung GT-N8010 Galaxy Note 10.1 |
4
|
| Samsung GT-P7500 Galaxy Tab 10.1 |
4
|
| Samsung SCH-I500 Fascinate |
4
|
| Samsung SCH-I535 4G Galaxy SIII |
4
|
| Samsung SGH-i717 Galaxy Note |
4
|
| Samsung SGH-I747 Galaxy S3 |
4
|
| Samsung SGH-I777 |
4
|
| Samsung SGH-I777 Galaxy S II |
4
|
| Samsung SGH-I897 Galaxy S Captivate |
4
|
| Samsung SHW-M250S GALAXY S II (SKT) |
4
|
| Samsung SPH-D700 Epic 4G |
4
|
| Samsung SWH-M110S |
4
|
| Sharp 003SH Sharp Galapagos 003SH for SoftBank |
4
|
| Softbank 001DL DELL Streak |
4
|
| SonyEricsson LT26i Xperia Arc HD |
4
|
| Xiaomi MI-ONE Plus M1 Plus |
4
|
- Dmitry Vostokov @ DumpAnalysis.org + TraceAnalysis.org -
Posted in Announcements, Crash Dump Analysis, Debugging, DumpAnalysis.org Statistics, History, Malware Analysis, Software Diagnostics, Software Diagnostics Institute, Software Engineering, Software Technical Support, Software Trace Analysis, Victimware Analysis | No Comments »
Sunday, October 21st, 2012
Empty Trace is another trivial missing pattern that we need to add to make software log analysis pattern system complete. It ranges from a totally empty trace message list where only a meta-trace header (if any) describing overall trace structure is present to a few messages where we expect thousands. This is also an extreme case of Truncated Trace, No Activity and Missing Component patterns for a trace taken as a whole. Note, that an empty trace file doesn’t necessarily have a zero file size because a tracing architecture may preallocate some file space for block data writing.
- Dmitry Vostokov @ DumpAnalysis.org + TraceAnalysis.org -
Posted in CDF Analysis Tips and Tricks, Software Technical Support, Software Trace Analysis, Trace Analysis Patterns | No Comments »
Tuesday, October 2nd, 2012
These are important meta-patterns of monitoring and software problem analysis reports. It is often the case that we have software artifacts and some problem description and we need to provide recommendations on further troubleshooting. Most of the time such an analysis and associated response fit into abstract schemes where we can just substitute variables for concrete states, actions, artifacts and behavioral descriptions. Sometimes we also have difficulty to write such analysis reports so we hope report schemes is of help here to provide organizing templates for thought process. The first such scheme we call Missing Cause Trace:
- If Action then Behavior
- We have a trace of Behavior
- We need a trace of Action and Behavior
The difference with Truncated Trace pattern here is that in a truncated trace it was intended to trace certain behaviour but the tracing session was stopped prematurely or started too late. In a missing cause trace only a part of necessary activity was traced and the missing part wasn’t thought of or considered for tracing.
- Dmitry Vostokov @ DumpAnalysis.org + TraceAnalysis.org -
Posted in Debugging, Escalation Engineering, Software Diagnostics, Software Diagnostics Pattern Language, Software Diagnostics Patterns, Software Diagnostics Report Schemes, Software Technical Support, Software Trace Analysis, Trace Analysis Patterns | No Comments »
Friday, July 13th, 2012
For some time I was struggling with finding a good name for memory dump and software trace analysis activities. The name Memoretics I use for the science of memory dump analysis (that also incorporates software traces) seems not so good to describe the whole practical activity that should be transparent to everyone in IT. Fortunately, I timely understood that all these activities constitute the essence of software diagnostics that previously lacked any solid foundation. Thus, Software Diagnostics Institute was reborn from the previous Crash Dump Analysis Portal. This institute does pure and applied research and scientific activities and in recent years was funded mainly from OpenTask publisher and recently from Memory Dump Analysis Services. The latter company also recognized that the broadening of its commercial activities requires a new name. So, Software Diagnostics Services was reborn:
The First Comprehensive Software Diagnostics Service
- Dmitry Vostokov @ DumpAnalysis.org + TraceAnalysis.org -
Posted in Announcements, Cloud Memory Dump Analysis, Complete Memory Dump Analysis, Core Dump Analysis, Crash Analysis Report Environment (CARE), Crash Dump Analysis, Debugging, Debugging Bureau, Debugging Industry, Debugging Methodology, Debugging Today, Debugging Trends, Education, Education and Research, Escalation Engineering, Event Tracing for Windows (ETW), First Fault Software Diagnostics, Generative Debugging, JIT Crash Analysis, JIT Memory Space Analysis, Java Debugging, Kernel Development, Kernel Memory Dump Analysis, Linux Crash Corner, MFC Debugging, Mac Crash Corner, Mac OS X, Malware Analysis, Memoretics, Memory Analysis Forensics and Intelligence, Memory Analysis Report System, Memory Dump Analysis Methodology, Memory Dump Analysis Services, Minidump Analysis, New Debugging School, Pattern-Driven Debugging, Pattern-Driven Software Support, Performance Monitoring, Root Cause Analysis, SQL Debugging, Security, Software Debugging Services, Software Diagnostics, Software Diagnostics Institute, Software Diagnostics Services, Software Engineering, Software Problem Solving, Software Technical Support, Software Trace Analysis, Software Trace Analysis Report Environment (STARE), Tools, Training and Seminars, Troubleshooting Methodology, Unified Software Diagnostics, Windows 7, Windows 8, Windows Azure, Windows Mobile, Windows Server 2008, Windows System Administration, x64 Mac OS X, x64 Windows | No Comments »
Sunday, June 24th, 2012
This is a second Webinar from Memory Dump Analysis Services on software diagnostics. The first one is about pattern recognition. During this Webinar you will learn how to apply systems theory and systems thinking for effective and efficient abnormal software behavior diagnostics: the foundation of software troubleshooting and debugging. The seminar summarizes 6 years of research done by Software Diagnostics Institute started with a short blog post Dumps and Systems Theory.

Title: Introduction to Systemic Software Diagnostics: Systems Thinking in Memory Dump and Software Trace Analysis
Date: 3rd of September, 2012
Time: 17:00 (BST) 12:00 (EST) 09:00 (PST)
Duration: 60 minutes
Space is limited.
Reserve your Webinar seat now at:
https://www3.gotomeeting.com/register/377382766
- Dmitry Vostokov @ DumpAnalysis.org + TraceAnalysis.org -
Posted in Announcements, Memory Dump Analysis Services, Software Diagnostics, Software Diagnostics Institute, Software Diagnostics Patterns, Software Engineering, Software Technical Support, Systems Thinking, Training and Seminars, Unified Software Diagnostics, Webinars | No Comments »
Monday, June 18th, 2012
Posted in Announcements, Certification, Core Dump Analysis, Crash Dump Analysis, Crash Dump Patterns, Debugging, Software Diagnostics, Software Diagnostics Institute, Software Diagnostics Patterns, Software Engineering, Software Technical Support, Software Trace Analysis, Trace Analysis Patterns | No Comments »
Saturday, June 9th, 2012
While preparing a seminar on Software Diagnostics I made a lot of notes and realized that a system of patterns, corresponding vocabulary and pattern language are needed for this discipline. Here patterns are supposed to be broad in nature and be different from patterns for specific artifacts such as memory dumps and software traces. So the first pattern addresses a diagnostic encounter with a First Fault in comparison to subsequent faults where the problem becomes noticeable and diagnostic resources are allocated. Such faults should not be dismissed. Dan Skwire is a passionate advocate of first fault software problem solving and wrote a book:
First Fault Software Problem Solving: A Guide for Engineers, Managers and Users
The following paper proposes distributed control flow reconstruction for first fault diagnosis:
TraceBack: First Fault Diagnosis by Reconstruction of Distributed Control Flow
Memory Dump Analysis Services uses patterns of abnormal software behavior for its first fault diagnostics that doesn’t require any special instrumentation:
Join Debugging Diagnostics Revolution!
- Dmitry Vostokov @ DumpAnalysis.org + TraceAnalysis.org -
Posted in First Fault Problem Solving, Software Behavior Patterns, Software Diagnostics, Software Diagnostics Patterns, Software Technical Support, Unified Software Diagnostics | No Comments »
Tuesday, June 5th, 2012
-
Motivated by 7 Habits of Highly Effective Debuggers I would like to reflect on a distinction between diagnostics and problem solving as separate processes (although highly related). First, we reverse the precept from that article because stories such as software logs and traces are of primary importance to software diagnostics (and not only). And without diagnostics there is no effective debugging (treatment, problem solving, etc.)
The Principle Precept of Diagnostics
Stories NOT Statistics secure certainty.
Next parts will be about actual habits so please stay tuned. I would try to finish this list before the forthcoming Webinar on software diagnostics.
- Dmitry Vostokov @ DumpAnalysis.org + TraceAnalysis.org -
Posted in 7 Habits, Core Dump Analysis, Crash Dump Analysis, Escalation Engineering, Software Diagnostics, Software Engineering, Software Narratology, Software Problem Solving, Software Technical Support, Software Trace Analysis | No Comments »
Sunday, April 15th, 2012
After 4 years in print this bestselling title needs an update to address minor changes, include extra examples and reference additional research published in Volumes 2, 3, 4, 5 and 6.
- Title: Memory Dump Analysis Anthology, Volume 1
- Author: Dmitry Vostokov
- Publisher: OpenTask (Summer 2012)
- Language: English
- Product Dimensions: 22.86 x 15.24
- Paperback: 800 pages
- ISBN-13: 978-1-908043-35-1
- Hardcover: 800 pages
- ISBN-13: 978-1-908043-36-8
The cover for both paperback and hardcover titles will also have a matte finish. We used A Memory Window artwork for the back cover.

- Dmitry Vostokov @ DumpAnalysis.org + TraceAnalysis.org -
Posted in Aesthetics of Memory Dumps, Announcements, AntiPatterns, Art, Assembly Language, Best Practices, Books, Bugchecks Depicted, C and C++, Complete Memory Dump Analysis, Computer Science, Crash Dump Analysis, Crash Dump Patterns, Crash Dumps for Dummies, Debugging, Debugging Methodology, Dr. Watson, Escalation Engineering, Fun with Crash Dumps, GDB for WinDbg Users, Hardware, Images of Computer Memory, Kernel Development, Mathematics of Debugging, Memiotics (Memory Semiotics), Memoretics, Memory Dump Analysis Methodology, Memory Space Art, Memory Space Music, Memory Visualization, Minidump Analysis, Multithreading, Pattern-Driven Debugging, Pattern-Driven Software Support, Publishing, Reference, Root Cause Analysis, Science of Memory Dump Analysis, Software Architecture, Software Behavior DNA, Software Behavior Patterns, Software Behavioral Genome, Software Diagnostics, Software Engineering, Software Technical Support, Stack Trace Collection, Testing, Tools, Troubleshooting Methodology, Vista, WinDbg Scripts, WinDbg Tips and Tricks, WinDbg for GDB Users, Windows 7, Windows Data Structures, Windows Server 2008, Windows System Administration, x64 Windows | No Comments »
Sunday, April 15th, 2012
In a week this short full color book should appear in online bookstores:
- Title: Software Narratology: An Introduction to the Applied Science of Software Stories
- Authors: Dmitry Vostokov, Memory Dump Analysis Services
- Description: This is a transcript of Memory Dump Analysis Services Webinar about Software Narratology: an exciting new discipline and a field of research founded by DumpAnalysis.org. When software executes it gives us its stories in the form of UI events, software traces and logs. Such stories can be analyzed for their structure and patterns for troubleshooting, debugging and problem resolution purposes. Topics also include software narremes and their types, anticipatory software construction and software diagnostics.
- Publisher: OpenTask (April 2012)
- Language: English
- Product Dimensions: 28.0 x 21.6
- Paperback: 26 pages
- ISBN-13: 978-1908043078

- Dmitry Vostokov @ DumpAnalysis.org + TraceAnalysis.org -
Posted in Announcements, Books, CDF Analysis Tips and Tricks, Code Reading, Computer Science, Debugging, Debugging Methodology, Debugging Trends, Education and Research, Escalation Engineering, Event Tracing for Windows (ETW), Hermeneutics of Memory Dumps and Traces, Ideas, Narralog Programming Language, New Debugging School, Pattern-Driven Debugging, Pattern-Driven Software Support, Presentations, Publishing, Root Cause Analysis, SPDL, Science of Software Tracing, Software Behavior DNA, Software Behavior Patterns, Software Behavioral Genome, Software Diagnostics, Software Engineering, Software Narrative Fiction, Software Narrative Science, Software Narratology, Software Narremes, Software Problem Description Patterns, Software Problem Solving, Software Technical Support, Software Trace Analysis, Software Trace Analysis and History, Software Trace Deconstruction, Software Trace Linguistics, Software Trace Modeling, Software Trace Reading, Software Trace Visualization, Software Tracing Implementation Patterns, Software Troubleshooting Patterns, Structural Trace Patterns, Systems Thinking, Testing, Tools, Trace Analysis Patterns, Training and Seminars, Troubleshooting Methodology, UI Problem Analysis Patterns, Unified Debugging Patterns, Unified Software Diagnostics, Webinars | No Comments »
Monday, April 9th, 2012
Memory Dump Analysis Services organizes a free Webinar on Unified Software Diagnostics (USD) and the new scalable cost-effective software support model called Pattern-Driven Software Support devised to address various shortcomings in existing tiered software support organizations. Examples cover Windows, Mac OS and Linux.

Date: 22nd of June, 2012
Time: 17:00 (BST) 12:00 (EST) 09:00 (PST)
Duration: 60 minutes
Space is limited.
Reserve your Webinar seat now at:
https://www3.gotomeeting.com/register/172771078
- Dmitry Vostokov @ DumpAnalysis.org + TraceAnalysis.org -
Posted in Announcements, Best Practices, Crash Dump Analysis, Crash Dump Patterns, Debugging, Debugging Methodology, Debugging Trends, Economics, Escalation Engineering, Event Tracing for Windows (ETW), JIT Crash Analysis, JIT Memory Space Analysis, Malware Analysis, Malware Patterns, Memoretics, Memory Analysis Forensics and Intelligence, Memory Dump Analysis Methodology, Memory Dump Analysis Services, New Acronyms, New Debugging School, Pattern Prediction, Pattern-Driven Debugging, Pattern-Driven Software Support, Root Cause Analysis, Science of Memory Dump Analysis, Science of Software Tracing, Software Behavior DNA, Software Behavior Patterns, Software Behavioral Genome, Software Diagnostics, Software Engineering, Software Narratology, Software Problem Description Patterns, Software Problem Solving, Software Support Patterns, Software Technical Support, Software Trace Analysis, Software Troubleshooting Patterns, Software Victimology, Software and Economics, Structural Memory Patterns, Structural Trace Patterns, Systems Thinking, Testing, Tools, Trace Analysis Patterns, Training and Seminars, Troubleshooting Methodology, UI Problem Analysis Patterns, Unified Debugging Patterns, Unified Software Diagnostics, Victimware, Webinars, Workaround Patterns | No Comments »
Sunday, April 1st, 2012
Software trace analysis is notoriously difficult so a bit of folk music is needed to make debugging sessions less boring. The following album came to my attention in a local library and after listening to it I recommend it for software log analysis sessions:
Make It Through This World

Here’s my own track title interpretation:
1. Dream Away The Defects
2. This I’d Analyze
3. A Magnifier
4. Make It Through This Trace
5. Don’t Let It Go Unanalyzed
6. Request-Reply Pair
7. I Love It When It’s Short
8. No Higher Specs
9. Said, Said.
10. When I Think Of You, My Customers
11. Close to The Defect
12. A Debugger For You Now
- Dmitry Vostokov @ DumpAnalysis.org + TraceAnalysis.org -
Posted in CDF Analysis Tips and Tricks, Escalation Engineering, Fun with Debugging, Fun with Software Traces, Music for Debugging, Software Engineering, Software Technical Support, Software Trace Analysis | No Comments »
Tuesday, March 20th, 2012
The previous definition of software narratology was restricted to software traces and logs (the top left quadrant on a software narrative square, also the part of Memoretics which studies memory snapshots). Now, with the broadening of the domain of software narratology to the whole world of software narrative stories including actor interactions with software in construction requirements use cases and post-construction incidents we give another definition:
Software narrative is a representation of software events and changes of state. Software Narratology is a discipline that studies such software narratives (software narrative science).
- Dmitry Vostokov @ DumpAnalysis.org + TraceAnalysis.org -
Posted in Announcements, Cloud Computing, Code Reading, Computer Forensics, Computer Science, Crash Dump Analysis, Crash Dump Patterns, Debugging, Memoretics, Science of Memory Dump Analysis, Science of Software Tracing, Software Behavior DNA, Software Behavior Patterns, Software Behavioral Genome, Software Engineering, Software Narrative Science, Software Narratology, Software Narremes, Software Problem Description Patterns, Software Problem Solving, Software Technical Support, Software Trace Analysis, Software Trace Deconstruction, Software Trace Modeling, Software Trace Reading, Structural Trace Patterns, Testing, Trace Analysis Patterns | No Comments »
Sunday, March 11th, 2012
The development of SPDL requires extending pattern-driven analysis approach to software problems such as software defect and software incident descriptions. Such a pattern language should help with accurate problem identification and problem resolution through software behaviour analysis and with choosing, for example, appropriate workaround patterns or, for a debugging strategy, unified debugging patterns. This can also be applicable to software security incident descriptions as well.
For this first part, we introduce a pattern called, Problem Summary. This is a very short description that summarizes the essence of the problem from a submitter point of view such as a software user or a technical support engineer. Whether it is correct or incorrect is another problem itself but the missing summary usually requires close reading of the whole problem description text and analyze together various relevant parts to reconstruct the summary.
- Dmitry Vostokov @ DumpAnalysis.org + TraceAnalysis.org -
Posted in Debugging, Escalation Engineering, SPDL, Security, Software Engineering, Software Problem Description Patterns, Software Problem Solving, Software Support Patterns, Software Technical Support, Victimware | No Comments »
Saturday, March 3rd, 2012

Memory Dump Analysis Services organizes a new training course:
Description: Learn how to analyze app crashes and freezes, navigate through process core memory dump space and diagnose corruption, memory leaks, CPU spikes, blocked threads, deadlocks, wait chains, and much more. We use a unique and innovative pattern-driven analysis approach to speed up the learning curve. The training consists of practical step-by-step exercises using Xcode and GDB environments highlighting various patterns diagnosed in 64-bit process core memory dumps. The training also includes an overview of relevant similarities and differences between Windows and Mac OS X user space memory dump analysis useful for engineers with Wintel background.
If you are registered you are allowed to optionally submit your app core dumps before the training. This will allow us in addition to the carefully constructed problems tailor additional examples to the needs of the attendees.
The training consists of 2 two-hour sessions. When you finish the training you additionally get:
- A full transcript in PDF format (retail price $200)
- 6 volumes of Memory Dump Analysis Anthology in PDF format (retail price $120)
- A personalized attendance certificate with unique CID (PDF format)
- Mac OS X Debugging: Practical Foundations in PDF format (retail price $15)
- Free Dump Analysis World Network membership including updates to full PDF transcript Q&A section
Prerequisites: Basic Mac OS X troubleshooting and debugging
Audience: Software technical support and escalation engineers, system administrators, software developers and quality assurance engineers.
Session 1: October 19, 2012 4:00 PM - 6:00 PM BST
Session 2: October 22, 2012 4:00 PM - 6:00 PM BST
Price: 210 USD
Space is limited.
Reserve your remote training seat now at:
https://student.gototraining.com/r/3803636572165653760
If you are mainly interested in Windows memory dump analysis there is another course available:
Accelerated Windows Memory Dump Analysis
- Dmitry Vostokov @ DumpAnalysis.org + TraceAnalysis.org -
Posted in Announcements, Assembly Language, Crash Dump Analysis, Crash Dump Patterns, Debugging, Escalation Engineering, Mac Crash Corner, Mac OS X, Memory Dump Analysis Services, Software Engineering, Software Technical Support, Testing, Training and Seminars | No Comments »
Sunday, February 19th, 2012
Memory Dump Analysis Services (DumpAnalysis.com) organizes a free Webinar about software narratology: an application of ideas from narratology to software narrative stories.

Learn about this exciting new discipline and a field of research. When software executes it gives us its stories in the form of UI events, software traces and logs. Such stories can be analyzed for their structure and patterns for troubleshooting, debugging and problem resolution purposes.
Prerequisites: basic software troubleshooting and ability to read software generated logs.
Audience: anyone can benefit from this new perspective: from software users to software engineers and managers.
Space is limited.
Reserve your Webinar seat now at:
https://www3.gotomeeting.com/register/603136294
- Dmitry Vostokov @ DumpAnalysis.org + TraceAnalysis.org -
Posted in Announcements, Computer Science, Debugging, Escalation Engineering, Intelligence Analysis Patterns, Memory Dump Analysis Services, SPDL, Science of Software Tracing, Security, Software Behavior DNA, Software Behavior Patterns, Software Behavioral Genome, Software Engineering, Software Narrative Fiction, Software Narratology, Software Problem Description Patterns, Software Problem Solving, Software Technical Support, Software Trace Analysis, Software Trace Deconstruction, Software Trace Linguistics, Software Trace Modeling, Software Trace Reading, Software Trace Visualization, Software Tracing Implementation Patterns, Software Tracing for Dummies, Software Troubleshooting Patterns, Software Victimology, Structural Trace Patterns, Testing, Tools, Trace Analysis Patterns, Troubleshooting Methodology, UI Problem Analysis Patterns, Unified Debugging Patterns, Unit Testing, Victimware, Webinars, Windows System Administration | No Comments »
Friday, January 27th, 2012
Advanced training sessions time may not suitable due to different geographic time zones. So I have decided to publish this training in a book format (currently in PDF) and make it available in paperback on Amazon and B&N later. Book details:
- Title: Advanced Windows Memory Dump Analysis with Data Structures: Training Course Transcript and WinDbg Practice Exercises with Notes
- Description: The full transcript of Memory Dump Analysis Services Training with 10 step-by-step exercises, notes, and selected Q&A.
- Authors: Dmitry Vostokov, Memory Dump Analysis Services
- Publisher: OpenTask (January 2012)
- Language: English
- Product Dimensions: 28.0 x 21.6
- Paperback: 180 pages
- ISBN-13: 978-1908043344
Table of Contents
Now available for sale in PDF format from Memory Dump Analysis Services.
- Dmitry Vostokov @ DumpAnalysis.org + TraceAnalysis.org -
Posted in Announcements, Books, Complete Memory Dump Analysis, Crash Dump Analysis, Crash Dump Patterns, Debugging, Escalation Engineering, Kernel Development, Memory Dump Analysis Services, Publishing, Software Technical Support, Training and Seminars, Uses of UML, WinDbg Scripts, WinDbg Tips and Tricks, x64 Windows | No Comments »
