Archive for the ‘New Acronyms’ Category
Thursday, October 11th, 2012
Influenced by stages of Husserlian phenomenological investigation I propose the following stages for the investigation of phenomena as it appears in software execution artifacts such as memory dumps, traces and logs:
1. Bracketing the outside source code as reduction to patterns of phenomena independent from causal software engineering explanations.
2. Constructing the computational world for the given incident (the so called horizon of computation).
3. Comparing with “computed-in” experience of past computational worlds from which all universal patterns of computational structural and behavioral phenomena emerged.
PS. According to the above software diagnostics is a phenomenological science of patterns. Most probably this sketch will be revised soon. In the mean time here’s a funny coincidence. The first step in a phenomenological method is the so called epoché. I provide my own interpretation of this - “exception processing of crash” hypothetical episteme. Similar to EPOCH metaphysical grand conjecture that our World is just one enormous exception processing handler after Big Bang.
- Dmitry Vostokov @ DumpAnalysis.org + TraceAnalysis.org -
Posted in Announcements, Fun with Crash Dumps, Fun with Software Traces, New Acronyms, Phenomenology of Software Diagnostics, Philosophy, Philosophy of Software Diagnostics, Software Diagnostics | No Comments »
Monday, June 25th, 2012
STaMPs - Software Trace and Memory Patterns. Stack Trace and Memory Patterns.
Examples: Got a few visible stamps on this trace. And more stamps on that crash dump.
- Dmitry Vostokov @ DumpAnalysis.org + TraceAnalysis.org -
Posted in Debugging Slang, Fun with Crash Dumps, Fun with Debugging, Fun with Software Traces, New Acronyms | No Comments »
Monday, April 9th, 2012
Memory Dump Analysis Services organizes a free Webinar on Unified Software Diagnostics (USD) and the new scalable cost-effective software support model called Pattern-Driven Software Support devised to address various shortcomings in existing tiered software support organizations. Examples cover Windows, Mac OS and Linux.

Date: 22nd of June, 2012
Time: 17:00 (BST) 12:00 (EST) 09:00 (PST)
Duration: 60 minutes
Space is limited.
Reserve your Webinar seat now at:
https://www3.gotomeeting.com/register/172771078
- Dmitry Vostokov @ DumpAnalysis.org + TraceAnalysis.org -
Posted in Announcements, Best Practices, Crash Dump Analysis, Crash Dump Patterns, Debugging, Debugging Methodology, Debugging Trends, Economics, Escalation Engineering, Event Tracing for Windows (ETW), JIT Crash Analysis, JIT Memory Space Analysis, Malware Analysis, Malware Patterns, Memoretics, Memory Analysis Forensics and Intelligence, Memory Dump Analysis Methodology, Memory Dump Analysis Services, New Acronyms, New Debugging School, Pattern Prediction, Pattern-Driven Debugging, Pattern-Driven Software Support, Root Cause Analysis, Science of Memory Dump Analysis, Science of Software Tracing, Software Behavior DNA, Software Behavior Patterns, Software Behavioral Genome, Software Diagnostics, Software Engineering, Software Narratology, Software Problem Description Patterns, Software Problem Solving, Software Support Patterns, Software Technical Support, Software Trace Analysis, Software Troubleshooting Patterns, Software Victimology, Software and Economics, Structural Memory Patterns, Structural Trace Patterns, Systems Thinking, Testing, Tools, Trace Analysis Patterns, Training and Seminars, Troubleshooting Methodology, UI Problem Analysis Patterns, Unified Debugging Patterns, Unified Software Diagnostics, Victimware, Webinars, Workaround Patterns | No Comments »
Friday, November 11th, 2011
One of the new initiatives for 2012 is the development of SPDL (Software Problem Description Language). Its purpose is automatic generation of a software troubleshooting tool(s) based on the description of a problem. Here software problem means a post-construction problem as outlined in Introduction to Pattern-Driven Software Problem Solving. The tool construction will utilize an expanded set of DebugWare and Workaround patterns together with the refind version of RADII software development process. This will also provide necessary effectiveness, efficiency and enhanced problem solving capabilities to existing TaaS (Tools as a Service) implementations that are limited in the number of tools they offer.
- Dmitry Vostokov @ DumpAnalysis.org + TraceAnalysis.org -
Posted in Announcements, Computer Science, Crash Dump Analysis, DebugWare Patterns, Debugging, Generative Debugging, New Acronyms, New Debugging School, SPDL, Software Behavior DNA, Software Behavior Patterns, Software Behavioral Genome, Software Engineering, Software Problem Solving, Software Technical Support, Software Trace Analysis, Software Troubleshooting Patterns, Software and Modeling, TaaS, Testing, Tool Objects, Tools, Troubleshooting Methodology, Unified Debugging Patterns, Windows System Administration | No Comments »
Thursday, August 25th, 2011
Abscess - A Bad Service and Customer Experience Short Story. Can also be an abbreviation for a bad support …
Examples: After combating an abscess a customer decided to take a social media approach. An abscess process.
- Dmitry Vostokov @ DumpAnalysis.org + TraceAnalysis.org -
Posted in Customer Service Patterns, Debugging Slang, Escalation Engineering, New Acronyms, Software Support Patterns, Software Technical Support | No Comments »
Friday, May 27th, 2011
Tapping - The act of collecting software traces for subsequent pattern-driven trace analysis. From TAP (Trace Analysis Pattern).
Examples: We started tapping the service for any anomalies. Software tapping methods and tools.
- Dmitry Vostokov @ DumpAnalysis.org + TraceAnalysis.org -
Posted in Debugging, Debugging Slang, Memory Analysis Forensics and Intelligence, Memory Intelligence Agency, New Acronyms, Software Trace Analysis | No Comments »
Saturday, May 21st, 2011
Posted in Announcements, Debugging, EasyDbg, Memory Analysis Forensics and Intelligence, New Acronyms, Software Trace Analysis, Software Trace Reading, Tool Objects, Tools, Trace Analysis Patterns | No Comments »
Sunday, May 1st, 2011
To model software behavior at application and system levels, test generative debugging scenarious and construct software defects using metaprogramming I started working on MdTL (Metadefect Template Library). Its consists of C++ templates for structural and behavioral patterns. The simplest examples include Threads<Spike> and Spike<Thread>. The template classes can be more complex, of course, utilizing the full power of C++, STL, and existing libraries like Boost. The unique and novel feature of this library is the inclusion of dual classes of behaviour such as Leak<>, Deadlock<>, Overflow<>, Residue<>, Exception<>, Contention<>, etc. parameterized by various structural memory classes like Process<>, Thread<>, Heap<>, Stack<>, Region<>, Buffer<>, etc. MdTL also includes classes to model software tracing and this will be used for simultaneous software trace and memory dump analysis case study in the forthcoming presentation. I also plan to extend this metaprogramming approach in the future to model malware analysis patterns by introducing Metamalware Template Library (MmTL).
Forthcoming parts will introduce template classes and examples.
- Dmitry Vostokov @ DumpAnalysis.org + TraceAnalysis.org -
Posted in C and C++, Crash Dump Patterns, Debugging, Generative Debugging, Malware Analysis, Malware Patterns, Metadefect Template Library, Metamalware, New Acronyms, Software Behavior Patterns, Software Defect Construction, Structural Memory Patterns, Structural Trace Patterns, Tools, Trace Analysis Patterns, Victimware | No Comments »
Friday, April 22nd, 2011
Very simple methodology summarized in just 3 words applicable to any problem solving domain and its activities including software troubleshooting and debugging:
Artifacts. Checklists. Patterns.
As an example of checklists and patterns please see these 3 presentations related to memory dump and software trace artifacts:
Introduction to Pattern-Driven Software Problem Solving
Fundamentals of Complete Crash and Hang Memory Dump Analysis
Pattern-Driven Memory Dump Analysis
I’m now working on a detailed presentation of this methodology.
- Dmitry Vostokov @ DumpAnalysis.org + TraceAnalysis.org -
Posted in Announcements, Debugging, Debugging Methodology, Escalation Engineering, New Acronyms, Root Cause Analysis, Software Technical Support, Troubleshooting Methodology | No Comments »
Sunday, April 17th, 2011
I’m pleased to announce that MDAA, Volume 5 is available in PDF format:
www.dumpanalysis.org/Memory+Dump+Analysis+Anthology+Volume+5
It features:
- 25 new crash dump analysis patterns
- 11 new pattern interaction case studies (including software tracing)
- 16 new trace analysis patterns
- 7 structural memory patterns
- 4 modeling case studies for memory dump analysis patterns
- Discussion of 3 common analysis mistakes
- Malware analysis case study
- Computer independent architecture of crash analysis report service
- Expanded coverage of software narratology
- Metaphysical and theological implications of memory dump worldview
- More pictures of memory space and physicalist art
- Classification of memory visualization tools
- Memory visualization case studies
- Close reading of the stories of Sherlock Holmes: Dr. Watson’s observational patterns
- Fully cross-referenced with Volume 1, Volume 2, Volume 3, and Volume 4
Its table of contents is available here:
www.dumpanalysis.org/MDAA/MDA-Anthology-V5-TOC.pdf
Paperback and hardcover versions should be available in a week or two. I also started working on Volume 6 that should be available in November-December.
- Dmitry Vostokov @ DumpAnalysis.org + TraceAnalysis.org -
Posted in Aesthetics of Memory Dumps, Analysis Notation, Announcements, AntiPatterns, Archaeology of Computer Memory, Art, Assembly Language, Best Practices, Books, C and C++, CDF Analysis Tips and Tricks, Categorical Debugging, Citrix, Common Mistakes, Common Questions, Complete Memory Dump Analysis, Computer Forensics, Computer Science, Crash Analysis Report Environment (CARE), Crash Dump Analysis, Crash Dump De-analysis, Crash Dump Patterns, Crash Dumps for Dummies, Cyber Warfare, Debugging, Debugging Bureau, Debugging Industry, Debugging Methodology, Debugging Slang, Debugging Trends, Deep Down C++, Dr. Watson, Dublin School of Security, Education and Research, Escalation Engineering, Fun with Crash Dumps, Fun with Debugging, Fun with Software Traces, General Memory Analysis, Hermeneutics of Memory Dumps and Traces, Images of Computer Memory, Kernel Development, Malware Analysis, Mathematics of Debugging, Memiotics (Memory Semiotics), Memory Analysis Forensics and Intelligence, Memory Diagrams, Memory Dump Analysis Services, Memory Dumps in Myths, Memory Space Art, Memory Systems Language, Memory Visualization, Memory and Glitches, Metaphysics of Memory Worldview, Multithreading, Music for Debugging, New Acronyms, New Debugging School, New Words, Pattern Models, Philosophy, Physicalist Art, Publishing, Reverse Engineering, Science of Memory Dump Analysis, Science of Software Tracing, Security, Software Architecture, Software Behavior Patterns, Software Chorography, Software Chorology, Software Defect Construction, Software Engineering, Software Generalist, Software Maintenance Institute, Software Narratology, Software Technical Support, Software Trace Analysis, Software Trace Reading, Software Trace Visualization, Software Tracing for Dummies, Software Troubleshooting Patterns, Software Victimology, Structural Memory Patterns, Structural Trace Patterns, Systems Thinking, Testing, The Way of Philip Marlowe, Tools, Trace Analysis Patterns, Training and Seminars, Troubleshooting Methodology, Victimware, Vista, Webinars, WinDbg Scripting Extensions, WinDbg Scripts, WinDbg Tips and Tricks, WinDbg for GDB Users, Windows 7, Windows Server 2008, Windows System Administration, Workaround Patterns, x64 Windows | No Comments »
Friday, December 31st, 2010
Similar to Google GMMXIe depiction and interpretation I propose another one related to memory centuries that start from 1000 CE (M…):
MMXI
Malware Memory eXception and Injection
or
Monitoring Memory, eXceptions, and Injections
- Dmitry Vostokov @ DumpAnalysis.org + TraceAnalysis.org -
Posted in Fun with Malware, Memory Analysis Forensics and Intelligence, New Acronyms | No Comments »
Friday, November 12th, 2010
Five volumes of cross-disciplinary Anthology (dubbed by the author “The Summa Memorianica”) lay the foundation of the scientific discipline of Memoretics (study of computer memory snapshots and their evolution in time) that is also called Memory Dump and Software Trace Analysis.ca
The 5th volume contains revised, edited, cross-referenced, and thematically organized selected DumpAnalysis.org blog posts about crash dump, software trace analysis and debugging written in February 2010 - October 2010 for software engineers developing and maintaining products on Windows platforms, quality assurance engineers testing software on Windows platforms, technical support and escalation engineers dealing with complex software issues, and security researchers, malware analysts and reverse engineers. The fifth volume features:
- 25 new crash dump analysis patterns
- 11 new pattern interaction case studies (including software tracing)
- 16 new trace analysis patterns
- 7 structural memory patterns
- 4 modeling case studies for memory dump analysis patterns
- Discussion of 3 common analysis mistakes
- Malware analysis case study
- Computer independent architecture of crash analysis report service
- Expanded coverage of software narratology
- Metaphysical and theological implications of memory dump worldview
- More pictures of memory space and physicalist art
- Classification of memory visualization tools
- Memory visualization case studies
- Close reading of the stories of Sherlock Holmes: Dr. Watson’s observational patterns
- Fully cross-referenced with Volume 1, Volume 2, Volume 3, and Volume 4
Product information:
- Title: Memory Dump Analysis Anthology, Volume 5
- Author: Dmitry Vostokov
- Language: English
- Product Dimensions: 22.86 x 15.24
- Paperback: 400 pages
- Publisher: Opentask (10 December 2010)
- ISBN-13: 978-1-906717-96-4
- Hardcover: 400 pages
- Publisher: Opentask (10 December 2010)
- ISBN-13: 978-1-906717-97-1

Back cover features memory space art image Hot Computation: Memory on Fire.
- Dmitry Vostokov @ DumpAnalysis.org + TraceAnalysis.org -
Posted in Aesthetics of Memory Dumps, Announcements, Archaeology of Computer Memory, Art, Assembly Language, Books, C and C++, CDF Analysis Tips and Tricks, Categorical Debugging, Common Mistakes, Complete Memory Dump Analysis, Computer Science, Crash Analysis Report Environment (CARE), Crash Dump Analysis, Crash Dump De-analysis, Crash Dump Patterns, Debugging, Debugging Methodology, Debugging Slang, Deep Down C++, Dr. Watson, Dublin School of Security, Education and Research, Escalation Engineering, Fun with Crash Dumps, Fun with Debugging, Fun with Software Traces, General Memory Analysis, Hermeneutics of Memory Dumps and Traces, Images of Computer Memory, Kernel Development, Malware Analysis, Malware Patterns, Mathematics of Debugging, Memiotics (Memory Semiotics), Memoidealism, Memoretics, Memory Analysis Culture, Memory Analysis Forensics and Intelligence, Memory Analysis Report System, Memory Diagrams, Memory Dreams, Memory Dump Analysis Jobs, Memory Dump Analysis Services, Memory Dump Analysis and History, Memory Dumps in Movies, Memory Dumps in Myths, Memory Religion (Memorianity), Memory Space Art, Memory Systems Language, Memory Visualization, Memory and Glitches, Memuonics, Metaphysical Society of Ireland, Minidump Analysis, Movies and Debugging, Multithreading, Museum of Debugging, Music for Debugging, Music of Computation, New Acronyms, New Words, Paleo-debugging, Pattern Models, Pattern Prediction, Philosophy, Physicalist Art, Psychoanalysis of Software Maintenance and Support, Publishing, Science of Memory Dump Analysis, Science of Software Tracing, Security, Software Architecture, Software Behavior Patterns, Software Chorography, Software Chorology, Software Defect Construction, Software Engineering, Software Generalist, Software Maintenance Institute, Software Narratology, Software Technical Support, Software Trace Analysis, Software Trace Analysis and History, Software Trace Deconstruction, Software Trace Reading, Software Trace Visualization, Software Tracing for Dummies, Software Troubleshooting Patterns, Software Victimology, Stack Trace Collection, Structural Memory Analysis and Social Sciences, Structural Memory Patterns, Structural Trace Patterns, Systems Thinking, Testing, Theology, Tool Objects, Tools, Trace Analysis Patterns, Training and Seminars, Troubleshooting Methodology, Uses of UML, Victimware, Virtualization, Vista, Visual Dump Analysis, Webinars, WinDbg Scripts, WinDbg Tips and Tricks, WinDbg for GDB Users, Windows 7, Windows Server 2008, Windows System Administration, Workaround Patterns, x64 Windows | No Comments »
Thursday, October 28th, 2010
Motivated by the existence of London School of Economics (LSE) I just founded DSS. The program to be communicated soon and includes general memory dump and software trace analysis as a foundation for security. I like the name very much because of its additional meaning:
DUmps Binary Logs INternals
- Dmitry Vostokov @ DumpAnalysis.org + TraceAnalysis.org -
Posted in Announcements, Dublin School of Security, Malware Analysis, Malware Patterns, Memoretics, Memory Analysis Forensics and Intelligence, Memory Analysis Report System, New Acronyms, Security | 1 Comment »
Saturday, October 23rd, 2010
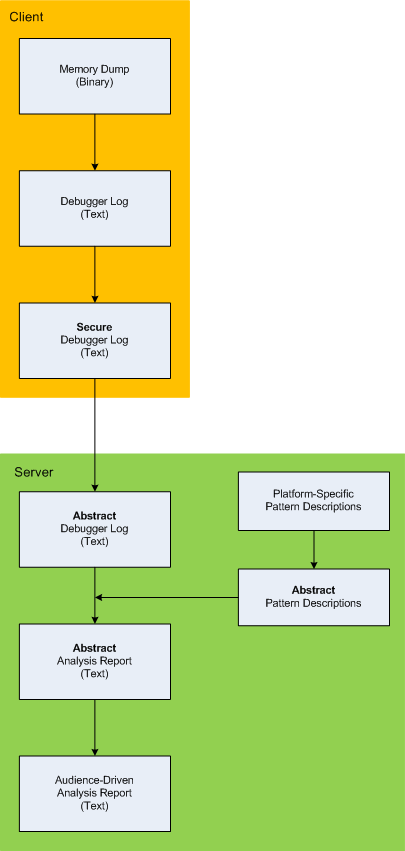
Here is the description of a high-level architecture of the previously announced project CARE (Crash Analysis Report Environment). To remind, the main idea of the project is to process memory dumps on a client to save debugger logs. They can be sent to a server for pattern-driven analysis of software behaviour. Textual logs can also be inspected by a client security team before sending. Certain sensitive information can be excluded or modified to have generic meaning according to the built-in processing rules like renaming (for example, server names and folders). Before processing, verified secured logs are converted to abstract debugger logs. Abstracting platform-specific debugger log format allows reuse of the same architecture for different computer platforms. We call it CIA (Computer Independent Architecture). Do not confuse it with ICA (Independent Computer Architecture) and CIA acronym is more appropriate for memory analysis (like similar MAFIA acronym, Memory Analysis Forensics and Intelligence Architecture). These abstract logs are checked for various patterns (in abstracted form) using abstract debugger commands and an abstract report is generated according to various checklists. Abstract reports are then converted to structured reports for the required audience level. Abstract memory analysis pattern descriptions are prepared from platform-specific pattern descriptions. In certain architectural component deployment configurations both client and server parts can reside on the same machine. Here’s the simple diagram depicting the flow of processing:
- Dmitry Vostokov @ DumpAnalysis.org + TraceAnalysis.org -
Posted in Announcements, Crash Analysis Report Environment (CARE), Crash Dump Analysis, Crash Dump Patterns, Debugging, Memory Analysis Forensics and Intelligence, New Acronyms, Security, Software Architecture, Software Behavior Patterns, Software Technical Support, Structural Memory Patterns, Tools | No Comments »
Friday, October 22nd, 2010
I detour for MARS expedition. You may also call it Memory Analysis Report System as malware analysis is always exploration of memory (in general). Why is this sudden change of course? After reading Gilles Deleuze I want to broaden the concept of “malware” and give it new orientation and direction of thinking. Beside that I also want new challenges after many years of research in pattern-driven memory dump and software trace analysis of abnormal software behaviour.
You may have also noticed small restructuring (rebranding) of this blog and DumpAnalysis.org headers.
See you there 
- Dmitry Vostokov @ DumpAnalysis.org + TraceAnalysis.org -
Posted in Announcements, Archaeology of Computer Memory, Assembly Language, Computer Science, Education and Research, General Memory Analysis, Malware Analysis, Malware Patterns, Memiotics (Memory Semiotics), Memoretics, Memory Analysis Forensics and Intelligence, Memory Analysis Report System, Memory Dump Analysis Services, New Acronyms, Philosophy, Science of Memory Dump Analysis, Science of Software Tracing, Security, Software Trace Analysis, Software Victimology, Structural Memory Patterns, Systems Thinking, Tools, Trace Analysis Patterns, Victimware, Windows System Administration | No Comments »
Thursday, September 30th, 2010
Another tool that supports adjoint threading in addition to Citrix CDFAnalyzer (see also Debugging Experts magazine article for pictorial description of this concept) is Process Monitor. We can view adjoint threads having common attributes like TID (ordinary threads), PID, operation (function), process name, etc. by using this right click context menu:
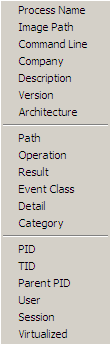
For example, this adjoint thread having RegOpenKey as its ATID (Adjoint Thread ID) where we excluded Path, Result and Detail fields for viewing clarity (together these fields can constitute an analogous Message field in TMF traces):
Time of Day      Process Name PID  TID  Operation

[…]

09:33:25.9545410 Explorer.EXE 1292 1032 RegOpenKey

09:33:25.9548650 Explorer.EXE 1292 1032 RegOpenKey

09:33:25.9550234 Explorer.EXE 1292 1032 RegOpenKey

09:33:25.9551656 Explorer.EXE 1292 1032 RegOpenKey

09:33:25.9692456 WFICA32.EXE  3588 3496 RegOpenKey

09:33:25.9761325 wfcrun32.exe 852  1148 RegOpenKey

09:33:25.9761912 wfcrun32.exe 852  1148 RegOpenKey

09:33:25.9762295 wfcrun32.exe 852  1148 RegOpenKey

09:33:25.9984547 wfcrun32.exe 852  1148 RegOpenKey

09:33:26.0023831 wfcrun32.exe 852  1148 RegOpenKey

09:33:26.0074675 wfcrun32.exe 852  1148 RegOpenKey

09:33:26.0087191 Explorer.EXE 1292 1032 RegOpenKey

09:33:26.1618595 iexplore.exe 1348 2228 RegOpenKey

09:33:26.1625697 iexplore.exe 1348 2228 RegOpenKey

09:33:26.1632745 iexplore.exe 1348 2228 RegOpenKey

09:33:26.1633924 iexplore.exe 1348 2228 RegOpenKey

09:33:26.1639209 iexplore.exe 1348 2228 RegOpenKey

[…]
So if someone writes a converter from TMF to PML format…
- Dmitry Vostokov @ DumpAnalysis.org + TraceAnalysis.org -
Posted in Debugging, Multithreading, New Acronyms, Software Trace Analysis, Software Trace Reading, Tools, Trace Analysis Patterns | No Comments »
Tuesday, September 28th, 2010
Who’s your BOSS (Basic Operating Support System)?
I report to Memory……………………………………………………….
Dmitry Vostokov
- Dmitry Vostokov @ DumpAnalysis.org + TraceAnalysis.org -
Posted in Bugtations, Memoidealism, Memory Religion (Memorianity), New Acronyms, Philosophy | No Comments »
Monday, September 20th, 2010
There many interpretations of the letter M in M-theory but I propose another one: M stands for Memory. In any outcome it surely will be committed to memory in the future either as successful or not. On the other hand I’m now trying to make sense of it in relation to Memory as an ur-foundation (ur-, primordial, German prefix).
- Dmitry Vostokov @ DumpAnalysis.org + TraceAnalysis.org -
Posted in Fun with Crash Dumps, Memoidealism, Memoretics, Memuonics, New Acronyms, New Words, Philosophy, Physics | No Comments »