Bugtation No.59
Friday, October 31st, 2008“One of the pleasures of reading old” memory dumps “is the knowledge that they need no answer.”
- Dmitry Vostokov @ DumpAnalysis.org -
“One of the pleasures of reading old” memory dumps “is the knowledge that they need no answer.”
- Dmitry Vostokov @ DumpAnalysis.org -
Monthly summary of my Management Bits and Tips blog:
- Dmitry Vostokov @ DumpAnalysis.org -
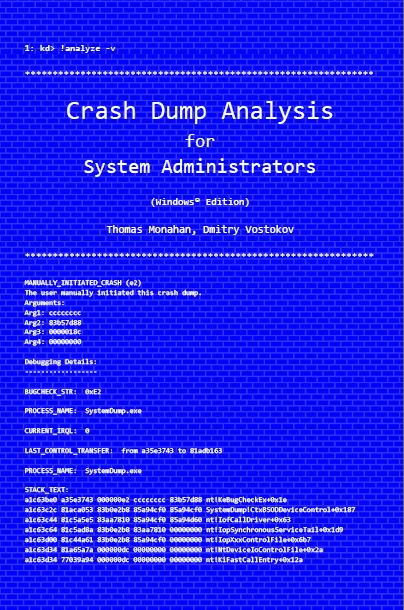
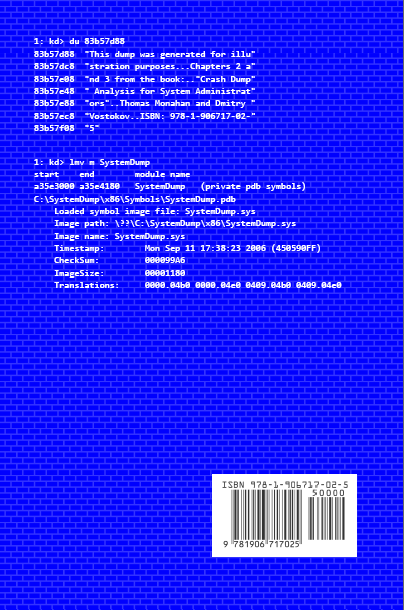
Previously announced book Crash Dump Analysis for System Administrators and Support Engineers (Windows Edition) has got its draft cover featuring WinDbg output from a kernel memory dump forced by Citrix SystemDump tool.
Front:
Back:
- Dmitry Vostokov @ DumpAnalysis.org -
Monthly summary of my Literate Scientist blog:
- Dmitry Vostokov @ DumpAnalysis.org -
Because of the larger virtual address space x64 Windows servers are usually equipped with 16Gb or more physical memory to take advantage of new vast memory layout where pools are “virtually” unlimited and their size is measured in Gb than in Mb (highlighted in enlarged blue font below):
0: kd> !vm
*** Virtual Memory Usage ***

        Physical Memory:     4193970 (  16775880 Kb)

        Page File: \??\C:\pagefile.sys

          Current:  17825792 Kb  Free Space:  17810140 Kb

          Minimum:  17825792 Kb  Maximum:     17825792 Kb

        Page File: \??\D:\pagefile.sys

          Current:  32768000 Kb  Free Space:  32754984 Kb

          Minimum:  32768000 Kb  Maximum:     32768000 Kb

        Available Pages:     3851036 (  15404144 Kb)

        ResAvail Pages:      3951755 (  15807020 Kb)

        Locked IO Pages:         136 (       544 Kb)

        Free System PTEs:   16752738 (  67010952 Kb)

        Free NP PTEs:        1635326 (   6541304 Kb)

        Free Special NP:           0 (         0 Kb)

        Modified Pages:           52 (       208 Kb)

        Modified PF Pages:        38 (       152 Kb)

        NonPagedPool Usage:    12421 (     49684 Kb)

        NonPagedPool Max:    1668607 (   6674428 Kb)

        PagedPool 0 Usage:      9501 (     38004 Kb)

        PagedPool 1 Usage:       604 (      2416 Kb)

        PagedPool 2 Usage:       616 (      2464 Kb)

        PagedPool 3 Usage:       598 (      2392 Kb)

        PagedPool 4 Usage:       603 (      2412 Kb)

        PagedPool Usage:       11922 (     47688 Kb)

        PagedPool Maximum:   6674432 (  26697728 Kb)

        Shared Commit:          2649 (     10596 Kb)

        Special Pool:              0 (         0 Kb)

        Shared Process:         8472 (     33888 Kb)

        PagedPool Commit:      11949 (     47796 Kb)

        Driver Commit:          2603 (     10412 Kb)

        Committed pages:      159687 (    638748 Kb)

        Commit limit:       16686113 (  66744452 Kb)
[...]
It came to my attention today that complete memory dumps can be smaller, sparser in such big memory layouts with many unused physical memory regions. Therefore, complete memory dumps could be smaller than the actual amount of physical memory and even when possibly truncated with many OS structures being included. For the virtual memory stats above the size of complete memory dump was 5Gb and although WinDbg reports the dump as truncated with 16Gb of physical memory it was possible that everything was fit into the first 5Gb of physical memory and saved accordingly in 17Gb page file. For example, !locks command works perfectly (it frequently unable to traverse truncated complete dumps from 32-bit Windows):
0: kd> !locks

**** DUMP OF ALL RESOURCE OBJECTS ****

KD: Scanning for held locks...
Resource @ nt!CmpRegistryLock (0xfffff800011de220)    Shared 1 owning threads

    Contention Count = 11

     Threads: fffffade708e17a0-01<*>

KD: Scanning for held locks...
Resource @ 0xfffffade6f8b1a40    Shared 1 owning threads

     Threads: fffffade708e17a0-01<*>

KD: Scanning for held locks...
6213 total locks, 2 locks currently held
At the same time some data is missing from the file so it could be really truncated dump. For example, the information about computer name is missing:
0: kd> dq srv!srvcomputername l2

fffffade`57919a10  00000000`00220010 fffffa80`01cfa980
0: kd> !address fffffade`57919a10

  fffffade55e04000 - 0000000005ffb000           ffade6e1108e0

          Usage       KernelSpaceUsageNonPagedSystem
0: kd> !pte fffffade`57919a10

                                 VA fffffade57919a10

PXE @ FFFFF6FB7DBEDFA8     PPE at FFFFF6FB7DBF5BC8    PDE at FFFFF6FB7EB795E0    PTE at FFFFF6FD6F2BC8C8

contains 0000000114E00863  contains 000000011CD63863  contains 000000011CE20963  contains 80000000A8265963

pfn 114e00 —DA–KWEV        pfn 11cd63 —DA–KWEV        pfn 11ce20 -G-DA–KWEV        pfn a8265 -G-DA–KW-V
0: kd> du fffffa80`01cfa980 l10

fffffa80`01cfa980  “????????????????”
0: kd> !address fffffa80`01cfa980

  fffffa8000000000 - 000000065d800000           ffade6e1108e0

          Usage       KernelSpaceUsagePagedPool
0: kd> !pte fffffa80`01cfa980

                                 VA fffffa8001cfa980

PXE @ FFFFF6FB7DBEDFA8     PPE at FFFFF6FB7DBF5000    PDE at FFFFF6FB7EA00070    PTE at FFFFF6FD4000E7D0

Unable to get PDE FFFFF6FB7EA00070
Fortunately I got the computer name from a PEB of a randomly selected process though:
0: kd> .process /r /p fffffade6ddd9c20

Implicit process is now fffffade`6ddd9c20

Loading User Symbols

...
0: kd> !peb

PEB at 000000007efdf000

[...]

        COMPUTERNAME=SERVER_A

[…]
I remember that during my Florida trip almost 5 years ago people were worrying about troubleshooting crashes and hangs on 64-bit Windows and discussed how they would send zipped complete memory dumps on several DVD via a courier post. Now with Blu-ray discs (BD) becoming a commodity the size of complete memory dumps is not perceived as a big problem… For really huge dumps WinDbg scripts collecting data on-site might be a solution too (see Dmp2Txt: Solving Security Problem for WinDbg script usage).
- Dmitry Vostokov @ DumpAnalysis.org -
“Nothing would be more tiresome than” coding “and” debugging “if” evolution “had not made them a pleasure as well as a necessity.”
Voltaire, Dialogues philosophiques
- Dmitry Vostokov @ DumpAnalysis.org -
In part 1 we discussed the common mistake of not looking at full stack traces. In this part we discuss the common mistake of not looking at all stack traces. This is important when the dump is partially truncated or inconsistent. For example, in one complete memory dump from one hang system WinDbg !locks command is not able to traverse them at all due to truncated dump:
3: kd> !locks

**** DUMP OF ALL RESOURCE OBJECTS ****

KD: Scanning for held locks.......Error 1 in reading nt!_ERESOURCE.SystemResourcesList.Flink @ f71612a0
The common response, especially from beginners, would be to dismiss this dump and request the new one after increasing page file size. However, dumping all thread stacks reveals the resource contention around ERESOURCE objects similar to what was discussed in a mixed object deadlock example in kernel space:
3: kd> !stacks

Proc.Thread  .Thread  Ticks   ThreadState Blocker

[...]

                            [85973590 csrss.exe]

4138.0051e0  85961db0 00cb222 Blocked    driverA+0xec08

4138.0048c8  85d1d240 000006d Blocked    nt!ExEnterCriticalRegionAndAcquireResourceExclusive+0×19

4138.0054cc  85c8a840 00c0d50 Blocked    driverA+0xec08

4138.00227c  859be330 00c0d53 Blocked    driverA+0xec08

4138.0053d8  8590f458 00000df Blocked    nt!ExEnterCriticalRegionAndAcquireResourceExclusive+0×19

4138.003bb4  85b61020 00000e1 Blocked    nt!ExEnterCriticalRegionAndAcquireResourceExclusive+0×19

4138.002a08  85d1edb0 00000e1 Blocked    nt!ExEnterCriticalRegionAndAcquireResourceExclusive+0×19

4138.005e6c  85943020 00cc9cc Blocked    driverA+0xec08

4138.00575c  858eeb40 00c0d4e Blocked    driverA+0xec08

4138.003880  858ee5f8 00c0d51 Blocked    driverA+0xec08
                            [85bb9b18 winlogon.exe]

50e0.0054d4  85a8cb30 00c0d53 Blocked    driverA+0xec08

50e0.004b90  85b6c7b8 000001a Blocked    nt!ExEnterCriticalRegionAndAcquireResourceExclusive+0×19

50e0.0032cc  85a1f850 0000084 Blocked    nt!ExEnterCriticalRegionAndAcquireResourceExclusive+0×19

50e0.005450  85c43db0 0000014 Blocked    nt!ExEnterCriticalRegionAndAcquireResourceExclusive+0×19

50e0.005648  85a1f5e0 0000015 Blocked    nt!ExEnterCriticalRegionAndAcquireResourceExclusive+0×19

50e0.004a80  85a7abd8 000001b Blocked    nt!ExEnterCriticalRegionAndAcquireResourceExclusive+0×19

50e0.0036d8  85d886a8 000001b Blocked    nt!ExEnterCriticalRegionAndAcquireResourceExclusive+0×19

50e0.0055b0  85d88438 0000014 Blocked    nt!ExEnterCriticalRegionAndAcquireResourceExclusive+0×19

50e0.004380  85962020 00c0d53 Blocked    driverA+0xec08

50e0.005744  85a22db0 0000015 Blocked    nt!ExEnterCriticalRegionAndAcquireResourceExclusive+0×19

50e0.005dd4  8584c7a0 0000015 Blocked    nt!ExEnterCriticalRegionAndAcquireResourceExclusive+0×19

50e0.005e30  858902f0 0000018 Blocked    nt!ExEnterCriticalRegionAndAcquireResourceExclusive+0×19

50e0.005ce8  857bbdb0 00c0d53 Blocked    driverA+0xec08
                            [85914868 explorer.exe]

5fd8.005fdc  85911020 0000016 Blocked    nt!ExEnterCriticalRegionAndAcquireResourceExclusive+0×19

5fd8.005fec  8579d020 00bc253 Blocked    driverA+0xec08

5fd8.005ff8  857ce020 0000014 Blocked    nt!ExEnterCriticalRegionAndAcquireResourceExclusive+0×19

5fd8.003678  857ce8d0 00bc253 Blocked    driverA+0xec08

5fd8.00556c  857ce3f0 00b85d9 Blocked    driverA+0xec08

5fd8.005564  857e4db0 00bc253 Blocked    driverA+0xec08

5fd8.005548  86529380 00bc253 Blocked    driverA+0xec08

5fd8.006fd8  856095c8 00bc253 Blocked    driverA+0xec08

5fd8.001844  85d50020 00bc253 Blocked    driverA+0xec08

5fd8.0069cc  85ab8db0 000001a Blocked    nt!ExEnterCriticalRegionAndAcquireResourceExclusive+0×19

5fd8.0057c4  85fea2b0 00bc253 Blocked    driverA+0xec08

5fd8.00394c  85a475b8 00bc253 Blocked    driverA+0xec08

5fd8.004a8c  86090020 00bc253 Blocked    driverA+0xec08

5fd8.00583c  85990db0 00bc253 Blocked    driverA+0xec08
                            [858634a0 ApplicationA.EXE]

5b7c.005ad8  8597ddb0 0078325 Blocked    driverA+0xec08

5b7c.0058b4  85735020 00b6852 Blocked    driverA+0xec08

5b7c.00598c  8597db40 000001a Blocked    nt!ExEnterCriticalRegionAndAcquireResourceExclusive+0×19

5b7c.0059dc  85746a18 000001a Blocked    nt!ExEnterCriticalRegionAndAcquireResourceExclusive+0×19

5b7c.005b3c  85733ae8 0000016 Blocked    nt!ExEnterCriticalRegionAndAcquireResourceExclusive+0×19

5b7c.005934  85733878 0000018 Blocked    nt!ExEnterCriticalRegionAndAcquireResourceExclusive+0×19

5b7c.002b68  85bb8a40 0000016 Blocked    nt!ExEnterCriticalRegionAndAcquireResourceExclusive+0×19

5b7c.0016dc  85747438 0000018 Blocked    nt!ExEnterCriticalRegionAndAcquireResourceExclusive+0×19

5b7c.003fc0  8577ea60 00b6852 Blocked    driverA+0xec08

5b7c.0066a4  8595c2f8 0000016 Blocked    nt!ExEnterCriticalRegionAndAcquireResourceExclusive+0×19

5b7c.006b50  893d5660 0000018 Blocked    nt!ExEnterCriticalRegionAndAcquireResourceExclusive+0×19

5b7c.0066f4  8605f530 00b6852 Blocked    driverA+0xec08

5b7c.001554  85930cf0 00b6852 Blocked    driverA+0xec08

5b7c.006f28  86132db0 00b6852 Blocked    driverA+0xec08

5b7c.004448  85aa6890 0000016 Blocked    nt!ExEnterCriticalRegionAndAcquireResourceExclusive+0×19

5b7c.000fa8  859073c8 00b6852 Blocked    driverA+0xec08
                            [8595c928 ApplicationB.exe]

5990.0059a0  857c5508 000001a Blocked    nt!ExEnterCriticalRegionAndAcquireResourceExclusive+0×19

5990.005950  85ce7548 00b3b52 Blocked    driverA+0xec08

5990.005c10  856dc910 00b3b52 Blocked    driverA+0xec08

5990.005bd4  85767b40 00b3b52 Blocked    driverA+0xec08

5990.005e38  859b6a18 000001a Blocked    nt!ExEnterCriticalRegionAndAcquireResourceExclusive+0×19

5990.005f14  85a747a0 0000015 Blocked    nt!ExEnterCriticalRegionAndAcquireResourceExclusive+0×19

5990.005e68  85989020 0000015 Blocked    nt!ExEnterCriticalRegionAndAcquireResourceExclusive+0×19

5990.005f10  859f42d8 0000015 Blocked    nt!ExEnterCriticalRegionAndAcquireResourceExclusive+0×19

5990.005f0c  856ec5e8 00b3b52 Blocked    driverA+0xec08

5990.0045d0  856ec9a8 0000016 Blocked    nt!ExEnterCriticalRegionAndAcquireResourceExclusive+0×19

5990.004584  85728020 0000018 Blocked    nt!ExEnterCriticalRegionAndAcquireResourceExclusive+0×19

5990.004754  8572d818 0000016 Blocked    nt!ExEnterCriticalRegionAndAcquireResourceExclusive+0×19

5990.004b94  856cf020 00b3b52 Blocked    driverA+0xec08

5990.003374  85722db0 0000016 Blocked    nt!ExEnterCriticalRegionAndAcquireResourceExclusive+0×19

5990.000b1c  8647ddb0 00b3b52 Blocked    driverA+0xec08

5990.003bdc  85f812f0 00b3b52 Blocked    driverA+0xec08
                            [859bd598 dllhost.exe]

5e3c.00591c  8593e2f0 000001a Blocked    nt!ExEnterCriticalRegionAndAcquireResourceExclusive+0×19

5e3c.005e60  85777db0 000006e Blocked    nt!ExEnterCriticalRegionAndAcquireResourceExclusive+0×19

5e3c.005e64  85978b40 0000018 Blocked    nt!ExEnterCriticalRegionAndAcquireResourceExclusive+0×19

5e3c.0055c8  85903358 0000018 Blocked    nt!ExEnterCriticalRegionAndAcquireResourceExclusive+0×19
[...]
Threads Processed: 1500
Different methods to list all thread stacks are listed in Stack Trace Collection pattern.
- Dmitry Vostokov @ DumpAnalysis.org -
The perfect binary Christmas gift for your family and friends is soon available on Amazon, B&N and in local bookshops around the world! In the mean time you can view the product information and even order it:
- Dmitry Vostokov @ DumpAnalysis.org -
Computation “is a succession of” steps. “To” compute “each one is to succeed.”
- Dmitry Vostokov @ DumpAnalysis.org -
It is not about me. It is the reciprocal counterpart to Five golden rules of troubleshooting. Whereas the former are for artefact submitters, internal and external customers of memory dump analysts and complex trace readers, I‘m RARE are rules for writing analysis reports with easy to remember mnemonic:
I‘m RARE - Iridium Rules of Analysis Report Excellence
Note about Iridium metal from Wikipedia: “It is one of the rarest elements in the Earth’s crust, with annual production and consumption of only three tonnes.”
Here is the draft number 5 of them (subject to change in the forthcoming weeks):
Use a template.
Structure a report according to audience technical level and organizational processes.
Use checklists not only for commands and tools but also for things to avoid in reports and things to encourage.
Put all relevant data for later search and for other engineers to reproduce the analysis.
Provide appropriate explanations and narrative in the cases where analysis is inconclusive.
This also needs to be integrated with PARTS methodology.
- Dmitry Vostokov @ DumpAnalysis.org -
This is an example of a complex bugtation:
Bugteriology is the study of bugteria. “It comprises the identification, classification and characterization of” bugterial “species.” Bugteria “are identified by their properties, for example their looks, what” memory dumps “they can” appear in “or not” appear in, “what” bugs “they require for growth, what” effects “they produce, etc. To study morphology, that is the” phenotype “of” bugteria, “a” debugger “is used.”
Virtual Museum of Bacteria, Bacteriology: the study of bacteria
- Dmitry Vostokov @ DumpAnalysis.org -
I continued thinking about bugteria in memory dumps all the day yesterday and came to the conclusion that the study of crash dump analysis patterns needs its own name and the obvious choice was Bugteriology:
Bugteriology is the study of crash dump analysis patterns (bugteria). Its main subject is identification, classification and characterization of such patterns found in memory dumps (bugterial species).
I initially registered a domain for this purpose (later abandoned) pointing to crash dump analysis and debugging portal but I want to think through this idea and perhaps make it a subdomain of dumpanalysis.org with a page for easy online pattern classification and make it also an online supplement to forthcoming encyclopedia of crash dump analysis patterns.
- Dmitry Vostokov @ DumpAnalysis.org -
Yesterday was one of those days when I was in a good mood thinking about bugs. Suddenly a thought stroke me about the similar sounding words bacterium and bugterium (perhaps because I’m currently reading a theoretical biology book, Essays on Life Itself). I admit that it might be sounding the same only for a non-native English ear though. So the new definition was born:
Bugterium (pl. bugteria) - an instance of a memory dump analysis pattern found in a crash (memory, core) dump file.
Why a bugterium and not a cdarium? The motivation (with a hindsight) lies in the complexity of debugging (and life forms). While a bug is a complex thing (and a beast) and it takes sometimes days or weeks to chase and fix (kill) the one, a bugterium (bacterium) is of relatively smaller complexity and can be easily identified and dealt with by component removal or upgrade (massively killed). From software support perspective remember this bugtation No.14:
Crash dump analysis ”is anticipated with” joy, “performed with” eagerness, “and bragged about forever.”
Although the perceived simplicity of crash dump analysis is deceptive (bugtation No.2):
“It requires a very unusual mind to undertake the analysis of the obvious” crash.
Alfred North Whitehead, Science and the Modern World
- Dmitry Vostokov @ DumpAnalysis.org -
Now it is the turn for the yet another pattern of a deadlock variety involving mixed objects in kernel space. Previously we discussed deadlock patterns involving critical sections in user space, executive resources in kernel space, mixed objects in user space and LPC.
Let’s look at a complete manual dump file from a hanging system:
0: kd> !analyze -v
NMI_HARDWARE_FAILURE (80)

This is typically due to a hardware malfunction.  The hardware supplier should

be called.

Arguments:

Arg1: 004f4454

Arg2: 00000000

Arg3: 00000000

Arg4: 00000000
Here we have problems reading all executive resource locks:
3: kd> !locks

**** DUMP OF ALL RESOURCE OBJECTS ****

KD: Scanning for held locks....
Resource @ nt!CmpRegistryLock (0x808a48c0)    Shared 36 owning threads

    Contention Count = 48

     Threads: 86aecae0-01<*> 8b76db40-01<*> 8b76ddb0-01<*> 89773020-01<*>

              87222db0-01<*> 87024ba8-01<*> 89a324f0-01<*> 86b4e298-01<*>

              87925b40-01<*> 86b4db40-01<*> 8701f738-01<*> 86ffb198-01<*>

              86b492f0-01<*> 8701bad8-01<*> 86ae2db0-01<*> 86c85db0-01<*>

              86a9ddb0-01<*> 86a86db0-01<*> 86aa7db0-01<*> 86a9f5c0-01<*>

              86c5adb0-01<*> 8767ba38-01<*> 86afedb0-01<*> 89877960-01<*>

              8772cdb0-01<*> 87348628-01<*> 874d6748-01<*> 872365e0-01<*>

              87263970-01<*> 873bf020-01<*> 86c13db0-01<*> 893dcdb0-01<*>

              86afa020-01<*> 878e5020-01<*> 874959f8-01<*> 86b2dc70-01<*>

KD: Scanning for held locks…Error 1 in reading nt!_ERESOURCE.SystemResourcesList.Flink @ f76ee2a0
This is probably because the dump was truncated:
Loading Dump File [MEMORY.DMP]

Kernel Complete Dump File: Full address space is available
WARNING: Dump file has been truncated. Data may be missing.
However looking at the resource 808a48c0 closely we see that it is owned by the thread 86aecae0 (Cid 2810.2910) which is blocked on a mutant owned by the thread 86dcf3a8:
3: kd> !locks -v 0x808a48c0
Resource @ nt!CmpRegistryLock (0x808a48c0)    Shared 36 owning threads

    Contention Count = 48

     Threads: 86aecae0-01<*>
     THREAD 86aecae0  Cid 2810.2910  Teb: 7ffdd000 Win32Thread: bc54ab88 WAIT: (Unknown) KernelMode Non-Alertable

         86dda264  Mutant - owning thread 86dcf3a8

     Not impersonating

     DeviceMap                 da534618

     Owning Process            86f30b70       Image:         ApplicationA.exe

     Wait Start TickCount      1074481        Ticks: 51601 (0:00:13:26.265)

     Context Switch Count      9860                 LargeStack

     UserTime                  00:00:01.125

     KernelTime                00:00:00.890

     Win32 Start Address 0×300019f0

     Start Address kernel32!BaseProcessStartThunk (0×7c8217f8)

     Stack Init b5342000 Current b5341150 Base b5342000 Limit b533d000 Call 0

     Priority 12 BasePriority 10 PriorityDecrement 0

     ChildEBP RetAddr

     b5341168 80833465 nt!KiSwapContext+0×26

     b5341194 80829a62 nt!KiSwapThread+0×2e5

     b53411dc b91f4c08 nt!KeWaitForSingleObject+0×346

WARNING: Stack unwind information not available. Following frames may be wrong.

     b5341200 b91ee770 driverA+0xec08

     b5341658 b91e9ca7 driverA+0×8770

     b5341af0 8088978c driverA+0×3ca7

     b5341af0 8082f829 nt!KiFastCallEntry+0xfc

     b5341b7c 808ce716 nt!ZwSetInformationFile+0×11

     b5341bbc 808dd8d8 nt!CmpDoFileSetSize+0×5e

     b5341bd4 808bd798 nt!CmpFileSetSize+0×16

     b5341bf4 808be23f nt!HvpGrowLog1+0×52

     b5341c18 808bfc6b nt!HvMarkDirty+0×453

     b5341c40 808c3fd4 nt!HvMarkCellDirty+0×255

     b5341cb4 808b7e2f nt!CmSetValueKey+0×390

     b5341d44 8088978c nt!NtSetValueKey+0×241

     b5341d44 7c9485ec nt!KiFastCallEntry+0xfc

     0013f5fc 00000000 ntdll!KiFastSystemCallRet
8b76db40-01<*>
     THREAD 8b76db40  Cid 0004.00c8  Teb: 00000000 Win32Thread: 00000000 GATEWAIT

     Not impersonating

     DeviceMap                 d6600900

     Owning Process            8b7772a8       Image:         System

     Wait Start TickCount      1074667        Ticks: 51415 (0:00:13:23.359)

     Context Switch Count      65106

     UserTime                  00:00:00.000

     KernelTime                00:00:00.781

     Start Address nt!ExpWorkerThread (0x80880352)

     Stack Init bae35000 Current bae34c68 Base bae35000 Limit bae32000 Call 0

     Priority 12 BasePriority 12 PriorityDecrement 0

     ChildEBP RetAddr

     bae34c80 80833465 nt!KiSwapContext+0x26

     bae34cac 8082ffc0 nt!KiSwapThread+0x2e5

     bae34cd4 8087d6f6 nt!KeWaitForGate+0x152

     dbba6d78 00000000 nt!ExfAcquirePushLockExclusive+0x112
[...]
A reminder about Cid. It is the so called Client id composed from Process id and Thread id (Pid.Tid). Also a mutant is just another name for a mutex object which has an ownership semantics:
0: kd> dt _KMUTANT 86dda264

nt!_KMUTANT

   +0x000 Header           : _DISPATCHER_HEADER

   +0x010 MutantListEntry  : _LIST_ENTRY [ 0x86dcf3a8 - 0x86dcf3a8 ]

   +0×018 OwnerThread      : 86dcf3a8 _KTHREAD

   +0×01c Abandoned        : 0 ”

   +0×01d ApcDisable       : 0×1 ”
Now we look at that thread 86dcf3a8 and see that it belongs to ApplicationB (Cid 25a0.14b8):
3: kd> !thread 86dcf3a8

THREAD 86dcf3a8  Cid 25a0.14b8  Teb: 7ffa9000 Win32Thread: bc3e0d20 WAIT: (Unknown) UserMode Non-Alertable

    8708b888  Thread

    86dcf420  NotificationTimer

Not impersonating

DeviceMap                 da534618

Owning Process            87272d88       Image:         ApplicationB.exe

Wait Start TickCount      1126054        Ticks: 28 (0:00:00:00.437)

Context Switch Count      2291                 LargeStack

UserTime                  00:00:00.078

KernelTime                00:00:00.218

Win32 Start Address msvcrt!_endthreadex (0×77b9b4bc)

Start Address kernel32!BaseThreadStartThunk (0×7c8217ec)

Stack Init b550a000 Current b5509c60 Base b550a000 Limit b5507000 Call 0

Priority 8 BasePriority 8 PriorityDecrement 0

ChildEBP RetAddr  Args to Child

b5509c78 80833465 86dcf3a8 86dcf450 00000003 nt!KiSwapContext+0×26

b5509ca4 80829a62 00000000 b5509d14 00000000 nt!KiSwapThread+0×2e5

b5509cec 80938d0c 8708b888 00000006 00000001 nt!KeWaitForSingleObject+0×346

b5509d50 8088978c 00000960 00000000 b5509d14 nt!NtWaitForSingleObject+0×9a

b5509d50 7c9485ec 00000960 00000000 b5509d14 nt!KiFastCallEntry+0xfc

WARNING: Stack unwind information not available. Following frames may be wrong.

0454f3cc 00000000 00000000 00000000 00000000 ntdll!KiFastSystemCallRet
We see that it is waiting on 8708b888 object which is a thread itself and it is waiting on the same mutant 86dda264 owned by the thread 86dcf3a8 (Cid 25a0.14b8):
3: kd> !thread 8708b888

THREAD 8708b888  Cid 25a0.1cb0  Teb: 7ffa6000 Win32Thread: bc3ecb20 WAIT: (Unknown) KernelMode Non-Alertable

    86dda264  Mutant - owning thread 86dcf3a8

Not impersonating

DeviceMap                 da534618

Owning Process            87272d88       Image:         ApplicationB.exe

Wait Start TickCount      1070470        Ticks: 55612 (0:00:14:28.937)

Context Switch Count      11                 LargeStack

UserTime                  00:00:00.000

KernelTime                00:00:00.000

Win32 Start Address dll!_beginthread (0×1b1122a9)

Start Address kernel32!BaseThreadStartThunk (0×7c8217ec)

Stack Init b4d12000 Current b4d117fc Base b4d12000 Limit b4d0f000 Call 0

Priority 9 BasePriority 8 PriorityDecrement 0

ChildEBP RetAddr  Args to Child

b4d11814 80833465 8708b888 8708b930 00000003 nt!KiSwapContext+0×26

b4d11840 80829a62 0000096c b4d118c4 b91e8f08 nt!KiSwapThread+0×2e5

b4d11888 b91f4c08 86dda264 00000006 00000000 nt!KeWaitForSingleObject+0×346

WARNING: Stack unwind information not available. Following frames may be wrong.

b4d118ac b91ee818 86dda260 b4d11d64 86dda000 DriverA+0xec08

b4d11d04 b91e8f58 000025a0 0000096c b4d11d64 DriverA+0×8818

b4d11d58 8088978c 0000096c 0567f974 7c9485ec DriverA+0×2f58

b4d11d58 7c9485ec 0000096c 0567f974 7c9485ec nt!KiFastCallEntry+0xfc

0567f974 30cba6ad 0000096c 00000000 00000003 ntdll!KiFastSystemCallRet
We can summarize our findings on the following wait chain diagram:
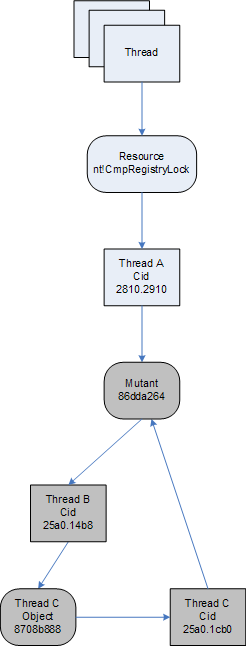
Looking from the component-object relationship perspective it is DriverA.sys that is waiting on the mutant 86dda264 although both blocked threads B and C belong to ApplicationB process.
- Dmitry Vostokov @ DumpAnalysis.org -
[Software] Defects “have a character of their own, but they also partake of” a program “character;” programs “have a character of” their “own, but” they “also partake of the world’s character.”
- Dmitry Vostokov @ DumpAnalysis.org -
“It takes a wise” engineer “to know when not to” debug.
- Dmitry Vostokov @ DumpAnalysis.org -
Just realized that yesterday I wrote 100th crash dump analysis pattern. Today I’m going to write 101st. Just to remind that the fully classified color catalog of them is planned to be published:
More details will be announced closer to that date.
- Dmitry Vostokov @ DumpAnalysis.org -
This is a very simple pattern I planned to write about long time ago. It is called C++ Exception. It is similar to Managed Code Exception and can be manifested by the same RaiseException call on top of the stack (red). However it is called by Visual C runtime (I consider Microsoft C/C++ implementation here, msvcrt.dll, magenta). The typical example of it might be checking the validity of a C++ stream operator data format (blue):
STACK_TEXT:

09d6f264 78007108 KERNEL32!RaiseException+0×56

09d6f2a4 677f2a88 msvcrt!_CxxThrowException+0×34

09d6f2bc 6759afff DLL!MyInputStream::operator>>+0×34
Also, some Visual C++ STL implementations check for out of bounds or invalid parameters and call unhandled exception filter directly, for example:
STACK_TEXT:

0012d2e8 7c90e9ab ntdll!KiFastSystemCallRet

0012d2ec 7c8094e2 ntdll!ZwWaitForMultipleObjects+0xc

0012d388 7c80a075 kernel32!WaitForMultipleObjectsEx+0x12c

0012d3a4 6945763c kernel32!WaitForMultipleObjects+0x18

0012dd38 694582b1 faultrep!StartDWException+0x5df

0012edac 7c8633b1 faultrep!ReportFault+0x533

0012f44c 004409b3 kernel32!UnhandledExceptionFilter+0x587

0012f784 00440a1b Application!_invoke_watson+0xc4

0012f79c 00406f4f Application!_invalid_parameter_noinfo+0xc

0012f7a0 0040566b Application!std::vector<std::basic_string<char, std::char_traits<char>, std::allocator<char> >, std::allocator<std::basic_string<char, std::char_traits<char>, std::allocator<char> > > >::operator[]+0×12
The latter example also shows how an unhandled exception filter in an application itself calls a postmortem debugger specified by AeDebug registry key (see also Who calls the postmortem debugger? post for detailed explanations).
- Dmitry Vostokov @ DumpAnalysis.org -
Trace “back a little to” debug “further.”
John Clarke (1596-1658), Proverbs: English and Latine
- Dmitry Vostokov @ DumpAnalysis.org -
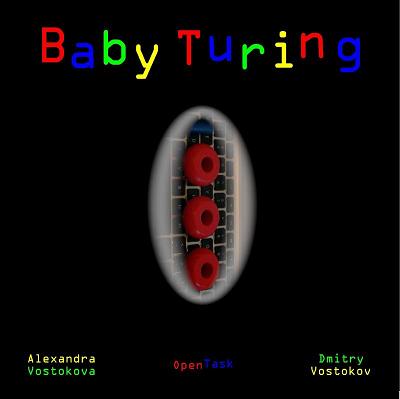
Finally, previously announced book Baby Turing was released to manufacture. It is co-authored with my daughter and dedicated to my son. The short book annotation:
The genius of Albert Einstein was revolutionary in understanding reality of hardware (semantics of nature) but the genius of Alan Turing was revolutionary in understanding virtuality of software (syntax of computation). This book fills the gap in children’s literature and introduces binary arithmetic to babies.
The front cover:
The back cover:
- Dmitry Vostokov @ DumpAnalysis.org -