Archive for the ‘Event Tracing for Windows (ETW)’ Category
Wednesday, September 26th, 2012
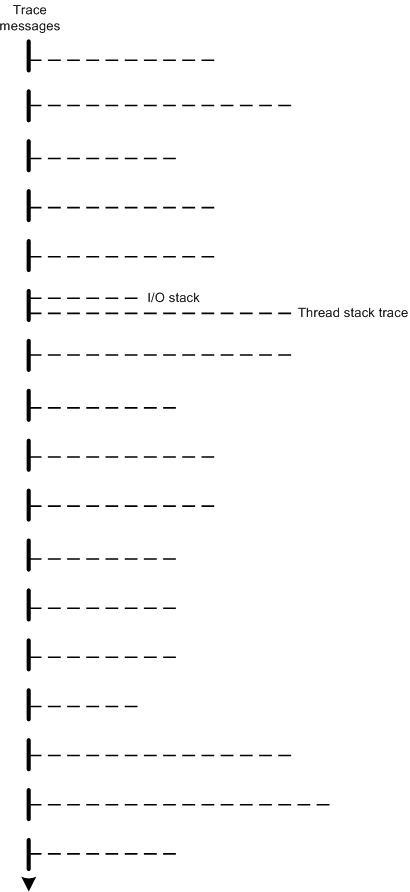
The modern software trace recording, visualization and analysis tools such as Process Monitor, Xperf, WPR and WPA provide stack traces associated with trace messages. Consider stack traces as software traces we have, in a more general case, traces (fibers) bundled together on (attached to) a base software trace. For example, a trace message, that mentions an IRP can have its I/O stack attached together with thread stack trace with function calls leading to a function that emitted the trace message. Another example is association of different types of traces with trace messages such as managed and unmanaged ones. This general trace analysis pattern needs a name so we opted for Fiber Bundle as analogy with a fiber bundle from mathematics. Here’s a graphical representation of stack traces recorded for each trace message where one message also has an associated I/O stack trace:
- Dmitry Vostokov @ DumpAnalysis.org + TraceAnalysis.org -
Posted in Debugging, Event Tracing for Windows (ETW), Performance Monitoring, Software Diagnostics, Software Narratology, Software Trace Analysis, Software Trace Reading, Software Trace Visualization, Trace Analysis Patterns | 1 Comment »
Friday, July 13th, 2012
For some time I was struggling with finding a good name for memory dump and software trace analysis activities. The name Memoretics I use for the science of memory dump analysis (that also incorporates software traces) seems not so good to describe the whole practical activity that should be transparent to everyone in IT. Fortunately, I timely understood that all these activities constitute the essence of software diagnostics that previously lacked any solid foundation. Thus, Software Diagnostics Institute was reborn from the previous Crash Dump Analysis Portal. This institute does pure and applied research and scientific activities and in recent years was funded mainly from OpenTask publisher and recently from Memory Dump Analysis Services. The latter company also recognized that the broadening of its commercial activities requires a new name. So, Software Diagnostics Services was reborn:
The First Comprehensive Software Diagnostics Service
- Dmitry Vostokov @ DumpAnalysis.org + TraceAnalysis.org -
Posted in Announcements, Cloud Memory Dump Analysis, Complete Memory Dump Analysis, Core Dump Analysis, Crash Analysis Report Environment (CARE), Crash Dump Analysis, Debugging, Debugging Bureau, Debugging Industry, Debugging Methodology, Debugging Today, Debugging Trends, Education, Education and Research, Escalation Engineering, Event Tracing for Windows (ETW), First Fault Software Diagnostics, Generative Debugging, JIT Crash Analysis, JIT Memory Space Analysis, Java Debugging, Kernel Development, Kernel Memory Dump Analysis, Linux Crash Corner, MFC Debugging, Mac Crash Corner, Mac OS X, Malware Analysis, Memoretics, Memory Analysis Forensics and Intelligence, Memory Analysis Report System, Memory Dump Analysis Methodology, Memory Dump Analysis Services, Minidump Analysis, New Debugging School, Pattern-Driven Debugging, Pattern-Driven Software Support, Performance Monitoring, Root Cause Analysis, SQL Debugging, Security, Software Debugging Services, Software Diagnostics, Software Diagnostics Institute, Software Diagnostics Services, Software Engineering, Software Problem Solving, Software Technical Support, Software Trace Analysis, Software Trace Analysis Report Environment (STARE), Tools, Training and Seminars, Troubleshooting Methodology, Unified Software Diagnostics, Windows 7, Windows 8, Windows Azure, Windows Mobile, Windows Server 2008, Windows System Administration, x64 Mac OS X, x64 Windows | No Comments »
Tuesday, July 3rd, 2012
When depicting trace analysis patterns I used two-dimensional diagrams based on CDF (ETW) traces such as this one for a bifurcation point:

While working today on a new pattern I needed a new expressive way to graphically illustrate the same idea of trace bifurcation points but without too much drawing. Traces from particle chambers and scattering diagrams came to my imagination after draw the first few diagrams illustrating bifurcation points:

Time directional arrow end can be omitted:

Trace variation after a bifurcation point can be indicated by angle partition:

The case when a variation also happens before is illustrated on this diagram:

and the case with several bifurcations:

Are N-bifurcations like on the diagram below possible?

Yes, they are, if the course of execution depends on some non-binary trace message parameter such as a loaded module that implements a required interface differently.
- Dmitry Vostokov @ DumpAnalysis.org + TraceAnalysis.org -
Posted in CDF Analysis Tips and Tricks, Event Tracing for Windows (ETW), Science of Software Tracing, Software Narratology, Software Trace Analysis, Software Trace Diagramming, Software Trace Visualization, Trace Analysis Patterns | 1 Comment »
Sunday, April 15th, 2012
In a week this short full color book should appear in online bookstores:
- Title: Software Narratology: An Introduction to the Applied Science of Software Stories
- Authors: Dmitry Vostokov, Memory Dump Analysis Services
- Description: This is a transcript of Memory Dump Analysis Services Webinar about Software Narratology: an exciting new discipline and a field of research founded by DumpAnalysis.org. When software executes it gives us its stories in the form of UI events, software traces and logs. Such stories can be analyzed for their structure and patterns for troubleshooting, debugging and problem resolution purposes. Topics also include software narremes and their types, anticipatory software construction and software diagnostics.
- Publisher: OpenTask (April 2012)
- Language: English
- Product Dimensions: 28.0 x 21.6
- Paperback: 26 pages
- ISBN-13: 978-1908043078

- Dmitry Vostokov @ DumpAnalysis.org + TraceAnalysis.org -
Posted in Announcements, Books, CDF Analysis Tips and Tricks, Code Reading, Computer Science, Debugging, Debugging Methodology, Debugging Trends, Education and Research, Escalation Engineering, Event Tracing for Windows (ETW), Hermeneutics of Memory Dumps and Traces, Ideas, Narralog Programming Language, New Debugging School, Pattern-Driven Debugging, Pattern-Driven Software Support, Presentations, Publishing, Root Cause Analysis, SPDL, Science of Software Tracing, Software Behavior DNA, Software Behavior Patterns, Software Behavioral Genome, Software Diagnostics, Software Engineering, Software Narrative Fiction, Software Narrative Science, Software Narratology, Software Narremes, Software Problem Description Patterns, Software Problem Solving, Software Technical Support, Software Trace Analysis, Software Trace Analysis and History, Software Trace Deconstruction, Software Trace Linguistics, Software Trace Modeling, Software Trace Reading, Software Trace Visualization, Software Tracing Implementation Patterns, Software Troubleshooting Patterns, Structural Trace Patterns, Systems Thinking, Testing, Tools, Trace Analysis Patterns, Training and Seminars, Troubleshooting Methodology, UI Problem Analysis Patterns, Unified Debugging Patterns, Unified Software Diagnostics, Webinars | No Comments »
Monday, April 9th, 2012
Memory Dump Analysis Services organizes a free Webinar on Unified Software Diagnostics (USD) and the new scalable cost-effective software support model called Pattern-Driven Software Support devised to address various shortcomings in existing tiered software support organizations. Examples cover Windows, Mac OS and Linux.

Date: 22nd of June, 2012
Time: 17:00 (BST) 12:00 (EST) 09:00 (PST)
Duration: 60 minutes
Space is limited.
Reserve your Webinar seat now at:
https://www3.gotomeeting.com/register/172771078
- Dmitry Vostokov @ DumpAnalysis.org + TraceAnalysis.org -
Posted in Announcements, Best Practices, Crash Dump Analysis, Crash Dump Patterns, Debugging, Debugging Methodology, Debugging Trends, Economics, Escalation Engineering, Event Tracing for Windows (ETW), JIT Crash Analysis, JIT Memory Space Analysis, Malware Analysis, Malware Patterns, Memoretics, Memory Analysis Forensics and Intelligence, Memory Dump Analysis Methodology, Memory Dump Analysis Services, New Acronyms, New Debugging School, Pattern Prediction, Pattern-Driven Debugging, Pattern-Driven Software Support, Root Cause Analysis, Science of Memory Dump Analysis, Science of Software Tracing, Software Behavior DNA, Software Behavior Patterns, Software Behavioral Genome, Software Diagnostics, Software Engineering, Software Narratology, Software Problem Description Patterns, Software Problem Solving, Software Support Patterns, Software Technical Support, Software Trace Analysis, Software Troubleshooting Patterns, Software Victimology, Software and Economics, Structural Memory Patterns, Structural Trace Patterns, Systems Thinking, Testing, Tools, Trace Analysis Patterns, Training and Seminars, Troubleshooting Methodology, UI Problem Analysis Patterns, Unified Debugging Patterns, Unified Software Diagnostics, Victimware, Webinars, Workaround Patterns | No Comments »
