Archive for the ‘Software Architecture’ Category
Sunday, November 9th, 2014
Use cases are implemented in various components such as subsystems, processes, modules, and source code files. Most of the time with good tracing implementation we are able to see Use Case Trails: log messages corresponding to use case scenarios. For simple systems one log may fully correspond to just one use case, but for complex systems, especially distributed client-server ones, there may be several use case instances present simultaneously in one log. One way to disentangle them in the absence of UCID (Use Case ID) or some other grouping tag is to use Event Sequence Phase, the subject of the next pattern.
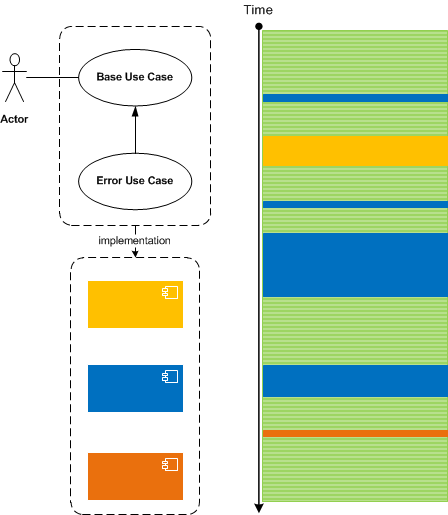
Master Traces may also correspond to use cases but they should ideally correspond to only one use case instance.
- Dmitry Vostokov @ DumpAnalysis.org + TraceAnalysis.org -
Posted in CDF Analysis Tips and Tricks, Debugging, Log Analysis, Software Architecture, Software Trace Analysis, Software Trace Deconstruction, Software Trace Reading, Trace Analysis Patterns | No Comments »
Thursday, October 23rd, 2014
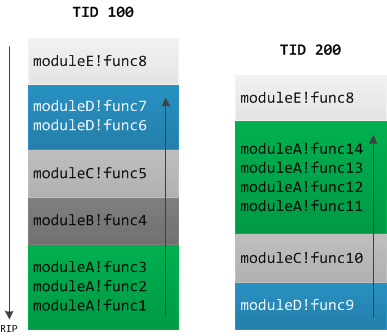
Most if not all Wait Chain patterns are about waiting for some synchronization objects. Stack Traces of involved threads may point to Blocking and Top modules. In some situations we may consider a module (which functions were called) itself as a pseudo-synchronization object where a module (who called it) is waiting for it to return back (to become “signaled”). All this is problem and context dependent where some intermediate modules may be Pass Through or Well-Tested. When we see module inversion, such as in the case of callbacks we may provisionally suspect some kind of a deadlock and then investigate these threads in terms of synchronization objects or their corresponding source code:
- Dmitry Vostokov @ DumpAnalysis.org + TraceAnalysis.org -
Posted in Crash Dump Analysis, Crash Dump Patterns, Software Architecture | 1 Comment »
Friday, February 8th, 2013
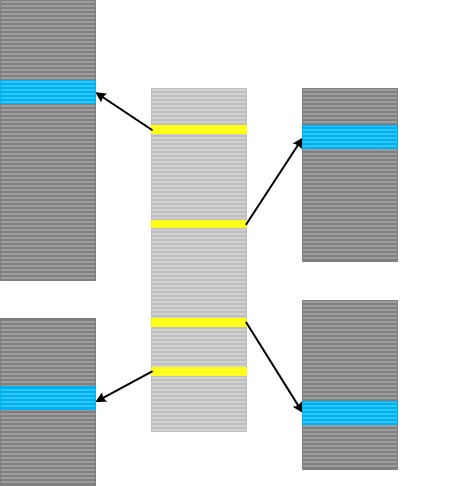
Indexical Trace pattern describes an Inter-Correlation pattern variant when we have a trace that has messages of interest pointing to specific activity regions in another trace. The latter trace can be very huge, from another computer and split into many parts (Split Trace). This pattern is very helpful when the problem needs to be diagnosed in the large split trace but we don’t know when it happened. Then an index trace that may have recorded software execution account (for example, in the case of a broker-like architecture) and can point to the right trace fragment from the split trace.
- Dmitry Vostokov @ DumpAnalysis.org + TraceAnalysis.org -
Posted in CDF Analysis Tips and Tricks, Debugging, Software Architecture, Software Trace Analysis, Software Trace Reading, Trace Analysis Patterns | No Comments »
Tuesday, October 9th, 2012
This is a new pattern that we call Error Reporting Fault. It’s about the faults in error reporting infrastructure. The latter should be guarded against such faults and avoid recursion. Here is a summary example of such a pattern on Windows platforms that involve Windows Error Reporting (WER).
In a complete memory dump we notice thousands of WerFault.exe processes:
0: kd> !process 0 0

[...]

PROCESS fffffa8058010380

SessionId: 2  Cid: 488f0    Peb: 7efdf000  ParentCid: 27cb8

DirBase: 25640c000  ObjectTable: fffff8a06cd2ac50  HandleCount:  54.

Image: WerFault.exe
PROCESS fffffa805bbd5970

SessionId: 2  Cid: 4801c    Peb: 7efdf000  ParentCid: 27cb8

DirBase: 2c3f69000  ObjectTable: fffff8a040563af0  HandleCount:  54.

Image: WerFault.exe
PROCESS fffffa8078aec060

SessionId: 2  Cid: 3feac    Peb: 7efdf000  ParentCid: 488f0

DirBase: abd200000  ObjectTable: fffff8a07851a0a0  HandleCount:  59.

Image: WerFault.exe
PROCESS fffffa805bbe9a10

SessionId: 2  Cid: 3d8b8    Peb: 7efdf000  ParentCid: 4801c

DirBase: 261f91000  ObjectTable: fffff8a02d864d40  HandleCount:  56.

Image: WerFault.exe
PROCESS fffffa805bd29060

SessionId: 2  Cid: 1142c    Peb: 7efdf000  ParentCid: 3feac

DirBase: 429fb3000  ObjectTable: fffff8a0355b42e0  HandleCount:  58.

Image: WerFault.exe
PROCESS fffffa8053d853d0

SessionId: 2  Cid: 1fc4c    Peb: 7efdf000  ParentCid: 3d8b8

DirBase: 714371000  ObjectTable: fffff8a01cb6bba0  HandleCount:  58.

Image: WerFault.exe

[...]
Each process has only one thread running through WOW64 modules so we get its 32-bit stack trace:
0: kd> !process fffffa8075c21b30 ff

[...]

THREAD fffffa807c183b60 Cid 2d3c8.4334c Teb: 000000007efdb000 Win32Thread: fffff900c3f71010 WAIT: (UserRequest) UserMode Non-Alertable

[...]
0: kd> .load wow64exts
0: kd> .process /r /p fffffa8075c21b30

Implicit process is now fffffa80`75c21b30

Loading User Symbols

Loading Wow64 Symbols
0: kd> .thread /w fffffa807c183b60

Implicit thread is now fffffa80`7c183b60

x86 context set
0: kd:x86> k

*** Stack trace for last set context - .thread/.cxr resets it

ChildEBP          RetAddr

000bf474 77080bdd ntdll!ZwWaitForMultipleObjects+0x15

000bf510 76bb1a2c KERNELBASE!WaitForMultipleObjectsEx+0x100

000bf558 76bb4208 kernel32!WaitForMultipleObjectsExImplementation+0xe0

000bf574 76bd80a4 kernel32!WaitForMultipleObjects+0x18

000bf5e0 76bd7f63 kernel32!WerpReportFaultInternal+0x186

000bf5f4 76bd7858 kernel32!WerpReportFault+0x70

000bf604 76bd77d7 kernel32!BasepReportFault+0x20

000bf690 776674df kernel32!UnhandledExceptionFilter+0x1af

000bf698 776673bc ntdll!__RtlUserThreadStart+0x62

000bf6ac 77667261 ntdll!_EH4_CallFilterFunc+0x12

000bf6d4 7764b459 ntdll!_except_handler4+0x8e

000bf6f8 7764b42b ntdll!ExecuteHandler2+0x26

000bf71c 7764b3ce ntdll!ExecuteHandler+0x24

000bf7a8 77600133 ntdll!RtlDispatchException+0x127

000bf7b4 000bf7c0 ntdll!KiUserExceptionDispatcher+0xf

WARNING: Frame IP not in any known module. Following frames may be wrong.

000bfb00 77629ef2 0xbf7c0

[…]
We find exception processing and code on stack (return address belongs to stack range). This thread is waiting for another process and it is WerFault.exe too:
0: kd:x86> .effmach AMD64
0: kd> !process fffffa8075c21b30 ff

[...]

THREAD fffffa807c183b60 Cid 2d3c8.4334c Teb: 000000007efdb000 Win32Thread: fffff900c3f71010 WAIT: (UserRequest) UserMode Non-Alertable

fffffa80809c44e0 ProcessObject

[…]
0: kd> !process fffffa80809c44e0

PROCESS fffffa80809c44e0

SessionId: 2  Cid: 33844    Peb: 7efdf000  ParentCid: 2d3c8

DirBase: 9c53f0000  ObjectTable: fffff8a0423d4170  HandleCount: 978.

Image: WerFault.exe

[...]
We go back to our original WerFault process and in its PEB data we find it was called to report a fault from another process with PID 0n189240:
0: kd> !process fffffa8075c21b30 ff

[...]

CommandLine:  'C:\Windows\SysWOW64\WerFault.exe -u -p 189240 -s 3888′

[…]
And it’s WerFault.exe too:
0: kd> !process 0n189240

Searching for Process with Cid == 2e338
PROCESS fffffa8078b659e0

SessionId: 2  Cid: 2e338    Peb: 7efdf000  ParentCid: 47608

DirBase: 201796000  ObjectTable: fffff8a02e664380  HandleCount: 974.

Image: WerFault.exe

[...]
So we see a chain of WerFault.exe processes each processing a fault in the previous one. So there should be a first fault somewhere which we can find in stack trace collection (32-bit stack traces for this example) unless that exception stack trace was paged out due to insufficient memory occupied by WerFault.exe processes.
- Dmitry Vostokov @ DumpAnalysis.org + TraceAnalysis.org -
Posted in Crash Dump Analysis, Crash Dump Patterns, Horrors of Computation, Software Architecture, Victimware, Victimware Analysis | 2 Comments »
Thursday, September 20th, 2012
I was very pleased to find out this book that uses WinDbg as OS reversing tool. Not only you learn a very important aspect of Windows internals related to crash and hang memory dump analysis (all crash processing starts from memory manager) but you also learn many WinDbg commands from practical reversing experiments. I was even more pleased to find the output of WinDbg command on the page 0, before even the table of contents.
What Makes It Page?: The Windows 7 (x64) Virtual Memory Manager

- Dmitry Vostokov @ DumpAnalysis.org + TraceAnalysis.org -
Posted in Books, Crash Dump Analysis, Reverse Engineering, Software Architecture, WinDbg Tips and Tricks, Windows 7, Windows Memory Management, x64 Windows | No Comments »
Monday, July 2nd, 2012
Sometimes I get requests to review application memory dump capture design. Of course, such requests usually come only when such designs don’t work or there are problems with loading saved crash dumps. The common blueprint of such architectures is a top level exception handler that use some API do capture and save process memory state. However, such designs forget why separate processed were introduced in the first place: to guard process memory space of different unrelated tasks (for related tasks there are threads). The data of the module (and its thread state) that does process memory capture may also be corrupt. The right design would be to show a message box with an information on how to use external process memory dumper such as Task Manager. If we need an automation then the right thing is to rely on WER features. Let separate processes do their work in separate spaces.
- Dmitry Vostokov @ DumpAnalysis.org + TraceAnalysis.org -
Posted in Core Dump Analysis, Debugging, Software Architecture, Software Diagnostics, Software Engineering | No Comments »
Sunday, April 15th, 2012
After 4 years in print this bestselling title needs an update to address minor changes, include extra examples and reference additional research published in Volumes 2, 3, 4, 5 and 6.
- Title: Memory Dump Analysis Anthology, Volume 1
- Author: Dmitry Vostokov
- Publisher: OpenTask (Summer 2012)
- Language: English
- Product Dimensions: 22.86 x 15.24
- Paperback: 800 pages
- ISBN-13: 978-1-908043-35-1
- Hardcover: 800 pages
- ISBN-13: 978-1-908043-36-8
The cover for both paperback and hardcover titles will also have a matte finish. We used A Memory Window artwork for the back cover.

- Dmitry Vostokov @ DumpAnalysis.org + TraceAnalysis.org -
Posted in Aesthetics of Memory Dumps, Announcements, AntiPatterns, Art, Assembly Language, Best Practices, Books, Bugchecks Depicted, C and C++, Complete Memory Dump Analysis, Computer Science, Crash Dump Analysis, Crash Dump Patterns, Crash Dumps for Dummies, Debugging, Debugging Methodology, Dr. Watson, Escalation Engineering, Fun with Crash Dumps, GDB for WinDbg Users, Hardware, Images of Computer Memory, Kernel Development, Mathematics of Debugging, Memiotics (Memory Semiotics), Memoretics, Memory Dump Analysis Methodology, Memory Space Art, Memory Space Music, Memory Visualization, Minidump Analysis, Multithreading, Pattern-Driven Debugging, Pattern-Driven Software Support, Publishing, Reference, Root Cause Analysis, Science of Memory Dump Analysis, Software Architecture, Software Behavior DNA, Software Behavior Patterns, Software Behavioral Genome, Software Diagnostics, Software Engineering, Software Technical Support, Stack Trace Collection, Testing, Tools, Troubleshooting Methodology, Vista, WinDbg Scripts, WinDbg Tips and Tricks, WinDbg for GDB Users, Windows 7, Windows Data Structures, Windows Server 2008, Windows System Administration, x64 Windows | No Comments »
Saturday, January 7th, 2012
This is another tracing example of unified debugging patterns introduced previously.
- Analysis Patterns
Focus of Tracing
- Architectural Patterns
Debug Event Subscription / Notification
- Design Patterns
Shared Debug Event State
- Implementation Patterns
Shared Variable
- Usage Patterns
Saving a memory address obtained at a breakpoint event in a debugger pseudo-register for use at later breakpoint events
Debugging.tv published a case study for tracing window messages in WinDbg. There a pseudo-register is used to save a buffer address before GetMessage call and then to reuse it after the call. Please look at Event State Management slide on Frames episode 0×06 presentation. The full WinDbg log and the recording are available there too.
- Dmitry Vostokov @ DumpAnalysis.org + TraceAnalysis.org -
Posted in Debugging, Debugging TV, Software Architecture, Software Behavior Patterns, Software Engineering, Software Trace Analysis, Trace Analysis Patterns, Unified Debugging Patterns, WinDbg Scripts, WinDbg Tips and Tricks | No Comments »
Friday, November 11th, 2011
This is a second long-term initiative for 2012 to design and develop memory-oriented operating system where memory is the foundation of the whole architecture from the ground up. More on this later as the announcement date and time memory pattern 11-11-11 11:11 is quickly approaching 
- Dmitry Vostokov @ DumpAnalysis.org + TraceAnalysis.org -
Posted in Announcements, Computer Science, Memory OS, Software Architecture | 1 Comment »
Wednesday, September 21st, 2011
Memoretics as a science of memory snapshots borrows many ideas from the following disciplines (the list is not exhaustive):
- Troubleshooting and Debugging
- Intelligence Analysis
- Critical Thinking
- Forensics
- Linguistics
- Archaeology
- Psychoanalysis
- History
- Mathematics: Sets and Categories
- Literary Criticism and Narratology
It also contributes many ideas back. The following diagram depicts such an interaction:

- Dmitry Vostokov @ DumpAnalysis.org + TraceAnalysis.org -
Posted in Archaeology of Computer Memory, Categorical Debugging, Computer Forensics, Computer Science, Countefactual Debugging, Crash Dump Analysis, Crash Dump De-analysis, Crash Dump Patterns, Debugging, Debugging Methodology, Dublin School of Security, Education and Research, Escalation Engineering, General Memory Analysis, Generative Debugging, Hermeneutics of Memory Dumps and Traces, History, Intelligence Analysis Patterns, M->analysis, Malware Analysis, Malware Patterns, Mathematics of Debugging, Memiotics (Memory Semiotics), Memoretics, Memory Analysis Forensics and Intelligence, Memory Dump Analysis and History, Memory Systems Language, Memory Visualization, Metadefect Template Library, Metamalware, New Debugging School, Paleo-debugging, Pattern Models, Pattern Prediction, Psychoanalysis of Software Maintenance and Support, Psychology, Reverse Engineering, Root Cause Analysis, Science of Memory Dump Analysis, Science of Software Tracing, Security, Software Architecture, Software Behavior DNA, Software Behavior Patterns, Software Behavioral Genome, Software Chorography, Software Chorology, Software Defect Construction, Software Engineering, Software Narratology, Software Technical Support, Software Trace Analysis, Software Trace Analysis and History, Software Trace Deconstruction, Software Trace Linguistics, Software Trace Reading, Software Trace Visualization, Software Tracing Implementation Patterns, Software Troubleshooting Patterns, Software Victimology, Software and History, Structural Memory Analysis and Social Sciences, Structural Memory Patterns, Structural Trace Patterns, Systems Thinking, Testing, Tools, Trace Analysis Patterns, Troubleshooting Methodology, UI Problem Analysis Patterns, Unified Debugging Patterns, Victimware, Virtualization, Visual Dump Analysis, Workaround Patterns | No Comments »
Sunday, April 17th, 2011
I’m pleased to announce that MDAA, Volume 5 is available in PDF format:
www.dumpanalysis.org/Memory+Dump+Analysis+Anthology+Volume+5
It features:
- 25 new crash dump analysis patterns
- 11 new pattern interaction case studies (including software tracing)
- 16 new trace analysis patterns
- 7 structural memory patterns
- 4 modeling case studies for memory dump analysis patterns
- Discussion of 3 common analysis mistakes
- Malware analysis case study
- Computer independent architecture of crash analysis report service
- Expanded coverage of software narratology
- Metaphysical and theological implications of memory dump worldview
- More pictures of memory space and physicalist art
- Classification of memory visualization tools
- Memory visualization case studies
- Close reading of the stories of Sherlock Holmes: Dr. Watson’s observational patterns
- Fully cross-referenced with Volume 1, Volume 2, Volume 3, and Volume 4
Its table of contents is available here:
www.dumpanalysis.org/MDAA/MDA-Anthology-V5-TOC.pdf
Paperback and hardcover versions should be available in a week or two. I also started working on Volume 6 that should be available in November-December.
- Dmitry Vostokov @ DumpAnalysis.org + TraceAnalysis.org -
Posted in Aesthetics of Memory Dumps, Analysis Notation, Announcements, AntiPatterns, Archaeology of Computer Memory, Art, Assembly Language, Best Practices, Books, C and C++, CDF Analysis Tips and Tricks, Categorical Debugging, Citrix, Common Mistakes, Common Questions, Complete Memory Dump Analysis, Computer Forensics, Computer Science, Crash Analysis Report Environment (CARE), Crash Dump Analysis, Crash Dump De-analysis, Crash Dump Patterns, Crash Dumps for Dummies, Cyber Warfare, Debugging, Debugging Bureau, Debugging Industry, Debugging Methodology, Debugging Slang, Debugging Trends, Deep Down C++, Dr. Watson, Dublin School of Security, Education and Research, Escalation Engineering, Fun with Crash Dumps, Fun with Debugging, Fun with Software Traces, General Memory Analysis, Hermeneutics of Memory Dumps and Traces, Images of Computer Memory, Kernel Development, Malware Analysis, Mathematics of Debugging, Memiotics (Memory Semiotics), Memory Analysis Forensics and Intelligence, Memory Diagrams, Memory Dump Analysis Services, Memory Dumps in Myths, Memory Space Art, Memory Systems Language, Memory Visualization, Memory and Glitches, Metaphysics of Memory Worldview, Multithreading, Music for Debugging, New Acronyms, New Debugging School, New Words, Pattern Models, Philosophy, Physicalist Art, Publishing, Reverse Engineering, Science of Memory Dump Analysis, Science of Software Tracing, Security, Software Architecture, Software Behavior Patterns, Software Chorography, Software Chorology, Software Defect Construction, Software Engineering, Software Generalist, Software Maintenance Institute, Software Narratology, Software Technical Support, Software Trace Analysis, Software Trace Reading, Software Trace Visualization, Software Tracing for Dummies, Software Troubleshooting Patterns, Software Victimology, Structural Memory Patterns, Structural Trace Patterns, Systems Thinking, Testing, The Way of Philip Marlowe, Tools, Trace Analysis Patterns, Training and Seminars, Troubleshooting Methodology, Victimware, Vista, Webinars, WinDbg Scripting Extensions, WinDbg Scripts, WinDbg Tips and Tricks, WinDbg for GDB Users, Windows 7, Windows Server 2008, Windows System Administration, Workaround Patterns, x64 Windows | No Comments »
Saturday, March 26th, 2011
The presentation materials from the webinar (25th of March, 2011) are available for download:
http://www.dumpanalysis.com/PDSPSI-materials
Thanks to everyone who registered and attended!
- Dmitry Vostokov @ DumpAnalysis.org + TraceAnalysis.org -
Posted in Announcements, Crash Dump Analysis, Crash Dump Patterns, DebugWare Patterns, Debugging, Debugging Methodology, Escalation Engineering, Mac Crash Corner, Malware Analysis, Malware Patterns, Memory Analysis Forensics and Intelligence, Software Architecture, Software Behavior Patterns, Software Engineering, Software Technical Support, Software Trace Analysis, Software Tracing Implementation Patterns, Software Troubleshooting Patterns, Structural Memory Patterns, Structural Trace Patterns, Tools, Trace Analysis Patterns, Training and Seminars, Troubleshooting Methodology, Unified Debugging Patterns, Webinars, Workaround Patterns | No Comments »
Thursday, March 10th, 2011
The last common mistake in this set is when an engineer doesn’t compare stack traces or other debugger output to normal reference stack traces. For example, a 3rd party service was hanging on a W2K8 server and a user memory dump was saved for offline analysis. The following thread was identified as blocked waiting for a response:
STACK_TEXT:

0041f1bc 75a30816 ntdll_77e50000!ZwWaitForSingleObject+0x15

0041f228 76671184 KERNELBASE!WaitForSingleObjectEx+0x98

0041f240 76671138 kernel32!WaitForSingleObjectExImplementation+0x75

0041f254 75b17be6 kernel32!WaitForSingleObject+0x12

0041f2f8 75b18040 sechost!ScSendResponseReceiveControls+0xea

0041f3ac 75b18662 sechost!ScDispatcherLoop+0xc2

0041f3ec 01271bb4 sechost!StartServiceCtrlDispatcherW+0xb0

0041fa7c 01271dd6 ServiceA!WinMain+0×254

0041fb0c 76673677 ServiceA!__tmainCRTStartup+0×160

0041fb18 77e89d42 kernel32!BaseThreadInitThunk+0xe

0041fb58 77e89d15 ntdll_77e50000!__RtlUserThreadStart+0×70

0041fb70 00000000 ntdll_77e50000!_RtlUserThreadStart+0×1b
Unfortunately, this thread wasn’t recognized as a normal main service thread. Typical Internet search for ScSendResponseReceiveControls function points to a sample analysis log where we can find such thread stacks in the variety of other standard services:
THREAD fffffa8005362060  Cid 0a1c.0b68  Teb: 000007fffffde000 Win32Thread: 0000000000000000 WAIT: (UserRequest) UserMode Non-Alertable

    fffffa8004dc0a60  SynchronizationEvent

Not impersonating

DeviceMap                 fffff8a000008c10

Owning Process            fffffa800540e060       Image:         svchost.exe

Attached Process          N/A            Image:         N/A

Wait Start TickCount      37051          Ticks: 3239 (0:00:00:50.528)

Context Switch Count      13

UserTime                  00:00:00.000

KernelTime                00:00:00.000

Win32 Start Address svchost!wmainCRTStartup (0x00000000ffa9246c)

Stack Init fffff88005abbdb0 Current fffff88005abb900

Base fffff88005abc000 Limit fffff88005ab6000 Call 0

Priority 9 BasePriority 8 UnusualBoost 0 ForegroundBoost 0 IoPriority 2 PagePriority 5

Child-SP          RetAddr           Call Site

fffff880`05abb940 fffff800`01a93992 nt!KiSwapContext+0x7a

fffff880`05abba80 fffff800`01a95cff nt!KiCommitThreadWait+0x1d2

fffff880`05abbb10 fffff800`01d871d2 nt!KeWaitForSingleObject+0x19f

fffff880`05abbbb0 fffff800`01a8b993 nt!NtWaitForSingleObject+0xb2

fffff880`05abbc20 00000000`7781fefa nt!KiSystemServiceCopyEnd+0x13 (TrapFrame @ fffff880`05abbc20)

00000000`001ffab8 000007fe`fda910ac ntdll!NtWaitForSingleObject+0xa

00000000`001ffac0 000007fe`ff4eaffb KERNELBASE!WaitForSingleObjectEx+0x79

00000000`001ffb60 000007fe`ff4e9d61 sechost!ScSendResponseReceiveControls+0×13b

00000000`001ffc50 000007fe`ff4e9c16 sechost!ScDispatcherLoop+0×121

00000000`001ffd60 00000000`ffa91d3a sechost!StartServiceCtrlDispatcherW+0×14e

00000000`001ffdb0 00000000`ffa9257a svchost!wmain+0×110

00000000`001ffde0 00000000`776cf56d svchost!ScCreateWellKnownSids+0×2fd

00000000`001ffe20 00000000`77803281 kernel32!BaseThreadInitThunk+0xd

00000000`001ffe50 00000000`00000000 ntdll!RtlUserThreadStart+0×1d
Also, studying OS architecture and deliberate practice in memory dump analysis helps in recognition of problem and normal structural and behavioral patterns.
- Dmitry Vostokov @ DumpAnalysis.org + TraceAnalysis.org -
Posted in Common Mistakes, Crash Dump Analysis, Debugging, Software Architecture, Stack Trace Collection, Windows Server 2008 | No Comments »
Monday, March 7th, 2011
In certain software behavior scenarios such as a memory leak when we see top modules calling OS API functions we might suspect them having defects. However, this might not be the case and these modules were used from Directing Module keeping references or handles preventing top modules from freeing memory or releasing resources.
For example, a memory dump from a process had 2 growing heap segments and one of them had this recurrent stack trace saved in a user mode stack trace database:
38D2CE78: 02ba8 . 02ba8 [07] - busy (2b90), tail fill

Stack trace (38101) at 83e390:

7d6568be: ntdll!RtlAllocateHeapSlowly+0×00000041

7d62b846: ntdll!RtlAllocateHeap+0×00000E9F

337d0572: ModuleA!XHeapAlloc+0×00000115

[…]

338809e2: ModuleA!Execute+0×000002CD

488b3fc1: ModuleB!Execute+0×000000D3

679b8c64: ModuleC!ExecuteByHandle+0×00000074

[…]

67d241cb: ModuleD!Query+0×0000016B

67ba2ed4: ModuleE!Browse+0×000000E4

[…]

667122c6: ModuleF!Check+0×00000126

65e73826: ModuleG!Enum+0×00000406

[…]
Initially we suspected ModuleA but found a different recurrent stack trace corresponding to another growing segment:
40C81688: 000c8 . 00058 [07] - busy (40), tail fill

Stack trace (38136) at 83f6a4:

7d6568be: ntdll!RtlAllocateHeapSlowly+0×00000041

7d62b846: ntdll!RtlAllocateHeap+0×00000E9F

7c3416b3: msvcr71!_heap_alloc+0×000000E0

7c3416db: msvcr71!_nh_malloc+0×00000010

67745875: ModuleX!BufAllocate+0×00000015

6775085e: ModuleY!QueryAttribute+0×0000008E

[…]

677502b5: ModuleY!Query+0×00000015

67ba2f19: ModuleE!Browser+0×00000129

[…]

667122c6: ModuleF!Check+0×00000126

65e73826: ModuleG!Enum+0×00000406

[…]
From the common stack trace fragment (highlighted in blue) we transferred our investigation to ModuleE and indeed the similar software incident (as the latter trace) was found in our troubleshooting database.
- Dmitry Vostokov @ DumpAnalysis.org + TraceAnalysis.org -
Posted in Crash Dump Analysis, Crash Dump Patterns, Debugging, Software Architecture | No Comments »
Wednesday, December 29th, 2010
In these post series we are going to discuss the best practices for software tracing implementation including appropriate patterns and their links to software trace analysis patterns. The first one is called Period Timestamp where the start and the end time (and the date if necessary) are recorded in the trace file. This helps in Inter-Correlation and News Value analysis between several different trace types. For example, in one scenario, we had WindowHistory and MessageHistory logs. We identified a problem in the former log as happening at this time:
Handle: 00010196 Class: "ClassA" Title: "TitleA"

   Captured at: 13:36:30:533

[…]
However, when we looked at the latter trace to search for specific window messages posted or sent before that time we saw that the recording started later than the former event:
Start time: 13:36:35:830
Period timestamps are necessary to distinguish Incomplete History from Truncated Trace where in the former case the absence of expected trace message is due to some problem.
From a unified debugging patterns perspective we have this sequence fragment:
Implementation Patterns: Period Timestamp
Usage Patterns: Trace Simultaneously
- Dmitry Vostokov @ DumpAnalysis.org + TraceAnalysis.org -
Posted in Best Practices, Debugging, Debugging Methodology, Software Architecture, Software Engineering, Software Narratology, Software Technical Support, Software Trace Analysis, Software Trace Reading, Software Tracing Implementation Patterns, Trace Analysis Patterns, Troubleshooting Methodology, Unified Debugging Patterns | No Comments »
Friday, December 17th, 2010
As the new decade is approaching (2011-2020) we would like to make a few previews and predictions:
- Increased complexity of software will bring more methods from biological, social sciences and humanities in addition to existing methods of automated debugging and computer science techniques
- Focus on first fault software problem solving (when aspect)
- Focus on pattern-driven software problem solving (how aspect)
- Fusion of debugging and malware analysis into a unified structural and behavioral pattern framework
- Visual debugging, memory and software trace visualization techniques
- Software maintenance certification
- Focus on domain-driven troubleshooting and debugging tools as a service (debugware TaaS)
- Focus on security issues related to memory dumps and software traces
- New scripting languages and programming language extensions for debugging
- The maturation of the science of memory snapshots and software traces (memoretics)
Imagining is not not limited to the above and more to come and explain in the forthcoming parts.
- Dmitry Vostokov @ DumpAnalysis.org + TraceAnalysis.org -
Posted in Announcements, Anthropology, Archaeology of Computer Memory, Biology, Certification, Computer Science, Countefactual Debugging, Crash Analysis Report Environment (CARE), Crash Dump Analysis, Crash Dump Patterns, DebugWare Patterns, Debugging, Debugging Industry, Debugging Methodology, Debugging Trends, Dublin School of Security, EasyDbg, Economics, Escalation Engineering, Evolution, First Fault Problem Solving, Futuristic Memory Dump Analysis, General Memory Analysis, General Science, Geography, Hardware, Hermeneutics of Memory Dumps and Traces, History, Humanities, Language, Laws of Troubleshooting and Debugging, Logic, Malware Analysis, Malware Patterns, Mathematics of Debugging, Memiotics (Memory Semiotics), Memoretics, Memory Analysis Forensics and Intelligence, Memory Analysis Report System, Memory Dump Analysis and History, Memory Systems Language, Memory Visualization, Paleo-debugging, Pattern Models, Pattern Prediction, Physics, Psychology, Publishing, Science of Memory Dump Analysis, Science of Software Tracing, Security, Social Media, Social Sciences, Software Architecture, Software Behavior Patterns, Software Chorography, Software Chorology, Software Defect Construction, Software Engineering, Software Generalist, Software Maintenance Institute, Software Narrative Fiction, Software Narratology, Software Technical Support, Software Trace Analysis, Software Trace Analysis and History, Software Trace Deconstruction, Software Trace Linguistics, Software Trace Visualization, Software Troubleshooting Patterns, Software Victimology, Statistics, Structural Memory Analysis and Social Sciences, Structural Memory Patterns, Structural Trace Patterns, Systems Thinking, Testing, Tools, Trace Analysis Patterns, Troubleshooting Methodology, Unified Debugging Patterns, Uses of UML, Victimware, Virtualization, Visual Dump Analysis, Windows System Administration, Workaround Patterns | No Comments »
Friday, December 3rd, 2010
We now start unifying software behavior analysis patterns with debugging architecture, design, implementation and usage. This is analogous to software construction where a problem analysis leads to various software engineering phases. The important difference here is the addition of debugging usage patterns. Let’s look at an example (we discuss suggested patterns later):
- Analysis Patterns
Shared Buffer Overwrite
- Architectural Patterns
Debug Event Subscription / Notification
- Design Patterns
Punctuated Execution
- Implementation Patterns
Breakpoint (software and hardware)
- Usage Patterns
Kernel vs. user space breakpoints
To differentiate this systematic approach from the various published ad hoc debugging patterns we call it Unified Debugging Pattern Language. ADI parts can also correspond to various DebugWare patterns where we provide a mapping later.
- Dmitry Vostokov @ DumpAnalysis.org + TraceAnalysis.org -
Posted in Crash Dump Analysis, Crash Dump Patterns, DebugWare Patterns, Debugging, Software Architecture, Software Behavior Patterns, Software Engineering, Software Trace Analysis, Trace Analysis Patterns, Unified Debugging Patterns | No Comments »
Thursday, November 25th, 2010
Our next pattern is called System Description Snapshot. The tool or component compiles the list of system properties and collections, like hardware resources, selected file names from file systems, registry and other configuration information. Two or several snapshots can be compared either visually or automatically to highlight state differences that help in troubleshooting, debugging and problem resolution.
- Dmitry Vostokov @ DumpAnalysis.org + TraceAnalysis.org -
Posted in DebugWare Patterns, Debugging, Escalation Engineering, Software Architecture, Software Engineering, Software Technical Support, Tools | No Comments »
Friday, November 12th, 2010
Five volumes of cross-disciplinary Anthology (dubbed by the author “The Summa Memorianica”) lay the foundation of the scientific discipline of Memoretics (study of computer memory snapshots and their evolution in time) that is also called Memory Dump and Software Trace Analysis.ca
The 5th volume contains revised, edited, cross-referenced, and thematically organized selected DumpAnalysis.org blog posts about crash dump, software trace analysis and debugging written in February 2010 - October 2010 for software engineers developing and maintaining products on Windows platforms, quality assurance engineers testing software on Windows platforms, technical support and escalation engineers dealing with complex software issues, and security researchers, malware analysts and reverse engineers. The fifth volume features:
- 25 new crash dump analysis patterns
- 11 new pattern interaction case studies (including software tracing)
- 16 new trace analysis patterns
- 7 structural memory patterns
- 4 modeling case studies for memory dump analysis patterns
- Discussion of 3 common analysis mistakes
- Malware analysis case study
- Computer independent architecture of crash analysis report service
- Expanded coverage of software narratology
- Metaphysical and theological implications of memory dump worldview
- More pictures of memory space and physicalist art
- Classification of memory visualization tools
- Memory visualization case studies
- Close reading of the stories of Sherlock Holmes: Dr. Watson’s observational patterns
- Fully cross-referenced with Volume 1, Volume 2, Volume 3, and Volume 4
Product information:
- Title: Memory Dump Analysis Anthology, Volume 5
- Author: Dmitry Vostokov
- Language: English
- Product Dimensions: 22.86 x 15.24
- Paperback: 400 pages
- Publisher: Opentask (10 December 2010)
- ISBN-13: 978-1-906717-96-4
- Hardcover: 400 pages
- Publisher: Opentask (10 December 2010)
- ISBN-13: 978-1-906717-97-1

Back cover features memory space art image Hot Computation: Memory on Fire.
- Dmitry Vostokov @ DumpAnalysis.org + TraceAnalysis.org -
Posted in Aesthetics of Memory Dumps, Announcements, Archaeology of Computer Memory, Art, Assembly Language, Books, C and C++, CDF Analysis Tips and Tricks, Categorical Debugging, Common Mistakes, Complete Memory Dump Analysis, Computer Science, Crash Analysis Report Environment (CARE), Crash Dump Analysis, Crash Dump De-analysis, Crash Dump Patterns, Debugging, Debugging Methodology, Debugging Slang, Deep Down C++, Dr. Watson, Dublin School of Security, Education and Research, Escalation Engineering, Fun with Crash Dumps, Fun with Debugging, Fun with Software Traces, General Memory Analysis, Hermeneutics of Memory Dumps and Traces, Images of Computer Memory, Kernel Development, Malware Analysis, Malware Patterns, Mathematics of Debugging, Memiotics (Memory Semiotics), Memoidealism, Memoretics, Memory Analysis Culture, Memory Analysis Forensics and Intelligence, Memory Analysis Report System, Memory Diagrams, Memory Dreams, Memory Dump Analysis Jobs, Memory Dump Analysis Services, Memory Dump Analysis and History, Memory Dumps in Movies, Memory Dumps in Myths, Memory Religion (Memorianity), Memory Space Art, Memory Systems Language, Memory Visualization, Memory and Glitches, Memuonics, Metaphysical Society of Ireland, Minidump Analysis, Movies and Debugging, Multithreading, Museum of Debugging, Music for Debugging, Music of Computation, New Acronyms, New Words, Paleo-debugging, Pattern Models, Pattern Prediction, Philosophy, Physicalist Art, Psychoanalysis of Software Maintenance and Support, Publishing, Science of Memory Dump Analysis, Science of Software Tracing, Security, Software Architecture, Software Behavior Patterns, Software Chorography, Software Chorology, Software Defect Construction, Software Engineering, Software Generalist, Software Maintenance Institute, Software Narratology, Software Technical Support, Software Trace Analysis, Software Trace Analysis and History, Software Trace Deconstruction, Software Trace Reading, Software Trace Visualization, Software Tracing for Dummies, Software Troubleshooting Patterns, Software Victimology, Stack Trace Collection, Structural Memory Analysis and Social Sciences, Structural Memory Patterns, Structural Trace Patterns, Systems Thinking, Testing, Theology, Tool Objects, Tools, Trace Analysis Patterns, Training and Seminars, Troubleshooting Methodology, Uses of UML, Victimware, Virtualization, Vista, Visual Dump Analysis, Webinars, WinDbg Scripts, WinDbg Tips and Tricks, WinDbg for GDB Users, Windows 7, Windows Server 2008, Windows System Administration, Workaround Patterns, x64 Windows | No Comments »
Saturday, November 6th, 2010
I’m pleased to announce that MDAA, Volume 4 is available in PDF format:
www.dumpanalysis.org/Memory+Dump+Analysis+Anthology+Volume+4
It features:
- 15 new crash dump analysis patterns
- 13 new pattern interaction case studies
- 10 new trace analysis patterns
- 6 new Debugware patterns and case study
- Workaround patterns
- Updated checklist
- Fully cross-referenced with Volume 1, Volume 2 and Volume 3
- Memory visualization tutorials
- Memory space art
Its table of contents is available here:
http://www.dumpanalysis.org/MDAA/MDA-Anthology-V4-TOC.pdf
Paperback and hardcover versions should be available in a week or two. I also started working on Volume 5 that should be available in December.
- Dmitry Vostokov @ DumpAnalysis.org + TraceAnalysis.org -
Posted in .NET Debugging, Aesthetics of Memory Dumps, Announcements, AntiPatterns, Art, Assembly Language, Books, C and C++, CDF Analysis Tips and Tricks, Categorical Debugging, Common Mistakes, Complete Memory Dump Analysis, Computer Science, Countefactual Debugging, Crash Dump Analysis, Crash Dump Patterns, DebugWare Patterns, Debugging, Debugging Slang, Deep Down C++, Education and Research, Escalation Engineering, Fun with Crash Dumps, Fun with Debugging, Images of Computer Memory, Kernel Development, Memiotics (Memory Semiotics), Memoidealism, Memoretics, Memory Space Art, Memory Visualization, Memuonics, Metaphysics of Memory Worldview, Multithreading, Opcodism, Philosophy, Physicalist Art, Publishing, Science Fiction, Science of Memory Dump Analysis, Science of Software Tracing, Security, Software Architecture, Software Behavior Patterns, Software Defect Construction, Software Engineering, Software Narratology, Software Technical Support, Software Trace Analysis, Software Trace Reading, Software Victimology, Stack Trace Collection, Testing, Tools, Trace Analysis Patterns, Troubleshooting Methodology, Uses of UML, Victimware, Virtualization, Vista, Visual Dump Analysis, WinDbg Scripts, WinDbg Tips and Tricks, Windows 7, Windows Server 2008, Windows System Administration, Workaround Patterns, x64 Windows | No Comments »