Archive for the ‘Software Diagnostics Patterns’ Category
Wednesday, October 10th, 2012
The case of an error reporting fault chain led me to First Fault Stack Trace memory dump analysis pattern that corresponds to First Fault software diagnostics pattern proper. Here the term first fault is used for an exception that was either ignored by surrounding code or led to other exceptions or error message boxes with stack traces that masked the first one. Typical examples where it is sometimes possible to get a first exception stack trace include but not limited to:
It is also sometimes possible unless a stack region was paged out to get partial stack traces from execution residue when the sequence of return addresses was partially overwritten by subsequently executed code.
- Dmitry Vostokov @ DumpAnalysis.org + TraceAnalysis.org -
Posted in .NET Debugging, Crash Dump Analysis, Crash Dump Patterns, Debugging, First Fault Software Diagnostics, Software Diagnostics, Software Diagnostics Patterns, Software Trace Analysis, Trace Analysis Patterns | No Comments »
Tuesday, October 2nd, 2012
These are important meta-patterns of monitoring and software problem analysis reports. It is often the case that we have software artifacts and some problem description and we need to provide recommendations on further troubleshooting. Most of the time such an analysis and associated response fit into abstract schemes where we can just substitute variables for concrete states, actions, artifacts and behavioral descriptions. Sometimes we also have difficulty to write such analysis reports so we hope report schemes is of help here to provide organizing templates for thought process. The first such scheme we call Missing Cause Trace:
- If Action then Behavior
- We have a trace of Behavior
- We need a trace of Action and Behavior
The difference with Truncated Trace pattern here is that in a truncated trace it was intended to trace certain behaviour but the tracing session was stopped prematurely or started too late. In a missing cause trace only a part of necessary activity was traced and the missing part wasn’t thought of or considered for tracing.
- Dmitry Vostokov @ DumpAnalysis.org + TraceAnalysis.org -
Posted in Debugging, Escalation Engineering, Software Diagnostics, Software Diagnostics Pattern Language, Software Diagnostics Patterns, Software Diagnostics Report Schemes, Software Technical Support, Software Trace Analysis, Trace Analysis Patterns | No Comments »
Sunday, September 23rd, 2012
Learn from this Webinar about phenomenological, hermeneutical and analytical approaches to software diagnostics and its knowledge, foundations, norms, theories, logic, methodology, language, ontology, nature and truth. This seminar is hosted by Software Diagnostics Services.

Title: Introduction to Philosophy of Software Diagnostics
Date: 17th of December, 2012
Time: 19:00 GMT
Duration: 60 minutes
Space is limited.
Reserve your Webinar seat now at:
https://www3.gotomeeting.com/register/872846486
- Dmitry Vostokov @ DumpAnalysis.org + TraceAnalysis.org -
Posted in Announcements, Computer Science, Core Dump Analysis, Crash Dump Analysis, Crash Dump Patterns, Debugging, Debugging Methodology, Education and Research, Escalation Engineering, First Fault Software Diagnostics, Hermeneutics of Memory Dumps and Traces, Logic, Memiotics (Memory Semiotics), Memoretics, Memory Dump Analysis Methodology, Performance Monitoring, Phenomenology of Software Diagnostics, Philosophy, Philosophy of Software Diagnostics, Root Cause Analysis, Science of Memory Dump Analysis, Science of Software Tracing, Semiotics, Software Behavior Patterns, Software Diagnostics, Software Diagnostics Institute, Software Diagnostics Pattern Language, Software Diagnostics Patterns, Software Diagnostics Services, Software and Philosophy, Systems Theory, Systems Thinking, Testing, The Way of Philip Marlowe, Trace Analysis Patterns, Unified Software Diagnostics, Webinars | No Comments »
Thursday, July 19th, 2012
After some thinking I’ve decided to apply software trace analysis pattern approach to network trace analysis which lacks a unified pattern language. Here I consider a network trace as essentially a software trace where packet headers represent software trace messages coupled with associated transmitted data:
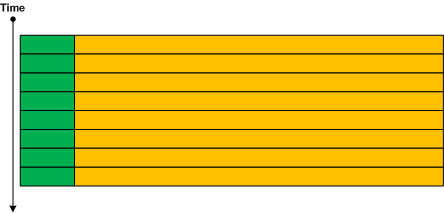
Since we have a trace message stream formatted by a network trace visualization tool we can apply most if not all trace analysis patterns for diagnostics including software narratology for interpretation, discourse and different representations. We provide a few trivial examples here and more in subsequent parts. The first example is Discontinuity pattern:
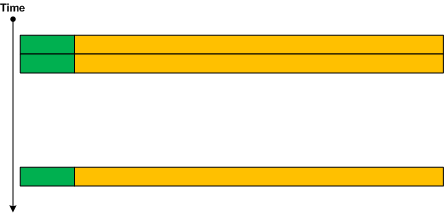
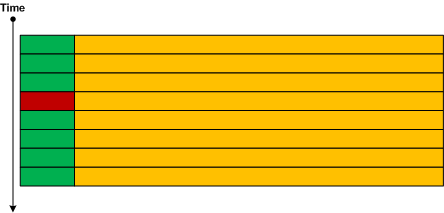
Other similar patterns are No Activity, Truncated Trace and Time Delta. The second example is Anchor Messages:
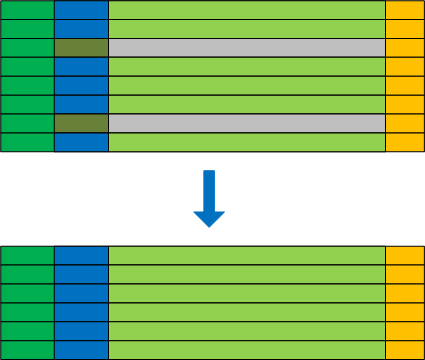
Additional example there include Significant Event and Bifurcation Point patterns. Layered protocols are represented through Embedded Message pattern (to be described and added to the pattern list soon). Such traces can be filtered for their embedded protocol headers and therefore naturally represent Adjoint Thread pattern (for the more detailed description of adjoint threads as extension of multithreading please see the article What is an Adjoint Thread):
 - Dmitry Vostokov @ DumpAnalysis.org + TraceAnalysis.org -
Posted in Network Trace Analysis Patterns, Software Behavior Patterns, Software Diagnostics, Software Diagnostics Pattern Language, Software Diagnostics Patterns, Software Narratology, Software Trace Analysis | No Comments »
Sunday, June 24th, 2012
This is a second Webinar from Memory Dump Analysis Services on software diagnostics. The first one is about pattern recognition. During this Webinar you will learn how to apply systems theory and systems thinking for effective and efficient abnormal software behavior diagnostics: the foundation of software troubleshooting and debugging. The seminar summarizes 6 years of research done by Software Diagnostics Institute started with a short blog post Dumps and Systems Theory.

Title: Introduction to Systemic Software Diagnostics: Systems Thinking in Memory Dump and Software Trace Analysis
Date: 3rd of September, 2012
Time: 17:00 (BST) 12:00 (EST) 09:00 (PST)
Duration: 60 minutes
Space is limited.
Reserve your Webinar seat now at:
https://www3.gotomeeting.com/register/377382766
- Dmitry Vostokov @ DumpAnalysis.org + TraceAnalysis.org -
Posted in Announcements, Memory Dump Analysis Services, Software Diagnostics, Software Diagnostics Institute, Software Diagnostics Patterns, Software Engineering, Software Technical Support, Systems Thinking, Training and Seminars, Unified Software Diagnostics, Webinars | No Comments »
Monday, June 18th, 2012
Posted in Announcements, Certification, Core Dump Analysis, Crash Dump Analysis, Crash Dump Patterns, Debugging, Software Diagnostics, Software Diagnostics Institute, Software Diagnostics Patterns, Software Engineering, Software Technical Support, Software Trace Analysis, Trace Analysis Patterns | No Comments »
Tuesday, June 12th, 2012
DumpAnalysis.org portal has been reorganized to Software Diagnostics Institute to reflect the nature of its research activities. More updates later on.
- Dmitry Vostokov @ DumpAnalysis.org + TraceAnalysis.org -
Posted in Announcements, Core Dump Analysis, Crash Dump Analysis, Crash Dump Patterns, Debugging, Software Behavior Patterns, Software Diagnostics, Software Diagnostics Institute, Software Diagnostics Patterns, Software Engineering, Software Trace Analysis, Trace Analysis Patterns | No Comments »
Saturday, June 9th, 2012
While preparing a seminar on Software Diagnostics I made a lot of notes and realized that a system of patterns, corresponding vocabulary and pattern language are needed for this discipline. Here patterns are supposed to be broad in nature and be different from patterns for specific artifacts such as memory dumps and software traces. So the first pattern addresses a diagnostic encounter with a First Fault in comparison to subsequent faults where the problem becomes noticeable and diagnostic resources are allocated. Such faults should not be dismissed. Dan Skwire is a passionate advocate of first fault software problem solving and wrote a book:
First Fault Software Problem Solving: A Guide for Engineers, Managers and Users
The following paper proposes distributed control flow reconstruction for first fault diagnosis:
TraceBack: First Fault Diagnosis by Reconstruction of Distributed Control Flow
Memory Dump Analysis Services uses patterns of abnormal software behavior for its first fault diagnostics that doesn’t require any special instrumentation:
Join Debugging Diagnostics Revolution!
- Dmitry Vostokov @ DumpAnalysis.org + TraceAnalysis.org -
Posted in First Fault Problem Solving, Software Behavior Patterns, Software Diagnostics, Software Diagnostics Patterns, Software Technical Support, Unified Software Diagnostics | No Comments »