Archive for the ‘Memory Dump Analysis Jobs’ Category
Tuesday, April 26th, 2011
Jobs page on Memory Dump, Software Trace, Debugging and Malware Analysis Portal now accepts company job ads related to security research, computer forensics, reverse engineering, and malware analysis in addition to debugging, software defect research, crash / core / memory dump and software trace analysis.
http://www.dumpanalysis.org/jobs
- Dmitry Vostokov @ DumpAnalysis.org + TraceAnalysis.org -
Posted in Announcements, Computer Forensics, Cyber Warfare, Malware Analysis, Memory Dump Analysis Jobs, Reverse Engineering, Security | No Comments »
Monday, February 14th, 2011
My recent desire is to have the ultimate human debugger’s desk: monitors joined together around me to have 360-degree memory surveillance. I haven’t yet been talking about spherical coordinate system for memory analysis, only cylindrical one. Any sponsor? 
Source: 360-Degree Memory Analysis
- Dmitry Vostokov @ DumpAnalysis.org + TraceAnalysis.org -
Posted in Crash Dump Analysis, Debugging, Debugging Environment, Memory Analysis Forensics and Intelligence, Memory Dump Analysis Jobs | No Comments »
Friday, November 12th, 2010
Five volumes of cross-disciplinary Anthology (dubbed by the author “The Summa Memorianica”) lay the foundation of the scientific discipline of Memoretics (study of computer memory snapshots and their evolution in time) that is also called Memory Dump and Software Trace Analysis.ca
The 5th volume contains revised, edited, cross-referenced, and thematically organized selected DumpAnalysis.org blog posts about crash dump, software trace analysis and debugging written in February 2010 - October 2010 for software engineers developing and maintaining products on Windows platforms, quality assurance engineers testing software on Windows platforms, technical support and escalation engineers dealing with complex software issues, and security researchers, malware analysts and reverse engineers. The fifth volume features:
- 25 new crash dump analysis patterns
- 11 new pattern interaction case studies (including software tracing)
- 16 new trace analysis patterns
- 7 structural memory patterns
- 4 modeling case studies for memory dump analysis patterns
- Discussion of 3 common analysis mistakes
- Malware analysis case study
- Computer independent architecture of crash analysis report service
- Expanded coverage of software narratology
- Metaphysical and theological implications of memory dump worldview
- More pictures of memory space and physicalist art
- Classification of memory visualization tools
- Memory visualization case studies
- Close reading of the stories of Sherlock Holmes: Dr. Watson’s observational patterns
- Fully cross-referenced with Volume 1, Volume 2, Volume 3, and Volume 4
Product information:
- Title: Memory Dump Analysis Anthology, Volume 5
- Author: Dmitry Vostokov
- Language: English
- Product Dimensions: 22.86 x 15.24
- Paperback: 400 pages
- Publisher: Opentask (10 December 2010)
- ISBN-13: 978-1-906717-96-4
- Hardcover: 400 pages
- Publisher: Opentask (10 December 2010)
- ISBN-13: 978-1-906717-97-1

Back cover features memory space art image Hot Computation: Memory on Fire.
- Dmitry Vostokov @ DumpAnalysis.org + TraceAnalysis.org -
Posted in Aesthetics of Memory Dumps, Announcements, Archaeology of Computer Memory, Art, Assembly Language, Books, C and C++, CDF Analysis Tips and Tricks, Categorical Debugging, Common Mistakes, Complete Memory Dump Analysis, Computer Science, Crash Analysis Report Environment (CARE), Crash Dump Analysis, Crash Dump De-analysis, Crash Dump Patterns, Debugging, Debugging Methodology, Debugging Slang, Deep Down C++, Dr. Watson, Dublin School of Security, Education and Research, Escalation Engineering, Fun with Crash Dumps, Fun with Debugging, Fun with Software Traces, General Memory Analysis, Hermeneutics of Memory Dumps and Traces, Images of Computer Memory, Kernel Development, Malware Analysis, Malware Patterns, Mathematics of Debugging, Memiotics (Memory Semiotics), Memoidealism, Memoretics, Memory Analysis Culture, Memory Analysis Forensics and Intelligence, Memory Analysis Report System, Memory Diagrams, Memory Dreams, Memory Dump Analysis Jobs, Memory Dump Analysis Services, Memory Dump Analysis and History, Memory Dumps in Movies, Memory Dumps in Myths, Memory Religion (Memorianity), Memory Space Art, Memory Systems Language, Memory Visualization, Memory and Glitches, Memuonics, Metaphysical Society of Ireland, Minidump Analysis, Movies and Debugging, Multithreading, Museum of Debugging, Music for Debugging, Music of Computation, New Acronyms, New Words, Paleo-debugging, Pattern Models, Pattern Prediction, Philosophy, Physicalist Art, Psychoanalysis of Software Maintenance and Support, Publishing, Science of Memory Dump Analysis, Science of Software Tracing, Security, Software Architecture, Software Behavior Patterns, Software Chorography, Software Chorology, Software Defect Construction, Software Engineering, Software Generalist, Software Maintenance Institute, Software Narratology, Software Technical Support, Software Trace Analysis, Software Trace Analysis and History, Software Trace Deconstruction, Software Trace Reading, Software Trace Visualization, Software Tracing for Dummies, Software Troubleshooting Patterns, Software Victimology, Stack Trace Collection, Structural Memory Analysis and Social Sciences, Structural Memory Patterns, Structural Trace Patterns, Systems Thinking, Testing, Theology, Tool Objects, Tools, Trace Analysis Patterns, Training and Seminars, Troubleshooting Methodology, Uses of UML, Victimware, Virtualization, Vista, Visual Dump Analysis, Webinars, WinDbg Scripts, WinDbg Tips and Tricks, WinDbg for GDB Users, Windows 7, Windows Server 2008, Windows System Administration, Workaround Patterns, x64 Windows | No Comments »
Sunday, April 18th, 2010
OpenTask to offer first 3 volumes of Memory Dump Analysis Anthology in one set:


The set is available exclusively from OpenTask e-Commerce web site starting from June. Individual volumes are also available from Amazon, Barnes & Noble and other bookstores worldwide.
Product information:
- Title: Modern Memory Dump and Software Trace Analysis: Volumes 1-3
- Author: Dmitry Vostokov
- Language: English
- Product Dimensions: 22.86 x 15.24
- Paperback: 1600 pages
- Publisher: Opentask (31 May 2010)
- ISBN-13: 978-1-906717-99-5
Information about individual volumes:
- Dmitry Vostokov @ DumpAnalysis.org + TraceAnalysis.org -
Posted in .NET Debugging, Aesthetics of Memory Dumps, Announcements, AntiPatterns, Art, Assembly Language, Books, Bugchecks Depicted, C and C++, CDA Pattern Classification, CDF Analysis Tips and Tricks, Categorical Debugging, Certification, Citrix, Code Reading, Common Mistakes, Computational Ghosts and Bug Hauntings, Computer Science, Countefactual Debugging, Crash Analysis Report Environment (CARE), Crash Dump Analysis, Crash Dump Patterns, Crash Dumps for Dummies, Data Recovery, DebugWare Patterns, Debugging, Debugging Methodology, Debugging Slang, Deep Down C++, Dictionary of Debugging, Dr. Watson, Education and Research, Escalation Engineering, Fun with Crash Dumps, Futuristic Memory Dump Analysis, GDB for WinDbg Users, Hardware, History, Horrors of Computation, Hyper-V, Intelligent Memory Movement, Kernel Development, Laws of Troubleshooting and Debugging, Mathematics of Debugging, Memiotics (Memory Semiotics), Memoidealism, Memoretics, Memory Analysis Culture, Memory Analysis Forensics and Intelligence, Memory Auralization, Memory Dump Analysis Jobs, Memory Religion (Memorianity), Memory Space Art, Memory Space Music, Memory Systems Language, Memory Visualization, Memuonics, Minidump Analysis, Multithreading, Music for Debugging, Music of Computation, New Acronyms, New Words, Occult Debugging, Philosophy, Psi-computation, Publishing, Science of Memory Dump Analysis, Science of Software Tracing, Security, Software Architecture, Software Defect Construction, Software Engineering, Software Generalist, Software Maintenance Institute, Software Narratology, Software Technical Support, Software Trace Analysis, Software Trace Visualization, Software Tracing for Dummies, Software Victimology, Stack Trace Collection, Testing, Tools, Trace Analysis Patterns, Training and Seminars, Troubleshooting Methodology, Victimware, Virtualization, Vista, Visual Dump Analysis, WinDbg Scripts, WinDbg Tips and Tricks, WinDbg for GDB Users, Windows 7, Windows Server 2008, Windows System Administration | No Comments »
Thursday, February 11th, 2010
This is a revised, edited, cross-referenced and thematically organized volume of selected DumpAnalysis.org blog posts about crash dump analysis and debugging written in July 2009 - January 2010 for software engineers developing and maintaining products on Windows platforms, quality assurance engineers testing software on Windows platforms and technical support and escalation engineers dealing with complex software issues. The fourth volume features:
- 13 new crash dump analysis patterns
- 13 new pattern interaction case studies
- 10 new trace analysis patterns
- 6 new Debugware patterns and case study
- Workaround patterns
- Updated checklist
- Fully cross-referenced with Volume 1, Volume 2 and Volume 3
- New appendixes
Product information:
- Title: Memory Dump Analysis Anthology, Volume 4
- Author: Dmitry Vostokov
- Language: English
- Product Dimensions: 22.86 x 15.24
- Paperback: 410 pages
- Publisher: Opentask (30 March 2010)
- ISBN-13: 978-1-906717-86-5
- Hardcover: 410 pages
- Publisher: Opentask (30 April 2010)
- ISBN-13: 978-1-906717-87-2

Back cover features memory space art image: Internal Process Combustion.
- Dmitry Vostokov @ DumpAnalysis.org + TraceAnalysis.org -
Posted in .NET Debugging, Aesthetics of Memory Dumps, Announcements, AntiPatterns, Art, Assembly Language, Books, C and C++, CDA Pattern Classification, CDF Analysis Tips and Tricks, Categorical Debugging, Certification, Citrix, Code Reading, Common Mistakes, Computer Science, Countefactual Debugging, Crash Analysis Report Environment (CARE), Crash Dump Analysis, Crash Dump Patterns, Crash Dumps for Dummies, DebugWare Patterns, Debugging, Debugging Slang, Education and Research, Escalation Engineering, Fun with Crash Dumps, Games for Debugging, Hardware, Horrors of Computation, Hyper-V, Kernel Development, Laws of Troubleshooting and Debugging, Mathematics of Debugging, Memiotics (Memory Semiotics), Memoidealism, Memoretics, Memory Analysis Culture, Memory Analysis Forensics and Intelligence, Memory Dreams, Memory Dump Analysis Jobs, Memory Dumps in Movies, Memory Space Art, Memory Visualization, Memuonics, Minidump Analysis, Multithreading, Music for Debugging, New Acronyms, New Words, Opcodism, Philosophy, Physicalist Art, Publishing, Science Fiction, Science of Memory Dump Analysis, Science of Software Tracing, Security, Software Architecture, Software Defect Construction, Software Engineering, Software Generalist, Software Maintenance Institute, Software Narratology, Software Technical Support, Software Trace Analysis, Software Trace Visualization, Software Tracing for Dummies, Software Victimology, Stack Trace Collection, Testing, Tools, Trace Analysis Patterns, Training and Seminars, Troubleshooting Methodology, Victimware, Virtualization, Vista, Visual Dump Analysis, WinDbg Scripts, WinDbg Tips and Tricks, WinDbg for GDB Users, Windows 7, Windows Server 2008, Windows System Administration, Workaround Patterns | No Comments »
Friday, November 20th, 2009
By analogy with a security researcher profession I propose the new title of a software defect researcher as a unified profession combining relevant fields of security research, testing, debugging, memory dump analysis, software reverse engineering, construction and maintenance. At least I consider myself a software defect researcher. If you think you consider yourself too please write a comment to this post. Thank you in advance.
- Dmitry Vostokov @ DumpAnalysis.org -
Posted in Announcements, Crash Dump Analysis, Debugging, Memory Dump Analysis Jobs, Security, Software Engineering, Testing | 1 Comment »
Saturday, September 26th, 2009
This is a revised, edited, cross-referenced and thematically organized volume of selected DumpAnalysis.org blog posts about crash dump analysis and debugging written in October 2008 - June 2009 for software engineers developing and maintaining products on Windows platforms, quality assurance engineers testing software on Windows platforms and technical support and escalation engineers dealing with complex software issues. The third volume features:
- 15 new crash dump analysis patterns
- 29 new pattern interaction case studies
- Trace analysis patterns
- Updated checklist
- Fully cross-referenced with Volume 1 and Volume 2
- New appendixes
Product information:
- Title: Memory Dump Analysis Anthology, Volume 3
- Author: Dmitry Vostokov
- Language: English
- Product Dimensions: 22.86 x 15.24
- Paperback: 404 pages
- Publisher: Opentask (20 December 2009)
- ISBN-13: 978-1-906717-43-8
- Hardcover: 404 pages
- Publisher: Opentask (30 January 2010)
- ISBN-13: 978-1-906717-44-5

Back cover features 3D computer memory visualization image.
- Dmitry Vostokov @ DumpAnalysis.org -
Posted in Announcements, AntiPatterns, Art, Assembly Language, Books, C and C++, CDF Analysis Tips and Tricks, Certification, Citrix, Code Reading, Common Mistakes, Computational Ghosts and Bug Hauntings, Computer Science, Countefactual Debugging, Crash Dump Analysis, Crash Dump Patterns, Crash Dumps for Dummies, DebugWare Patterns, Debugging, Debugging Slang, Deep Down C++, Education and Research, Escalation Engineering, Fun with Crash Dumps, Futuristic Memory Dump Analysis, Games for Debugging, Hardware, Horrors of Computation, Hyper-V, Intelligent Memory Movement, Kernel Development, Mathematics of Debugging, Memiotics (Memory Semiotics), Memoidealism, Memoretics, Memory Analysis Culture, Memory Analysis Forensics and Intelligence, Memory Dreams, Memory Dump Analysis Jobs, Memory Space Music, Memory Visualization, Memuonics, Minidump Analysis, Multithreading, Music for Debugging, New Acronyms, New Words, Occult Debugging, Philosophy, Poetry, Psi-computation, Publishing, Science of Memory Dump Analysis, Science of Software Tracing, Security, Software Architecture, Software Defect Construction, Software Engineering, Software Generalist, Software Narratology, Software Technical Support, Software Trace Analysis, Software Tracing for Dummies, Testing, Tools, Trace Analysis Patterns, Training and Seminars, Troubleshooting Methodology, Virtualization, Vista, Visual Dump Analysis, WinDbg Scripts, WinDbg Tips and Tricks, WinDbg for GDB Users, Windows 7, Windows Server 2008, Windows System Administration | No Comments »
Saturday, August 8th, 2009
The digital version of the book is finally available:
x64 Windows Debugging: Practical Foundations
Paperback should be available in 1-2 weeks on Amazon and other stores. When working on the book I fixed errors in the previous x86 version. Errata file for it should be available tomorrow.
- Dmitry Vostokov @ DumpAnalysis.org -
Posted in Announcements, Assembly Language, Books, C and C++, Certification, Code Reading, Crash Dump Analysis, Debugging, Education and Research, Memory Dump Analysis Jobs, Publishing, Security, Software Engineering, Software Technical Support, Testing, Tools, Training and Seminars, Vista, Windows 7, Windows Server 2008 | No Comments »
Tuesday, August 4th, 2009
OpenTask plans to expand its Practical Foundations series and publish the following 2 books for the forthcoming Memory Dump Analysis Fundamentals certification (Unix track) being developed by Memory Analysis and Debugging Institute:
Linux, FreeBSD and Mac OS X Debugging: Practical Foundations (ISBN: 978-1906717773)
64-bit Linux, FreeBSD and Mac OS X Debugging: Practical Foundations (ISBN: 978-1906717780)
- Dmitry Vostokov @ DumpAnalysis.org -
Posted in Announcements, Assembly Language, Books, Certification, Crash Dump Analysis, Debugging, Education and Research, FreeBSD Crash Corner, GDB for WinDbg Users, Linux Crash Corner, Mac Crash Corner, Memory Dump Analysis Jobs, Publishing, Software Engineering, Software Technical Support, Testing, Tools, Training and Seminars | No Comments »
Thursday, June 4th, 2009
Sometimes I’m asked about a broad software engineering book to recommend for general memory dump analysis that covers software architecture, design methods and diagramming languages like UML, programming languages, concurrency, real-time issues and many other topics you need to know to have systems understanding that helps in problem identification and debugging. Here’s the book that I was fortunate to buy 4-5 years ago in a book shop and is a sheer pleasure to read:
Software Engineering for Real-Time Systems

Today I found that there even exists an OMG certification based on it:
http://www.omg.org/ocres/exam-info.htm
I might try later this summer.
- Dmitry Vostokov @ DumpAnalysis.org -
Posted in Books, Certification, Crash Dump Analysis, Debugging, Memory Dump Analysis Jobs, Reviewed on Amazon, Software Architecture, Software Engineering, Software Generalist | No Comments »
Monday, June 1st, 2009
The number of blog visits (excluding portal main page and other my blogs) was about 15,000 - 16,000 by the end of the last year and then it dropped to 13,000. I explain this as the fact that 5% - 10% of engineers were no longer interested in crash dumps and debugging due to layoffs. This month I see the number of visits exceeds 14,000 and this surely makes me more optimistic about the prospect of economic recovery:
- Dmitry Vostokov @ DumpAnalysis.org -
Posted in Announcements, Crash Dump Analysis, Debugging, Memory Dump Analysis Jobs | No Comments »
Tuesday, May 12th, 2009
Previously announced memory dump analysis certification will have x86/x64-based tracks for Windows and Unix (including Linux / FreeBSD / Mac OS X). Each track consists of 3 exams, each having its own set of requirements and scope:
- Fundamentals of Memory Dump Analysis
- Intermediate Memory Dump Analysis
- Advanced Memory Dump Analysis
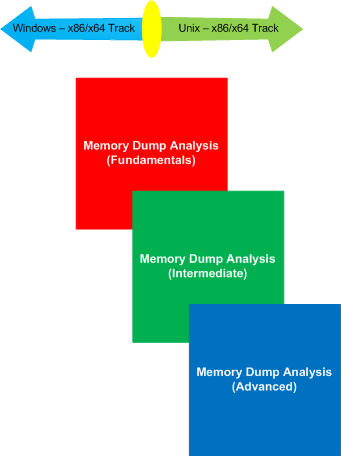
More information will be available later. The initiative is supported by OpenTask.
- Dmitry Vostokov @ DumpAnalysis.org -
Posted in Announcements, Certification, Crash Dump Analysis, Crash Dump Patterns, Debugging, Education and Research, Memory Dump Analysis Jobs, Minidump Analysis, Software Technical Support, Training and Seminars, WinDbg Tips and Tricks, WinDbg for GDB Users, Windows System Administration | No Comments »
Monday, May 11th, 2009
This is an example from the sample question set of the forthcoming memory dump analysis certification planned by Memory Analysis and Debugging Institute. You can reply to this post with your answers.
Q. Interpret the fragment from WinDbg output below.
0:002> !teb

[...]

TEB at 7efaf000

[...]
0:002> dds poi(7efaf000+8) poi(7efaf000+4)

01192000  00000000

01192004  00000000

01192008  00000000

[...]

0119e448  00010020

0119e44c  00030002

0119e450  00050004

0119e454  00070006

0119e458  00090008

0119e45c  000b000a

0119e460  000d000c

0119e464  000f000e

0119e468  00110010

0119e46c  00130012

0119e470  00150014

0119e474  00170016

0119e478  00190018

0119e47c  001b001a

0119e480  001d001c

0119e484  001f001e

0119e488  00210020

0119e48c  00230022

0119e490  00250024

0119e494  00270026

0119e498  00290028

0119e49c  002b002a

0119e4a0  002d002c

0119e4a4  002f002e

0119e4a8  00310030

0119e4ac  00330032

0119e4b0  00350034

0119e4b4  00370036

0119e4b8  00390038

0119e4bc  003b003a

0119e4c0  003d003c

0119e4c4  003f003e

0119e4c8  00410040 MyService!__InternalCxxFrameHandler+0x5c

0119e4cc  00430042

0119e4d0  00450044

0119e4d4  00470046

0119e4d8  00490048

0119e4dc  004b004a

0119e4e0  004d004c

0119e4e4  004f004e

0119e4e8  00510050 advapi32!`string'+0x164

0119e4ec  00530052 advapi32!GetPerflibKeyValue+0x184

0119e4f0  00550054 advapi32!`string'+0x20c

0119e4f4  00570056 advapi32!_NULL_IMPORT_DESCRIPTOR+0x2714

0119e4f8  00590058 advapi32!szPerflibSectionName <PERF> (advapi32+0x90058)

0119e4fc  005b005a shlwapi!_CRT_INIT+0xaf

0119e500  005d005c shlwapi!_OpenProgidKey+0xee

0119e504  005f005e shlwapi!_pRawDllMain <PERF> (shlwapi+0x5005e)

0119e508  00410060 MyService!__InternalCxxFrameHandler+0x7c

0119e50c  00430042

0119e510  00450044

0119e514  00470046

0119e518  00490048

0119e51c  004b004a

0119e520  004d004c

0119e524  004f004e

0119e528  00510050 advapi32!`string'+0x164

0119e52c  00530052 advapi32!GetPerflibKeyValue+0x184

0119e530  00550054 advapi32!`string'+0x20c

0119e534  00570056 advapi32!_NULL_IMPORT_DESCRIPTOR+0x2714

0119e538  00590058 advapi32!szPerflibSectionName <PERF> (advapi32+0x90058)

0119e53c  007b005a

0119e540  007d007c

0119e544  007f007e

[...]
Choose all answers that are valid:
a. ASCII string fragment
b. Raw stack data
c. Exception handling
d. UNICODE string fragment
e. Partial stack traces
f. Performance monitoring
g. Execution residue
- Dmitry Vostokov @ DumpAnalysis.org -
Posted in Certification, Crash Dump Analysis, Debugging, Education and Research, Memory Dump Analysis Jobs | 2 Comments »
Friday, May 8th, 2009
As soon as I wrote my review of the 2nd edition I found out that the 3rd edition was recently published and immediately bought it. I intend to read it from cover to cover again and publish my notes and comments in my reading notebook on Software Generalist blog. The new edition is also bundled with a companion CD.
Programming Language Pragmatics, Third Edition

Hope in one of subsequent editions the author includes my Riemann Programming Language :-)
- Dmitry Vostokov @ DumpAnalysis.org -
Posted in Announcements, Assembly Language, Books, Code Reading, Crash Dump Analysis, Debugging, Education and Research, Memory Dump Analysis Jobs, Multithreading, Reading Notebook, Reviewed on Amazon, Riemann Programming Language, Software Generalist | No Comments »
Friday, March 6th, 2009
Every debugging engineer needs to know how the code is interpreted or compiled. Debugging complex problems or doing memory analysis on general-purpose operating systems often requires understanding the syntax and semantics of several programming languages and their run-time support. The knowledge of optimization techniques is also important for low-level debugging when the source code is not available. The following book provides an overview of all important concepts and discusses almost 50 languages. I read the first edition 6 years ago and I liked it so much that I’m now reading the second edition.
Programming Language Pragmatics, Second Edition
- Dmitry Vostokov @ DumpAnalysis.org -
Posted in Assembly Language, Books, Code Reading, Crash Dump Analysis, Debugging, Memory Dump Analysis Jobs | 1 Comment »
Tuesday, February 3rd, 2009
Listening to étude No. 1 in C major written by Frédéric Chopin (Op. 10) an idea came to me about writing 16 debugging études (ISBN: 978-1906717575). It is surprising that there are many programming études out there but there are no debugging ones. Stay tuned and be in touch with this blog.
Draft definition:
Debugging étude is a composition of software with intentional defects (bugs) of considerable difficulty to find and fix, designed to provide practice material to perfect debugging techniques and problem-solving skills.
The idea actually came to me long time ago to create some sort of debugging excersises for training purposes.
- Dmitry Vostokov @ DumpAnalysis.org -
Posted in Announcements, Books, Debugging, Memory Dump Analysis Jobs, Music for Debugging, Publishing | No Comments »
Monday, February 2nd, 2009
I very proud to announce that after 3 weeks of final work the book has been released in both paperback and PDF format. In a week or so it should also appear on Amazon and other booksellers around the world. The book information and how to buy it can be found on the portal:
Windows Debugging: Practical Foundations
- Dmitry Vostokov @ DumpAnalysis.org -
Posted in Announcements, Assembly Language, Books, Crash Dump Analysis, Crash Dumps for Dummies, Debugging, Education and Research, Memory Dump Analysis Jobs, Publishing, Software Technical Support, Testing, Tools, Training and Seminars, WinDbg Tips and Tricks, WinDbg for GDB Users | No Comments »
Thursday, January 29th, 2009
Draft Table of Contents is available for the forthcoming Windows Debugging: Practical Foundations book to be released next week:
Draft Table of Contents
- Dmitry Vostokov @ DumpAnalysis.org -
Posted in Announcements, Assembly Language, Books, Crash Dump Analysis, Debugging, Memory Dump Analysis Jobs, Publishing, Software Technical Support, Testing, Training and Seminars, WinDbg for GDB Users | No Comments »