Archive for the ‘Crash Analysis Report Environment (CARE)’ Category
Friday, July 13th, 2012
For some time I was struggling with finding a good name for memory dump and software trace analysis activities. The name Memoretics I use for the science of memory dump analysis (that also incorporates software traces) seems not so good to describe the whole practical activity that should be transparent to everyone in IT. Fortunately, I timely understood that all these activities constitute the essence of software diagnostics that previously lacked any solid foundation. Thus, Software Diagnostics Institute was reborn from the previous Crash Dump Analysis Portal. This institute does pure and applied research and scientific activities and in recent years was funded mainly from OpenTask publisher and recently from Memory Dump Analysis Services. The latter company also recognized that the broadening of its commercial activities requires a new name. So, Software Diagnostics Services was reborn:
The First Comprehensive Software Diagnostics Service
- Dmitry Vostokov @ DumpAnalysis.org + TraceAnalysis.org -
Posted in Announcements, Cloud Memory Dump Analysis, Complete Memory Dump Analysis, Core Dump Analysis, Crash Analysis Report Environment (CARE), Crash Dump Analysis, Debugging, Debugging Bureau, Debugging Industry, Debugging Methodology, Debugging Today, Debugging Trends, Education, Education and Research, Escalation Engineering, Event Tracing for Windows (ETW), First Fault Software Diagnostics, Generative Debugging, JIT Crash Analysis, JIT Memory Space Analysis, Java Debugging, Kernel Development, Kernel Memory Dump Analysis, Linux Crash Corner, MFC Debugging, Mac Crash Corner, Mac OS X, Malware Analysis, Memoretics, Memory Analysis Forensics and Intelligence, Memory Analysis Report System, Memory Dump Analysis Methodology, Memory Dump Analysis Services, Minidump Analysis, New Debugging School, Pattern-Driven Debugging, Pattern-Driven Software Support, Performance Monitoring, Root Cause Analysis, SQL Debugging, Security, Software Debugging Services, Software Diagnostics, Software Diagnostics Institute, Software Diagnostics Services, Software Engineering, Software Problem Solving, Software Technical Support, Software Trace Analysis, Software Trace Analysis Report Environment (STARE), Tools, Training and Seminars, Troubleshooting Methodology, Unified Software Diagnostics, Windows 7, Windows 8, Windows Azure, Windows Mobile, Windows Server 2008, Windows System Administration, x64 Mac OS X, x64 Windows | No Comments »
Monday, January 23rd, 2012
Memory Dump Analysis Services started working on 2CARE2 system (Crash Analysis Report Environment, 2nd generation) and asked me to design a trademark. My Chemistry background (I like Organic Chemistry most) and imagination led me to represent client and server parts holistically as an aromatic-like compound:
- Dmitry Vostokov @ DumpAnalysis.org + TraceAnalysis.org -
Posted in Announcements, Chemistry, Crash Analysis Report Environment (CARE), Crash Dump Analysis, Memory Dump Analysis Services, Trademarks | No Comments »
Saturday, December 3rd, 2011
If not for you then definitely for me because I now diagnose Spiking Thread pattern much faster. One of the readers if this blog asked me whether there is !runaway command equivalent for kernel and complete memory dumps. So, after some thinking I gave it a try especially in the context of WinDbg scripting exercises designed for Advanced Windows Memory Dump Analysis training. As a result I wrote 2 scripts initially that you can try yourself. Their output here is taken from a complete memory dump I used for Fundamentals of Complete Crash and Hang Memory Dump Analysis presentation.
The first one dumps the most CPU consuming threads for user and kernel mode:
$$

$$ krunawaymost.wds

$$ Copyright (c) 2011 Memory Dump Analysis Services

$$ GNU GENERAL PUBLIC LICENSE

$$ http://www.gnu.org/licenses/gpl-3.0.txt

$$

r $t0 = 0

!for_each_thread “r $t1 = dwo( @#Thread + @@c++(#FIELD_OFFSET(nt!_KTHREAD, UserTime)) ); .if (@$t1 > @$t0) {r $t0 = @$t1; r $t2 = @#Thread}”

.echo “The largest UserTime value: ”

? @$t0

!thread @$t2 ff

r $t0 = 0

!for_each_thread “r $t1 = dwo( @#Thread + @@c++(#FIELD_OFFSET(nt!_KTHREAD, KernelTime)) ); .if (@$t1 > @$t0) {r $t0 = @$t1; r $t2 = @#Thread}”

.echo “The largest KernelTime value: ”

? @$t0

!thread @$t2 ff
0: kd> $$><c:\Scripts\krunawaymost.wds

The largest UserTime value:

Evaluate expression: 5470 = 00000000`0000155e

THREAD fffffa800451d720  Cid 1418.17fc  Teb: 000007fffffdc000 Win32Thread: 0000000000000000 RUNNING on processor 2

Not impersonating

DeviceMap                 fffff8a001ce6b90

Owning Process            fffffa800442ab30       Image:         ApplicationE.exe

Attached Process          N/A            Image:         N/A

Wait Start TickCount      22295          Ticks: 0

Context Switch Count      27960

UserTime                  00:01:25.332

KernelTime                00:00:00.015

*** ERROR: Module load completed but symbols could not be loaded for ApplicationE.exe

Win32 Start Address ApplicationE (0×000000013f0f1578)

Stack Init fffff8800723cc70 Current fffff8800723c960

Base fffff8800723d000 Limit fffff88007237000 Call 0

Priority 8 BasePriority 8 UnusualBoost 0 ForegroundBoost 0 IoPriority 2 PagePriority 5

Child-SP          RetAddr           Call Site

00000000`0021f9e0 00000000`00000000 ApplicationE+0×6cd3
The largest KernelTime value:

Evaluate expression: 187 = 00000000`000000bb

THREAD fffffa80098d7b60  Cid 07bc.0a14  Teb: 000007fffffd7000 Win32Thread: fffff900c2ca0c20 WAIT: (UserRequest) KernelMode Non-Alertable

    fffffa8008a4a030  NotificationEvent

Not impersonating

DeviceMap                 fffff8a001ce6b90

Owning Process            fffffa80096beb30       Image:         dwm.exe

Attached Process          N/A            Image:         N/A

Wait Start TickCount      22294          Ticks: 1 (0:00:00:00.015)

Context Switch Count      15473                 LargeStack

UserTime                  00:00:06.801

KernelTime                00:00:02.917

Win32 Start Address dwmcore!CPartitionThread::ThreadMain (0×000007fef8a1f0d8)

Stack Init fffff8800d3d5c70 Current fffff8800d3d5740

Base fffff8800d3d6000 Limit fffff8800d3cf000 Call 0

Priority 15 BasePriority 15 UnusualBoost 0 ForegroundBoost 0 IoPriority 2 PagePriority 5

Child-SP          RetAddr           Call Site

fffff880`0d3d5780 fffff800`02ee6f32 nt!KiSwapContext+0×7a

fffff880`0d3d58c0 fffff800`02ee974f nt!KiCommitThreadWait+0×1d2

fffff880`0d3d5950 fffff880`0fef65b3 nt!KeWaitForSingleObject+0×19f

fffff880`0d3d59f0 fffff960`001fedea dxgkrnl!DxgkWaitForVerticalBlankEvent+0×53f

fffff880`0d3d5ab0 fffff800`02ee0ed3 win32k!NtGdiDdDDIWaitForVerticalBlankEvent+0×12

fffff880`0d3d5ae0 000007fe`ff1d143a nt!KiSystemServiceCopyEnd+0×13 (TrapFrame @ fffff880`0d3d5ae0)

00000000`0287f778 000007fe`f8791da1 GDI32!NtGdiDdDDIWaitForVerticalBlankEvent+0xa

00000000`0287f780 000007fe`f89e1b6e dxgi!CDXGIOutput::WaitForVBlank+0×51

00000000`0287f7c0 000007fe`f89e1ae9 dwmcore!CD3DDeviceLevel1::WaitForVBlank+0×1f9

00000000`0287f810 000007fe`f89e1a9d dwmcore!CHwDisplayRenderTarget::WaitForVBlank+0×39

00000000`0287f850 000007fe`f89e1a4c dwmcore!CDesktopRenderTarget::WaitForVBlank+0×40

00000000`0287f880 000007fe`f89d3513 dwmcore!CSlaveHWndRenderTarget::WaitForVBlank+0×2c

00000000`0287f8c0 000007fe`f89d3584 dwmcore!CRenderTargetManager::WaitForVBlank+0×7d

00000000`0287f900 000007fe`f89d2661 dwmcore!CPartitionVerticalBlankScheduler::WaitForVBlank+0×7c

00000000`0287f950 000007fe`f8a1f0f4 dwmcore!CPartitionVerticalBlankScheduler::Run+0xe5

00000000`0287f9b0 00000000`7719652d dwmcore!CPartitionThread::ThreadMain+0×1c

00000000`0287f9e0 00000000`772cc521 kernel32!BaseThreadInitThunk+0xd

00000000`0287fa10 00000000`00000000 ntdll!RtlUserThreadStart+0×1d
The second script takes two arguments and shows all threads that have UserTime and KernelTime ticks value greater than (you can have the idea of the maximum from the previous script):
$$

$$ krunawaygt.wds

$$ Copyright (c) 2011 Memory Dump Analysis Services

$$ GNU GENERAL PUBLIC LICENSE

$$ http://www.gnu.org/licenses/gpl-3.0.txt

$$

!for_each_thread “r $t1 = dwo( @#Thread + @@c++(#FIELD_OFFSET(nt!_KTHREAD, UserTime)) ); r $t0 = $arg1; .if (@$t1 > @$t0) {!thread @#Thread ff}”

!for_each_thread “r $t1 = dwo( @#Thread + @@c++(#FIELD_OFFSET(nt!_KTHREAD, KernelTime)) ); r $t0 = $arg2; .if (@$t1 > @$t0) {!thread @#Thread ff}”
Using hints from the previous script run (the largest UserTime ticks value is 0×155e) we now get threads that spent more than 0×100 ticks in user mode:
0: kd> $$>a<c:\Scripts\krunawaygt.wds 100 100

THREAD fffffa800843e060  Cid 03f4.0658  Teb: 000007fffff90000 Win32Thread: 0000000000000000 WAIT: (WrQueue) UserMode Non-Alertable

    fffffa800843c2c0  QueueObject

Not impersonating

DeviceMap                 fffff8a000008aa0

Owning Process            fffffa800916b060       Image:         MsMpEng.exe

Attached Process          N/A            Image:         N/A

Wait Start TickCount      21211          Ticks: 1084 (0:00:00:16.910)

Context Switch Count      6028

UserTime                  00:00:10.140

KernelTime                00:00:00.296

Win32 Start Address msvcrt!endthreadex (0×000007feff5173fc)

Stack Init fffff88009d4bc70 Current fffff88009d4b660

Base fffff88009d4c000 Limit fffff88009d46000 Call 0

Priority 9 BasePriority 8 UnusualBoost 0 ForegroundBoost 0 IoPriority 2 PagePriority 5

*** ERROR: Symbol file could not be found.  Defaulted to export symbols for mprtp.dll -

Child-SP          RetAddr           Call Site

fffff880`09d4b6a0 fffff800`02ee6f32 nt!KiSwapContext+0×7a

fffff880`09d4b7e0 fffff800`02ee9f93 nt!KiCommitThreadWait+0×1d2

fffff880`09d4b870 fffff800`031ca647 nt!KeRemoveQueueEx+0×323

fffff880`09d4b930 fffff800`0319cae5 nt!IoRemoveIoCompletion+0×47

fffff880`09d4b9c0 fffff800`02ee0ed3 nt!NtRemoveIoCompletion+0×145

fffff880`09d4ba70 00000000`772f13aa nt!KiSystemServiceCopyEnd+0×13 (TrapFrame @ fffff880`09d4bae0)

00000000`0209fb08 000007fe`fd9e169d ntdll!ZwRemoveIoCompletion+0xa

00000000`0209fb10 00000000`7718a4e1 KERNELBASE!GetQueuedCompletionStatus+0×39

00000000`0209fb70 00000000`748f2c74 kernel32!GetQueuedCompletionStatusStub+0×11

00000000`0209fbb0 00000000`0045cbc0 mprtp!MpPluginSignatureChange+0×3e170

00000000`0209fbb8 000007fe`fbac25ff 0×45cbc0

00000000`0209fbc0 00000000`00466610 FLTLIB!FilterGetMessage+0×2b

00000000`0209fc20 00000000`00000000 0×466610
THREAD fffffa800845c060  Cid 03f4.065c  Teb: 000007fffff8e000 Win32Thread: 0000000000000000 WAIT: (WrQueue) UserMode Non-Alertable

    fffffa800843c2c0  QueueObject

Not impersonating

DeviceMap                 fffff8a000008aa0

Owning Process            fffffa800916b060       Image:         MsMpEng.exe

Attached Process          N/A            Image:         N/A

Wait Start TickCount      21520          Ticks: 775 (0:00:00:12.090)

Context Switch Count      4979

UserTime                  00:00:04.149

KernelTime                00:00:00.156

Win32 Start Address msvcrt!endthreadex (0×000007feff5173fc)

Stack Init fffff88009d52c70 Current fffff88009d52660

Base fffff88009d53000 Limit fffff88009d4d000 Call 0

Priority 8 BasePriority 8 UnusualBoost 0 ForegroundBoost 0 IoPriority 2 PagePriority 5

*** ERROR: Symbol file could not be found.  Defaulted to export symbols for mprtp.dll -

Child-SP          RetAddr           Call Site

fffff880`09d526a0 fffff800`02ee6f32 nt!KiSwapContext+0×7a

fffff880`09d527e0 fffff800`02ee9f93 nt!KiCommitThreadWait+0×1d2

fffff880`09d52870 fffff800`031ca647 nt!KeRemoveQueueEx+0×323

fffff880`09d52930 fffff800`0319cae5 nt!IoRemoveIoCompletion+0×47

fffff880`09d529c0 fffff800`02ee0ed3 nt!NtRemoveIoCompletion+0×145

fffff880`09d52a70 00000000`772f13aa nt!KiSystemServiceCopyEnd+0×13 (TrapFrame @ fffff880`09d52ae0)

00000000`01ccf498 000007fe`fd9e169d ntdll!ZwRemoveIoCompletion+0xa

00000000`01ccf4a0 00000000`7718a4e1 KERNELBASE!GetQueuedCompletionStatus+0×39

00000000`01ccf500 00000000`748f2c74 kernel32!GetQueuedCompletionStatusStub+0×11

00000000`01ccf540 00000000`0045d030 mprtp!MpPluginSignatureChange+0×3e170

00000000`01ccf548 000007fe`fbac25ff 0×45d030

00000000`01ccf550 00000000`004666b0 FLTLIB!FilterGetMessage+0×2b

00000000`01ccf5b0 00000000`00000000 0×4666b0
THREAD fffffa80092b7060  Cid 03f4.1268  Teb: 000007fffff6a000 Win32Thread: 0000000000000000 WAIT: (WrQueue) UserMode Alertable

    fffffa8009299140  QueueObject

Not impersonating

DeviceMap                 fffff8a000008aa0

Owning Process            fffffa800916b060       Image:         MsMpEng.exe

Attached Process          N/A            Image:         N/A

Wait Start TickCount      7762           Ticks: 14533 (0:00:03:46.716)

Context Switch Count      3297

UserTime                  00:00:06.489

KernelTime                00:00:00.499

Win32 Start Address ntdll!TppWorkerThread (0×00000000772bfbc0)

Stack Init fffff8800e620c70 Current fffff8800e620680

Base fffff8800e621000 Limit fffff8800e61b000 Call 0

Priority 8 BasePriority 8 UnusualBoost 0 ForegroundBoost 0 IoPriority 2 PagePriority 5

Child-SP          RetAddr           Call Site

fffff880`0e6206c0 fffff800`02ee6f32 nt!KiSwapContext+0×7a

fffff880`0e620800 fffff800`02ee9f93 nt!KiCommitThreadWait+0×1d2

fffff880`0e620890 fffff800`031ca647 nt!KeRemoveQueueEx+0×323

fffff880`0e620950 fffff800`02ecdb36 nt!IoRemoveIoCompletion+0×47

fffff880`0e6209e0 fffff800`02ee0ed3 nt!NtWaitForWorkViaWorkerFactory+0×285

fffff880`0e620ae0 00000000`772f2c1a nt!KiSystemServiceCopyEnd+0×13 (TrapFrame @ fffff880`0e620ae0)

00000000`0540f998 00000000`772bfe0b ntdll!ZwWaitForWorkViaWorkerFactory+0xa

00000000`0540f9a0 00000000`7719652d ntdll!TppWorkerThread+0×2c9

00000000`0540fca0 00000000`772cc521 kernel32!BaseThreadInitThunk+0xd

00000000`0540fcd0 00000000`00000000 ntdll!RtlUserThreadStart+0×1d
THREAD fffffa80098d7b60  Cid 07bc.0a14  Teb: 000007fffffd7000 Win32Thread: fffff900c2ca0c20 WAIT: (UserRequest) KernelMode Non-Alertable

    fffffa8008a4a030  NotificationEvent

Not impersonating

DeviceMap                 fffff8a001ce6b90

Owning Process            fffffa80096beb30       Image:         dwm.exe

Attached Process          N/A            Image:         N/A

Wait Start TickCount      22294          Ticks: 1 (0:00:00:00.015)

Context Switch Count      15473                 LargeStack

UserTime                  00:00:06.801

KernelTime                00:00:02.917

Win32 Start Address dwmcore!CPartitionThread::ThreadMain (0×000007fef8a1f0d8)

Stack Init fffff8800d3d5c70 Current fffff8800d3d5740

Base fffff8800d3d6000 Limit fffff8800d3cf000 Call 0

Priority 15 BasePriority 15 UnusualBoost 0 ForegroundBoost 0 IoPriority 2 PagePriority 5

Child-SP          RetAddr           Call Site

fffff880`0d3d5780 fffff800`02ee6f32 nt!KiSwapContext+0×7a

fffff880`0d3d58c0 fffff800`02ee974f nt!KiCommitThreadWait+0×1d2

fffff880`0d3d5950 fffff880`0fef65b3 nt!KeWaitForSingleObject+0×19f

fffff880`0d3d59f0 fffff960`001fedea dxgkrnl!DxgkWaitForVerticalBlankEvent+0×53f

fffff880`0d3d5ab0 fffff800`02ee0ed3 win32k!NtGdiDdDDIWaitForVerticalBlankEvent+0×12

fffff880`0d3d5ae0 000007fe`ff1d143a nt!KiSystemServiceCopyEnd+0×13 (TrapFrame @ fffff880`0d3d5ae0)

00000000`0287f778 000007fe`f8791da1 GDI32!NtGdiDdDDIWaitForVerticalBlankEvent+0xa

00000000`0287f780 000007fe`f89e1b6e dxgi!CDXGIOutput::WaitForVBlank+0×51

00000000`0287f7c0 000007fe`f89e1ae9 dwmcore!CD3DDeviceLevel1::WaitForVBlank+0×1f9

00000000`0287f810 000007fe`f89e1a9d dwmcore!CHwDisplayRenderTarget::WaitForVBlank+0×39

00000000`0287f850 000007fe`f89e1a4c dwmcore!CDesktopRenderTarget::WaitForVBlank+0×40

00000000`0287f880 000007fe`f89d3513 dwmcore!CSlaveHWndRenderTarget::WaitForVBlank+0×2c

00000000`0287f8c0 000007fe`f89d3584 dwmcore!CRenderTargetManager::WaitForVBlank+0×7d

00000000`0287f900 000007fe`f89d2661 dwmcore!CPartitionVerticalBlankScheduler::WaitForVBlank+0×7c

00000000`0287f950 000007fe`f8a1f0f4 dwmcore!CPartitionVerticalBlankScheduler::Run+0xe5

00000000`0287f9b0 00000000`7719652d dwmcore!CPartitionThread::ThreadMain+0×1c

00000000`0287f9e0 00000000`772cc521 kernel32!BaseThreadInitThunk+0xd

00000000`0287fa10 00000000`00000000 ntdll!RtlUserThreadStart+0×1d
THREAD fffffa800451d720  Cid 1418.17fc  Teb: 000007fffffdc000 Win32Thread: 0000000000000000 RUNNING on processor 2

Not impersonating

DeviceMap                 fffff8a001ce6b90

Owning Process            fffffa800442ab30       Image:         ApplicationE.exe

Attached Process          N/A            Image:         N/A

Wait Start TickCount      22295          Ticks: 0

Context Switch Count      27960

UserTime                  00:01:25.332

KernelTime                00:00:00.015

*** ERROR: Module load completed but symbols could not be loaded for ApplicationE.exe

Win32 Start Address ApplicationE (0×000000013f0f1578)

Stack Init fffff8800723cc70 Current fffff8800723c960

Base fffff8800723d000 Limit fffff88007237000 Call 0

Priority 8 BasePriority 8 UnusualBoost 0 ForegroundBoost 0 IoPriority 2 PagePriority 5

Child-SP          RetAddr           Call Site

00000000`0021f9e0 00000000`00000000 ApplicationE+0×6cd3
Memory Dump Analysis Services is now working to incorporate client-side WinDbg scripting into their CARE2 architecture.
- Dmitry Vostokov @ DumpAnalysis.org + TraceAnalysis.org -
Posted in Announcements, Complete Memory Dump Analysis, Crash Analysis Report Environment (CARE), Crash Dump Analysis, Crash Dump Patterns, Debugging, Memory Dump Analysis Services, Training and Seminars, WinDbg Scripts, WinDbg Tips and Tricks, x64 Windows | No Comments »
Thursday, April 21st, 2011
Imagine a pattern-driven crash analysis report (car) when you need it: at the very moment of a crash, just in time! And the car drives you to a problem resolution. Imagine also a periodic pattern-driven just-in-time memory space analysis (JIT MSA) that provides you instant intelligent reports on what’s going on inside memory while your application, service or system is running! This is a forthcoming optional client side part of CARE (Crash Analysis Report Environment) which is being developed by Memory Dump Analysis Services engineering team under the leadership of Alexey Golikov. Combined with generative debugging techniques both client and server parts form a complete unique enterprise crash and hang analysis solution suitable for development and production environments. Stay tuned for further exciting updates.
PS. The car drives on a road to the first fault software problem solving.
- Dmitry Vostokov @ DumpAnalysis.org + TraceAnalysis.org -
Posted in Crash Analysis Report Environment (CARE), Crash Dump Analysis, Debugging, Debugging Methodology, Escalation Engineering, First Fault Problem Solving, Generative Debugging, JIT Crash Analysis, JIT Memory Space Analysis, Memory Analysis Forensics and Intelligence, Memory Dump Analysis Services, Pattern Prediction, Software Behavior Patterns, Software Engineering, Software Technical Support, Testing, Tools, Windows System Administration | No Comments »
Sunday, April 17th, 2011
I’m pleased to announce that MDAA, Volume 5 is available in PDF format:
www.dumpanalysis.org/Memory+Dump+Analysis+Anthology+Volume+5
It features:
- 25 new crash dump analysis patterns
- 11 new pattern interaction case studies (including software tracing)
- 16 new trace analysis patterns
- 7 structural memory patterns
- 4 modeling case studies for memory dump analysis patterns
- Discussion of 3 common analysis mistakes
- Malware analysis case study
- Computer independent architecture of crash analysis report service
- Expanded coverage of software narratology
- Metaphysical and theological implications of memory dump worldview
- More pictures of memory space and physicalist art
- Classification of memory visualization tools
- Memory visualization case studies
- Close reading of the stories of Sherlock Holmes: Dr. Watson’s observational patterns
- Fully cross-referenced with Volume 1, Volume 2, Volume 3, and Volume 4
Its table of contents is available here:
www.dumpanalysis.org/MDAA/MDA-Anthology-V5-TOC.pdf
Paperback and hardcover versions should be available in a week or two. I also started working on Volume 6 that should be available in November-December.
- Dmitry Vostokov @ DumpAnalysis.org + TraceAnalysis.org -
Posted in Aesthetics of Memory Dumps, Analysis Notation, Announcements, AntiPatterns, Archaeology of Computer Memory, Art, Assembly Language, Best Practices, Books, C and C++, CDF Analysis Tips and Tricks, Categorical Debugging, Citrix, Common Mistakes, Common Questions, Complete Memory Dump Analysis, Computer Forensics, Computer Science, Crash Analysis Report Environment (CARE), Crash Dump Analysis, Crash Dump De-analysis, Crash Dump Patterns, Crash Dumps for Dummies, Cyber Warfare, Debugging, Debugging Bureau, Debugging Industry, Debugging Methodology, Debugging Slang, Debugging Trends, Deep Down C++, Dr. Watson, Dublin School of Security, Education and Research, Escalation Engineering, Fun with Crash Dumps, Fun with Debugging, Fun with Software Traces, General Memory Analysis, Hermeneutics of Memory Dumps and Traces, Images of Computer Memory, Kernel Development, Malware Analysis, Mathematics of Debugging, Memiotics (Memory Semiotics), Memory Analysis Forensics and Intelligence, Memory Diagrams, Memory Dump Analysis Services, Memory Dumps in Myths, Memory Space Art, Memory Systems Language, Memory Visualization, Memory and Glitches, Metaphysics of Memory Worldview, Multithreading, Music for Debugging, New Acronyms, New Debugging School, New Words, Pattern Models, Philosophy, Physicalist Art, Publishing, Reverse Engineering, Science of Memory Dump Analysis, Science of Software Tracing, Security, Software Architecture, Software Behavior Patterns, Software Chorography, Software Chorology, Software Defect Construction, Software Engineering, Software Generalist, Software Maintenance Institute, Software Narratology, Software Technical Support, Software Trace Analysis, Software Trace Reading, Software Trace Visualization, Software Tracing for Dummies, Software Troubleshooting Patterns, Software Victimology, Structural Memory Patterns, Structural Trace Patterns, Systems Thinking, Testing, The Way of Philip Marlowe, Tools, Trace Analysis Patterns, Training and Seminars, Troubleshooting Methodology, Victimware, Vista, Webinars, WinDbg Scripting Extensions, WinDbg Scripts, WinDbg Tips and Tricks, WinDbg for GDB Users, Windows 7, Windows Server 2008, Windows System Administration, Workaround Patterns, x64 Windows | No Comments »
Saturday, February 5th, 2011
Got an insider information from Memory Dump Analysis Services that they are developing a Prolog extension for memory dump analysis. Indeed, after asking their development team, I got a proof of concept extension DLL that works on my computer after installing x64 version of SWI-Prolog and copying wdes.dll to pl \ bin installation folder:
0: kd> .load C:\Program Files\pl\bin\wdes.dll
0: kd> !help

Help for Windows Debugging Expert System wdes.dll

   help               - Shows this help

   pload              - Loads Prolog interpretor
0: kd> !pload

SWI-Prolog has been loaded
So far so good. Waiting for more extension commands. Perhaps, one day, this extension realizes my dream reminisced while testing a Python extension.
- Dmitry Vostokov @ DumpAnalysis.org + TraceAnalysis.org -
Posted in Announcements, Artificial Intelligence for Debugging, Crash Analysis Report Environment (CARE), Crash Dump Analysis, Crash Dump Patterns, Debugging, Malware Analysis, Memory Analysis Report System, Memory Dump Analysis Services, Prolog for Debugging, WinDbg Scripting Extensions | No Comments »
Saturday, February 5th, 2011
Finally had time today to test python WinDbg extension. I installed python 2.6.6 and used Debugging Tools for Windows x64. The script I used was from the extension web site blog slightly modified and called processes.py:
from pykd import *

nt = loadModule( "nt" )

processList = typedVarList( nt.PsActiveProcessHead, "nt", "_EPROCESS", "ActiveProcessLinks" )

for process in processList:

    dprintln( "".join( [ chr(i) for i in process.ImageFileName.values() ] ) )

    dprintln( "\r" )
I loaded x64 version of pykd.pyd extension and executed the script:
0: kd> !py c:\PyScripts\processes.py

System

smss.exe

csrss.exe

csrss.exe

psxss.exe

winlogon.exe

wininit.exe

services.exe

lsass.exe

lsm.exe

svchost.exe

svchost.exe

svchost.exe

svchost.exe

svchost.exe

svchost.exe

svchost.exe

svchost.exe

spoolsv.exe

mdm.exe

svchost.exe

svchost.exe

svchost.exe

taskhost.exe

dwm.exe

explorer.exe

DTLite.exe

mmc.exe

WZQKPICK.EXE

concentr.exe

pnamain.exe

jusched.exe

wfcrun32.exe

msdtc.exe

iexplore.exe

iexplore.exe

iexplore.exe

splwow64.exe

iexplore.exe

jucheck.exe

iexplore.exe

notepad.exe

notepad.exe

iexplore.exe

notepad.exe

iexplore.exe

notepad.exe

notepad.exe

iexplore.exe

audiodg.exe

CDViewer.exe

wfica32.exe

iexplore.exe

notepad.exe

cmd.exe

conhost.exe

wuauclt.exe

wfica32.exe

wlrmdr.exe

TrustedInstall

wfica32.exe

notepad.exe

iexplore.exe

wmplayer.exe

VISIO.EXE

mspaint.exe

svchost.exe

sppsvc.exe

windbg.exe

mmc.exe

LogonUI.exe

taskeng.exe

NotMyfault.exe
Very good so far. I’m learning now Python language to write more interesting scripts for crash dump analysis pattern diagnostics, mining statistics, formatting and visualization. After browsing Amazon for some time I chose this book for study:
A Primer on Scientific Programming with Python

About 5 or 6 years ago I was thinking about using a Prolog interpreter to write an expert system for crash dump analysis. I even wrote a simple Prolog program to match product hotfixes and was contemplating writing a WinDbg extension especially after I learnt that SWI-Prolog system I used had an interpreter DLL that could be dynamically loaded into a Win32 API application.
- Dmitry Vostokov @ DumpAnalysis.org + TraceAnalysis.org -
Posted in Artificial Intelligence for Debugging, Crash Analysis Report Environment (CARE), Crash Dump Analysis, Crash Dump Patterns, Debugging, Malware Analysis, Memory Analysis Forensics and Intelligence, Memory Analysis Report System, Memory Visualization, Prolog for Debugging, Python for Debugging, WinDbg Scripting Extensions | No Comments »
Saturday, January 1st, 2011
With the new year starts the new initiative to integrate traditional multidisciplinary debugging approaches and methodologies with multiplatform pattern-driven software problem solving, unified debugging patterns, best practices in memory dump analysis and software tracing, computer security, economics, and the new emerging trends I’m going to write about during this year.
- Dmitry Vostokov @ DumpAnalysis.org + TraceAnalysis.org -
Posted in Announcements, Best Practices, Computer Forensics, Computer Science, Countefactual Debugging, Crash Analysis Report Environment (CARE), Crash Dump Analysis, Crash Dump Patterns, DebugWare Patterns, Debugging, Debugging Industry, Debugging Methodology, Debugging Trends, Dublin School of Security, Economics, Education and Research, Escalation Engineering, First Fault Problem Solving, Malware Analysis, Malware Patterns, Mathematics of Debugging, Memiotics (Memory Semiotics), Memoretics, Memory Analysis Forensics and Intelligence, Memory Analysis Report System, Memory Dump Analysis Services, Memory Systems Language, Memory Visualization, New Debugging School, Science of Memory Dump Analysis, Science of Software Tracing, Security, Software Behavior Patterns, Software Defect Construction, Software Engineering, Software Generalist, Software Maintenance Institute, Software Narratology, Software Trace Analysis, Software Trace Visualization, Software Tracing Implementation Patterns, Software Troubleshooting Patterns, Structural Memory Patterns, Structural Trace Patterns, Systems Thinking, Testing, Tool Objects, Tools, Trace Analysis Patterns, Training and Seminars, Troubleshooting Methodology, Unified Debugging Patterns, Victimware, Visual Dump Analysis, Webinars, Workaround Patterns | No Comments »
Friday, December 17th, 2010
As the new decade is approaching (2011-2020) we would like to make a few previews and predictions:
- Increased complexity of software will bring more methods from biological, social sciences and humanities in addition to existing methods of automated debugging and computer science techniques
- Focus on first fault software problem solving (when aspect)
- Focus on pattern-driven software problem solving (how aspect)
- Fusion of debugging and malware analysis into a unified structural and behavioral pattern framework
- Visual debugging, memory and software trace visualization techniques
- Software maintenance certification
- Focus on domain-driven troubleshooting and debugging tools as a service (debugware TaaS)
- Focus on security issues related to memory dumps and software traces
- New scripting languages and programming language extensions for debugging
- The maturation of the science of memory snapshots and software traces (memoretics)
Imagining is not not limited to the above and more to come and explain in the forthcoming parts.
- Dmitry Vostokov @ DumpAnalysis.org + TraceAnalysis.org -
Posted in Announcements, Anthropology, Archaeology of Computer Memory, Biology, Certification, Computer Science, Countefactual Debugging, Crash Analysis Report Environment (CARE), Crash Dump Analysis, Crash Dump Patterns, DebugWare Patterns, Debugging, Debugging Industry, Debugging Methodology, Debugging Trends, Dublin School of Security, EasyDbg, Economics, Escalation Engineering, Evolution, First Fault Problem Solving, Futuristic Memory Dump Analysis, General Memory Analysis, General Science, Geography, Hardware, Hermeneutics of Memory Dumps and Traces, History, Humanities, Language, Laws of Troubleshooting and Debugging, Logic, Malware Analysis, Malware Patterns, Mathematics of Debugging, Memiotics (Memory Semiotics), Memoretics, Memory Analysis Forensics and Intelligence, Memory Analysis Report System, Memory Dump Analysis and History, Memory Systems Language, Memory Visualization, Paleo-debugging, Pattern Models, Pattern Prediction, Physics, Psychology, Publishing, Science of Memory Dump Analysis, Science of Software Tracing, Security, Social Media, Social Sciences, Software Architecture, Software Behavior Patterns, Software Chorography, Software Chorology, Software Defect Construction, Software Engineering, Software Generalist, Software Maintenance Institute, Software Narrative Fiction, Software Narratology, Software Technical Support, Software Trace Analysis, Software Trace Analysis and History, Software Trace Deconstruction, Software Trace Linguistics, Software Trace Visualization, Software Troubleshooting Patterns, Software Victimology, Statistics, Structural Memory Analysis and Social Sciences, Structural Memory Patterns, Structural Trace Patterns, Systems Thinking, Testing, Tools, Trace Analysis Patterns, Troubleshooting Methodology, Unified Debugging Patterns, Uses of UML, Victimware, Virtualization, Visual Dump Analysis, Windows System Administration, Workaround Patterns | No Comments »
Tuesday, November 30th, 2010
MAaaS includes 2 complementary DA+TA services:
1. Dump Analysis as a Service (DAaaS)
2. Trace Analysis as a Service (TAaaS)
Memory Dump Analysis Services is the first organization to provide such a service at an audit and certification levels.
- Dmitry Vostokov @ DumpAnalysis.org + TraceAnalysis.org -
Posted in Certification, Complete Memory Dump Analysis, Crash Analysis Report Environment (CARE), Crash Dump Analysis, Crash Dump Patterns, Debugging, Dublin School of Security, Escalation Engineering, Malware Analysis, Malware Patterns, Memiotics (Memory Semiotics), Memoretics, Memory Analysis Forensics and Intelligence, Memory Analysis Report System, Memory Dump Analysis Services, Minidump Analysis, Security, Software Behavior Patterns, Software Technical Support, Software Trace Analysis, Software Trace Reading, Structural Memory Patterns, Structural Trace Patterns, Tools, Trace Analysis Patterns, Windows System Administration | No Comments »
Thursday, November 25th, 2010
Posted in Announcements, Complete Memory Dump Analysis, Crash Analysis Report Environment (CARE), Crash Dump Analysis, Crash Dump De-analysis, Crash Dump Patterns, Debugging, Debugging Industry, Escalation Engineering, Kernel Development, Memory Analysis Forensics and Intelligence, Memory Dump Analysis Services, Minidump Analysis, Software Behavior Patterns, Software Engineering, Software Technical Support, Software Trace Analysis, Software Troubleshooting Patterns, Tools, Trace Analysis Patterns, Vista, Windows 7, Windows Server 2008, Windows System Administration, Workaround Patterns, x64 Windows | No Comments »
Friday, November 12th, 2010
Five volumes of cross-disciplinary Anthology (dubbed by the author “The Summa Memorianica”) lay the foundation of the scientific discipline of Memoretics (study of computer memory snapshots and their evolution in time) that is also called Memory Dump and Software Trace Analysis.ca
The 5th volume contains revised, edited, cross-referenced, and thematically organized selected DumpAnalysis.org blog posts about crash dump, software trace analysis and debugging written in February 2010 - October 2010 for software engineers developing and maintaining products on Windows platforms, quality assurance engineers testing software on Windows platforms, technical support and escalation engineers dealing with complex software issues, and security researchers, malware analysts and reverse engineers. The fifth volume features:
- 25 new crash dump analysis patterns
- 11 new pattern interaction case studies (including software tracing)
- 16 new trace analysis patterns
- 7 structural memory patterns
- 4 modeling case studies for memory dump analysis patterns
- Discussion of 3 common analysis mistakes
- Malware analysis case study
- Computer independent architecture of crash analysis report service
- Expanded coverage of software narratology
- Metaphysical and theological implications of memory dump worldview
- More pictures of memory space and physicalist art
- Classification of memory visualization tools
- Memory visualization case studies
- Close reading of the stories of Sherlock Holmes: Dr. Watson’s observational patterns
- Fully cross-referenced with Volume 1, Volume 2, Volume 3, and Volume 4
Product information:
- Title: Memory Dump Analysis Anthology, Volume 5
- Author: Dmitry Vostokov
- Language: English
- Product Dimensions: 22.86 x 15.24
- Paperback: 400 pages
- Publisher: Opentask (10 December 2010)
- ISBN-13: 978-1-906717-96-4
- Hardcover: 400 pages
- Publisher: Opentask (10 December 2010)
- ISBN-13: 978-1-906717-97-1

Back cover features memory space art image Hot Computation: Memory on Fire.
- Dmitry Vostokov @ DumpAnalysis.org + TraceAnalysis.org -
Posted in Aesthetics of Memory Dumps, Announcements, Archaeology of Computer Memory, Art, Assembly Language, Books, C and C++, CDF Analysis Tips and Tricks, Categorical Debugging, Common Mistakes, Complete Memory Dump Analysis, Computer Science, Crash Analysis Report Environment (CARE), Crash Dump Analysis, Crash Dump De-analysis, Crash Dump Patterns, Debugging, Debugging Methodology, Debugging Slang, Deep Down C++, Dr. Watson, Dublin School of Security, Education and Research, Escalation Engineering, Fun with Crash Dumps, Fun with Debugging, Fun with Software Traces, General Memory Analysis, Hermeneutics of Memory Dumps and Traces, Images of Computer Memory, Kernel Development, Malware Analysis, Malware Patterns, Mathematics of Debugging, Memiotics (Memory Semiotics), Memoidealism, Memoretics, Memory Analysis Culture, Memory Analysis Forensics and Intelligence, Memory Analysis Report System, Memory Diagrams, Memory Dreams, Memory Dump Analysis Jobs, Memory Dump Analysis Services, Memory Dump Analysis and History, Memory Dumps in Movies, Memory Dumps in Myths, Memory Religion (Memorianity), Memory Space Art, Memory Systems Language, Memory Visualization, Memory and Glitches, Memuonics, Metaphysical Society of Ireland, Minidump Analysis, Movies and Debugging, Multithreading, Museum of Debugging, Music for Debugging, Music of Computation, New Acronyms, New Words, Paleo-debugging, Pattern Models, Pattern Prediction, Philosophy, Physicalist Art, Psychoanalysis of Software Maintenance and Support, Publishing, Science of Memory Dump Analysis, Science of Software Tracing, Security, Software Architecture, Software Behavior Patterns, Software Chorography, Software Chorology, Software Defect Construction, Software Engineering, Software Generalist, Software Maintenance Institute, Software Narratology, Software Technical Support, Software Trace Analysis, Software Trace Analysis and History, Software Trace Deconstruction, Software Trace Reading, Software Trace Visualization, Software Tracing for Dummies, Software Troubleshooting Patterns, Software Victimology, Stack Trace Collection, Structural Memory Analysis and Social Sciences, Structural Memory Patterns, Structural Trace Patterns, Systems Thinking, Testing, Theology, Tool Objects, Tools, Trace Analysis Patterns, Training and Seminars, Troubleshooting Methodology, Uses of UML, Victimware, Virtualization, Vista, Visual Dump Analysis, Webinars, WinDbg Scripts, WinDbg Tips and Tricks, WinDbg for GDB Users, Windows 7, Windows Server 2008, Windows System Administration, Workaround Patterns, x64 Windows | No Comments »
Saturday, October 23rd, 2010
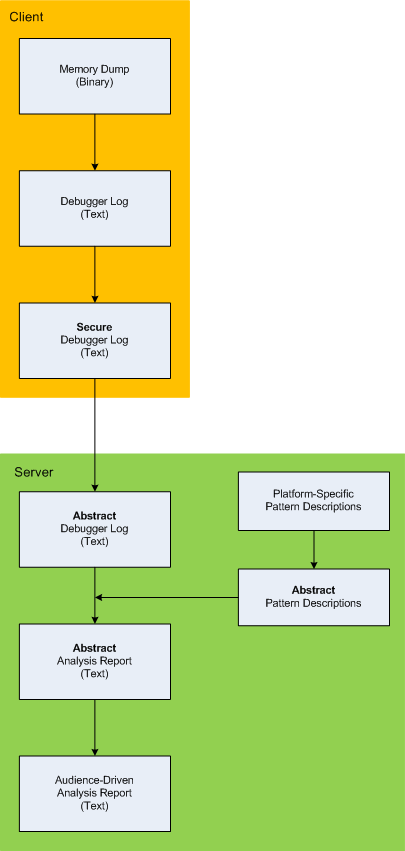
Here is the description of a high-level architecture of the previously announced project CARE (Crash Analysis Report Environment). To remind, the main idea of the project is to process memory dumps on a client to save debugger logs. They can be sent to a server for pattern-driven analysis of software behaviour. Textual logs can also be inspected by a client security team before sending. Certain sensitive information can be excluded or modified to have generic meaning according to the built-in processing rules like renaming (for example, server names and folders). Before processing, verified secured logs are converted to abstract debugger logs. Abstracting platform-specific debugger log format allows reuse of the same architecture for different computer platforms. We call it CIA (Computer Independent Architecture). Do not confuse it with ICA (Independent Computer Architecture) and CIA acronym is more appropriate for memory analysis (like similar MAFIA acronym, Memory Analysis Forensics and Intelligence Architecture). These abstract logs are checked for various patterns (in abstracted form) using abstract debugger commands and an abstract report is generated according to various checklists. Abstract reports are then converted to structured reports for the required audience level. Abstract memory analysis pattern descriptions are prepared from platform-specific pattern descriptions. In certain architectural component deployment configurations both client and server parts can reside on the same machine. Here’s the simple diagram depicting the flow of processing:
- Dmitry Vostokov @ DumpAnalysis.org + TraceAnalysis.org -
Posted in Announcements, Crash Analysis Report Environment (CARE), Crash Dump Analysis, Crash Dump Patterns, Debugging, Memory Analysis Forensics and Intelligence, New Acronyms, Security, Software Architecture, Software Behavior Patterns, Software Technical Support, Structural Memory Patterns, Tools | No Comments »
Tuesday, October 5th, 2010
The choice of webinars below mostly reflects my personal preferences and long time desire to speak on topics like systems thinking, troubleshooting tool design and development. The other topic about BSOD minidump analysis was requested by participants in an ongoing survey. There will be more topics in 2011. All forthcoming webinars will be hosted by Memory Dump Analysis Services. The planning list includes:
Systems Thinking in Memory Dump and Software Trace Analysis
Software Troubleshooting and Debugging Tools: Objects, Components, Patterns and Frameworks with UML
- UML basics
- DebugWare patterns
- Unified Troubleshooting Framework
- RADII software development process
- Hands-on exercise: designing and building a tool
Blue Screen Of Death Analysis Done Right: Minidump Investigation for System Administrators
- Making sense of !analyze –v output
- Get extra troubleshooting information with additional WinDbg commands
- Guessing culprits with raw stack analysis
- Who’s responsible: hardware or software?
- Checklist and patterns
- Including hands-on exercises: send your own minidumps
More detailed information will be available soon.
- Dmitry Vostokov @ DumpAnalysis.org + TraceAnalysis.org -
Posted in Announcements, CDF Analysis Tips and Tricks, Common Mistakes, Common Questions, Crash Analysis Report Environment (CARE), Crash Dump Analysis, Crash Dump De-analysis, Crash Dump Patterns, Crash Dumps for Dummies, DebugWare Patterns, Debugging, Debugging Industry, Debugging Methodology, Escalation Engineering, General Memory Analysis, Hermeneutics of Memory Dumps and Traces, Memory Systems Language, Minidump Analysis, Software Architecture, Software Behavior Patterns, Software Engineering, Software Technical Support, Software Trace Analysis, Software Tracing for Dummies, Structural Memory Patterns, Systems Thinking, Tools, Trace Analysis Patterns, Training and Seminars, Troubleshooting Methodology, Vista, Webinars, WinDbg Tips and Tricks, Windows 7, Windows Server 2008, Windows System Administration, x64 Windows | No Comments »
Friday, September 3rd, 2010
This forthcoming full color book is the complete transcript of a Webinar organized by Memory Dump Analysis Services (www.DumpAnalysis.com).
It discusses user vs. kernel vs. physical (complete) memory space, challenges of complete memory dump analysis, common WinDbg commands, patterns and pattern-driven analysis methodology, common mistakes, fiber bundles, DumpAnalysis.org case studies and illustrates step by step a hands-on exercise in a complete memory dump analysis.
- Title: Fundamentals of Complete Crash and Hang Memory Dump Analysis
- Author: Dmitry Vostokov
- Publisher: OpenTask (October 2010)
- Language: English
- Product Dimensions: 28.0 x 21.6
- Paperback: 48 pages
- ISBN-13: 978-1906717155
- Dmitry Vostokov @ DumpAnalysis.org + TraceAnalysis.org -
Posted in Announcements, Assembly Language, Books, Common Mistakes, Complete Memory Dump Analysis, Crash Analysis Report Environment (CARE), Crash Dump Analysis, Crash Dump Patterns, Debugging, Escalation Engineering, Software Technical Support, Stack Trace Collection, Tools, Training and Seminars, Webinars, WinDbg Tips and Tricks, Windows 7, Windows Server 2008, x64 Windows | No Comments »
Sunday, July 11th, 2010
Our future sponsor has been registered in Ireland and has its own independent website and logo: DumpAnalysis.com

More information will be available later this month.
- Dmitry Vostokov @ DumpAnalysis.org + TraceAnalysis.org -
Posted in Announcements, Crash Analysis Report Environment (CARE), Crash Dump Analysis, Crash Dump De-analysis, Debugging, Education and Research, Escalation Engineering, Hardware, Kernel Development, Linux Crash Corner, Mac Crash Corner, Memory Analysis Forensics and Intelligence, Memory Dump Analysis Services, Minidump Analysis, Security, Software Engineering, Software Technical Support, Software Trace Analysis, Testing, Tools, Training and Seminars, Vista, Windows 7, Windows Server 2008, Windows System Administration, x64 Windows | No Comments »
Wednesday, June 16th, 2010
Adding AI. Analysis Improvement.
After reading earlier today Windows Internals pages about system audit an idea came to my mind in the evening to provide audit services for memory dump and software trace analysis. One mind is good but two are better, especially if the second is a pattern-driven AI. Here are possible problem scenarios:
Problem: You are not satisfied with a crash report.
Problem: Your critical issue is escalated to the VP level. Engineers analyze memory dumps and software traces. No definite conclusion so far. You want to be sure that nothing has been omitted from the analysis.
Problem: You analyze a system dump or a software trace. You need a second pair of eyes but don’t want to send your memory dump due to your company security policies.
Other scenarios (use cases) will be added as soon as I see the service fit to the realities of software technical support.
I plan to make this service operational in July - August, 2010. Prices to be announced soon.
- Dmitry Vostokov @ DumpAnalysis.org + TraceAnalysis.org -
Posted in .NET Debugging, Announcements, Common Mistakes, Complete Memory Dump Analysis, Crash Analysis Report Environment (CARE), Crash Dump Analysis, Crash Dump De-analysis, Crash Dump Patterns, Debugging, Escalation Engineering, Minidump Analysis, Software Behavior Patterns, Software Engineering, Software Technical Support, Software Trace Analysis, Software Troubleshooting Patterns, Tools, Trace Analysis Patterns | 1 Comment »
Sunday, May 30th, 2010
Finally, after careful consideration, I’ve come up with the topic that has been neglected so far but at the same time important for both camps (kernel space and user space, including managed space): complete memory dump and software trace analysis. I plan to publish the first webinar agenda early in July and deliver the webinar in August (the date should be finalized by mid July).
PS. Sailing memory spaces under an RGB flag 

- Dmitry Vostokov @ DumpAnalysis.org + TraceAnalysis.org -
Posted in Announcements, CDF Analysis Tips and Tricks, Crash Analysis Report Environment (CARE), Crash Dump Analysis, Crash Dump Patterns, Debugging, DumpAnalysis and TraceAnalysis Logos, Escalation Engineering, Software Behavior Patterns, Software Technical Support, Software Trace Analysis, Software Troubleshooting Patterns, Tools, Trace Analysis Patterns, Training and Seminars, WinDbg Scripts, WinDbg Tips and Tricks | 2 Comments »
Sunday, April 18th, 2010
OpenTask to offer first 3 volumes of Memory Dump Analysis Anthology in one set:


The set is available exclusively from OpenTask e-Commerce web site starting from June. Individual volumes are also available from Amazon, Barnes & Noble and other bookstores worldwide.
Product information:
- Title: Modern Memory Dump and Software Trace Analysis: Volumes 1-3
- Author: Dmitry Vostokov
- Language: English
- Product Dimensions: 22.86 x 15.24
- Paperback: 1600 pages
- Publisher: Opentask (31 May 2010)
- ISBN-13: 978-1-906717-99-5
Information about individual volumes:
- Dmitry Vostokov @ DumpAnalysis.org + TraceAnalysis.org -
Posted in .NET Debugging, Aesthetics of Memory Dumps, Announcements, AntiPatterns, Art, Assembly Language, Books, Bugchecks Depicted, C and C++, CDA Pattern Classification, CDF Analysis Tips and Tricks, Categorical Debugging, Certification, Citrix, Code Reading, Common Mistakes, Computational Ghosts and Bug Hauntings, Computer Science, Countefactual Debugging, Crash Analysis Report Environment (CARE), Crash Dump Analysis, Crash Dump Patterns, Crash Dumps for Dummies, Data Recovery, DebugWare Patterns, Debugging, Debugging Methodology, Debugging Slang, Deep Down C++, Dictionary of Debugging, Dr. Watson, Education and Research, Escalation Engineering, Fun with Crash Dumps, Futuristic Memory Dump Analysis, GDB for WinDbg Users, Hardware, History, Horrors of Computation, Hyper-V, Intelligent Memory Movement, Kernel Development, Laws of Troubleshooting and Debugging, Mathematics of Debugging, Memiotics (Memory Semiotics), Memoidealism, Memoretics, Memory Analysis Culture, Memory Analysis Forensics and Intelligence, Memory Auralization, Memory Dump Analysis Jobs, Memory Religion (Memorianity), Memory Space Art, Memory Space Music, Memory Systems Language, Memory Visualization, Memuonics, Minidump Analysis, Multithreading, Music for Debugging, Music of Computation, New Acronyms, New Words, Occult Debugging, Philosophy, Psi-computation, Publishing, Science of Memory Dump Analysis, Science of Software Tracing, Security, Software Architecture, Software Defect Construction, Software Engineering, Software Generalist, Software Maintenance Institute, Software Narratology, Software Technical Support, Software Trace Analysis, Software Trace Visualization, Software Tracing for Dummies, Software Victimology, Stack Trace Collection, Testing, Tools, Trace Analysis Patterns, Training and Seminars, Troubleshooting Methodology, Victimware, Virtualization, Vista, Visual Dump Analysis, WinDbg Scripts, WinDbg Tips and Tricks, WinDbg for GDB Users, Windows 7, Windows Server 2008, Windows System Administration | No Comments »
