Archive for the ‘Citrix’ Category
Wednesday, December 14th, 2011
Sometimes Problem Module pattern can help in troubleshooting. Problem modules (including process names) are components that due to their value adding behaviour might break normal software behaviour and therefore require some troubleshooting workarounds from minor configuration changes to complete removal. Typical examples include memory optimization services for terminal services environments or hooksware. Typically you can see main process modules in the output of !vm or !process 0 0 commands. lm command will list module names such as DLLs from a process memory dump, lmk command can give you the list of kernel space modules (for example, drivers) from kernel and complete memory dumps, and the following command lists all user space modules for each process in a complete memory dump:
!for_each_process ".process /r /p @#Process; lmu"
Of course you can also try various lm command variants if you are interested in timestamps and module information.
- Dmitry Vostokov @ DumpAnalysis.org + TraceAnalysis.org -
Posted in Citrix, Crash Dump Analysis, Crash Dump Patterns, WinDbg Scripts, WinDbg Tips and Tricks, Workaround Patterns | 1 Comment »
Friday, November 11th, 2011
This is a name for a virtual country where I’m a virtual citizen. This coined word is the latest addition to Citrixware and Citrixofication together with I Love Citrix social media logo.
- Dmitry Vostokov @ DumpAnalysis.org + TraceAnalysis.org -
Posted in Citrix, Cloud Computing, History, New Words, Social Media, Virtualization | No Comments »
Sunday, October 16th, 2011
switch(years_at_citrix)

{

  case 5:

  write_blog_post(”I’ve just passed 5 year mark … “);

  wait_for_certificate();

  write_blog_post(”Shortly after celebrating 5 years … “);

  break;

  case 6:

  write_blog_post(”Threads in my process run very fast. Not long ago … “);

  break;

  case 7:

  write_blog_post(”Transition to kernel mode and space … “);

  break;

  case 8:

  write_blog_posts(”A byte has passed”, “8 bits of Citrix”, … “);

  break;

  case 9:

  // … TBD
}
No default case label in the code yet.
- Dmitry Vostokov @ DumpAnalysis.org + TraceAnalysis.org -
Posted in Announcements, Citrix, Crash Dump Analysis, Debugging, History, Software Technical Support, Software Trace Analysis | 3 Comments »
Saturday, June 25th, 2011
This pattern description is short. Pleiades is a cluster of modules in lm WinDbg command output that serve similar function, like print drivers in print spooler or Citrix printing services. Usually we know that anyone of them could be at fault. Another example is a group of process modules in a complete memory dump serving the same function in separate terminal services sessions.
- Dmitry Vostokov @ DumpAnalysis.org + TraceAnalysis.org -
Posted in Citrix, Complete Memory Dump Analysis, Crash Dump Analysis, Crash Dump Patterns, Debugging | No Comments »
Sunday, April 17th, 2011
I’m pleased to announce that MDAA, Volume 5 is available in PDF format:
www.dumpanalysis.org/Memory+Dump+Analysis+Anthology+Volume+5
It features:
- 25 new crash dump analysis patterns
- 11 new pattern interaction case studies (including software tracing)
- 16 new trace analysis patterns
- 7 structural memory patterns
- 4 modeling case studies for memory dump analysis patterns
- Discussion of 3 common analysis mistakes
- Malware analysis case study
- Computer independent architecture of crash analysis report service
- Expanded coverage of software narratology
- Metaphysical and theological implications of memory dump worldview
- More pictures of memory space and physicalist art
- Classification of memory visualization tools
- Memory visualization case studies
- Close reading of the stories of Sherlock Holmes: Dr. Watson’s observational patterns
- Fully cross-referenced with Volume 1, Volume 2, Volume 3, and Volume 4
Its table of contents is available here:
www.dumpanalysis.org/MDAA/MDA-Anthology-V5-TOC.pdf
Paperback and hardcover versions should be available in a week or two. I also started working on Volume 6 that should be available in November-December.
- Dmitry Vostokov @ DumpAnalysis.org + TraceAnalysis.org -
Posted in Aesthetics of Memory Dumps, Analysis Notation, Announcements, AntiPatterns, Archaeology of Computer Memory, Art, Assembly Language, Best Practices, Books, C and C++, CDF Analysis Tips and Tricks, Categorical Debugging, Citrix, Common Mistakes, Common Questions, Complete Memory Dump Analysis, Computer Forensics, Computer Science, Crash Analysis Report Environment (CARE), Crash Dump Analysis, Crash Dump De-analysis, Crash Dump Patterns, Crash Dumps for Dummies, Cyber Warfare, Debugging, Debugging Bureau, Debugging Industry, Debugging Methodology, Debugging Slang, Debugging Trends, Deep Down C++, Dr. Watson, Dublin School of Security, Education and Research, Escalation Engineering, Fun with Crash Dumps, Fun with Debugging, Fun with Software Traces, General Memory Analysis, Hermeneutics of Memory Dumps and Traces, Images of Computer Memory, Kernel Development, Malware Analysis, Mathematics of Debugging, Memiotics (Memory Semiotics), Memory Analysis Forensics and Intelligence, Memory Diagrams, Memory Dump Analysis Services, Memory Dumps in Myths, Memory Space Art, Memory Systems Language, Memory Visualization, Memory and Glitches, Metaphysics of Memory Worldview, Multithreading, Music for Debugging, New Acronyms, New Debugging School, New Words, Pattern Models, Philosophy, Physicalist Art, Publishing, Reverse Engineering, Science of Memory Dump Analysis, Science of Software Tracing, Security, Software Architecture, Software Behavior Patterns, Software Chorography, Software Chorology, Software Defect Construction, Software Engineering, Software Generalist, Software Maintenance Institute, Software Narratology, Software Technical Support, Software Trace Analysis, Software Trace Reading, Software Trace Visualization, Software Tracing for Dummies, Software Troubleshooting Patterns, Software Victimology, Structural Memory Patterns, Structural Trace Patterns, Systems Thinking, Testing, The Way of Philip Marlowe, Tools, Trace Analysis Patterns, Training and Seminars, Troubleshooting Methodology, Victimware, Vista, Webinars, WinDbg Scripting Extensions, WinDbg Scripts, WinDbg Tips and Tricks, WinDbg for GDB Users, Windows 7, Windows Server 2008, Windows System Administration, Workaround Patterns, x64 Windows | No Comments »
Thursday, February 3rd, 2011
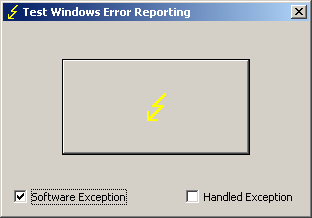
TestDefaultDebugger has been updated to version 2.0 with the following new features:
- Renamed to TestWER to reflect the shift from default debuggers to WER and LocalDumps (W2K8, Vista and Windows 7)
- The ability to generate software exceptions (by default TestWER generates hardware NULL pointer access violation exception)
- An option to handle generated exceptions (hardware and software) to test such scenarios
- Symbol PDB files are included in the package
Here’s an example stack trace when we select a software exception option and push the big button:
0:000> !analyze -v
[...]
EXCEPTION_RECORD:  0012f4a4 -- (.exr 0x12f4a4)

ExceptionAddress: 7742fbae (kernel32!RaiseException+0x00000058)

   ExceptionCode: e06d7363 (C++ EH exception)

  ExceptionFlags: 00000001

NumberParameters: 3

   Parameter[0]: 19930520

   Parameter[1]: 0012f83c

   Parameter[2]: 00428ef8

  pExceptionObject: 0012f83c

  _s_ThrowInfo    : 00428ef8

  Type            : int
[...]
0:000> k

ChildEBP RetAddr

0012edb4 775c5610 ntdll!KiFastSystemCallRet

0012edb8 7743a5d7 ntdll!NtWaitForMultipleObjects+0xc

0012ee54 7743a6f0 kernel32!WaitForMultipleObjectsEx+0x11d

0012ee70 774ae2a5 kernel32!WaitForMultipleObjects+0x18

0012eedc 774ae4d1 kernel32!WerpReportFaultInternal+0x16d

0012eef0 7748ff4d kernel32!WerpReportFault+0x70

0012ef7c 004187ee kernel32!UnhandledExceptionFilter+0x1b5

0012f2b4 004161e8 TestWER!abort+0x10f

0012f2e4 004130cb TestWER!terminate+0x33

0012f2ec 7748febe TestWER!__CxxUnhandledExceptionFilter+0x3c

0012f374 775d7fc1 kernel32!UnhandledExceptionFilter+0x127

0012f37c 77569bdc ntdll!__RtlUserThreadStart+0x6f

0012f390 77564067 ntdll!_EH4_CallFilterFunc+0x12

0012f3b8 775c5f79 ntdll!_except_handler4+0x8e

0012f3dc 775c5f4b ntdll!ExecuteHandler2+0x26

0012f48c 775c5dd7 ntdll!ExecuteHandler+0x24

0012f48c 7742fbae ntdll!KiUserExceptionDispatcher+0xf

0012f7e0 00412ac2 kernel32!RaiseException+0×58

0012f818 0041ff1f TestWER!_CxxThrowException+0×48

0012f85c 00403620 TestWER!CTestDefaultDebuggerDlg::OnBnClickedButton1+0xaf

0012f86c 0040382f TestWER!_AfxDispatchCmdMsg+0×45

0012f89c 00402df6 TestWER!CCmdTarget::OnCmdMsg+0×11c

0012f8c0 00409ef8 TestWER!CDialog::OnCmdMsg+0×1d

0012f910 0040a792 TestWER!CWnd::OnCommand+0×92

0012f9ac 00406dea TestWER!CWnd::OnWndMsg+0×36

0012f9cc 00409713 TestWER!CWnd::WindowProc+0×24

0012fa34 004097a2 TestWER!AfxCallWndProc+0×9a

0012fa54 7716fd72 TestWER!AfxWndProc+0×36

0012fa80 7716fe4a user32!InternalCallWinProc+0×23

0012faf8 77170943 user32!UserCallWinProcCheckWow+0×14b

0012fb38 77170b36 user32!SendMessageWorker+0×4b7

0012fb58 747eb4ba user32!SendMessageW+0×7c

0012fb78 747eb51c comctl32!Button_NotifyParent+0×3d

0012fb94 747eb627 comctl32!Button_ReleaseCapture+0×112

0012fbf4 7716fd72 comctl32!Button_WndProc+0xa98

0012fc20 7716fe4a user32!InternalCallWinProc+0×23

0012fc98 7717018d user32!UserCallWinProcCheckWow+0×14b

0012fcfc 7717022b user32!DispatchMessageWorker+0×322

0012fd0c 771651f5 user32!DispatchMessageW+0xf

0012fd30 0040618c user32!IsDialogMessageW+0×586

0012fd44 004071e2 TestWER!CWnd::IsDialogMessageW+0×32

0012fd50 00402dd3 TestWER!CWnd::PreTranslateInput+0×2d

0012fd64 00408dc1 TestWER!CDialog::PreTranslateMessage+0×9a

0012fd78 00403f35 TestWER!CWnd::WalkPreTranslateTree+0×23

0012fd90 00404090 TestWER!AfxInternalPreTranslateMessage+0×41

0012fd9c 00403f80 TestWER!CWinThread::PreTranslateMessage+0xd

0012fda8 004040dd TestWER!AfxPreTranslateMessage+0×19

0012fdb8 00408598 TestWER!AfxInternalPumpMessage+0×2d

0012fde0 00403440 TestWER!CWnd::RunModalLoop+0xc5

0012fe2c 004204ee TestWER!CDialog::DoModal+0×12d

0012fee4 0041fdf5 TestWER!CTestDefaultDebuggerApp::InitInstance+0xce

0012fef8 0040fc3e TestWER!AfxWinMain+0×48

0012ff88 7743d0e9 TestWER!__tmainCRTStartup+0×112

0012ff94 775a19bb kernel32!BaseThreadInitThunk+0xe

0012ffd4 775a198e ntdll!__RtlUserThreadStart+0×23

0012ffec 00000000 ntdll!_RtlUserThreadStart+0×1b
Here’s WinDbg output when we choose to handle exceptions:
0:001> g

(628.a90): Access violation - code c0000005 (first chance)

First chance exceptions are reported before any exception handling.

This exception may be expected and handled.

TestWER64!CTestDefaultDebuggerDlg::OnBnClickedButton1+0×44:

00000001`40024774 c704250000000000000000 mov dword ptr [0],0 ds:00000000`00000000=????????
0:000> g

(628.a90): C++ EH exception - code e06d7363 (first chance)
You can download TestWER package from Citrix support web site:
Download TestWER 2.0
- Dmitry Vostokov @ DumpAnalysis.org + TraceAnalysis.org -
Posted in Announcements, Citrix, Crash Dump Analysis, Debugging, Software Technical Support, Tools, Vista, Windows 7, Windows Server 2008 | No Comments »
Thursday, December 23rd, 2010
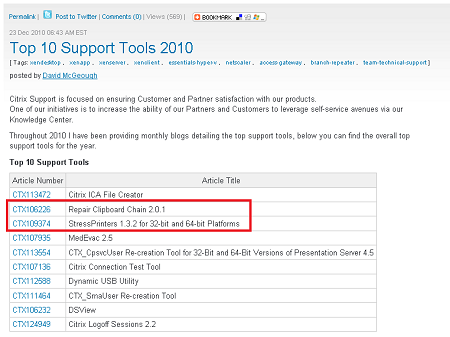
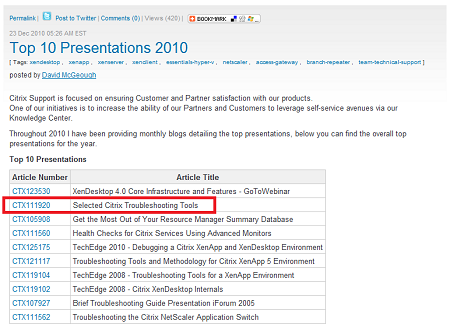
I’m very excited to announce that 2 my tools Repair Clipboard Chain 2.0.1, StressPrinters 1.3.2 for 32-bit and 64-bit Platforms and Selected Citrix Troubleshooting Tools presentation are in top 3 list:
- Dmitry Vostokov @ DumpAnalysis.org + TraceAnalysis.org -
Posted in Announcements, Citrix, Presentations, Software Technical Support, Tools | No Comments »
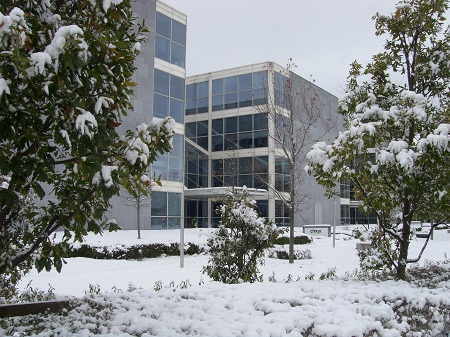
Friday, December 3rd, 2010
This morning it was -2 with lost of snow left from the yesterday spike. Here is Dublin Citrix Office in Eastpoint Business Park as seen from outside:
- Dmitry Vostokov @ DumpAnalysis.org + TraceAnalysis.org -
Posted in Citrix, Debugging and Nature, History | No Comments »
Thursday, November 18th, 2010
Designed in Terminal (services) font:

It is now a part of my Twitter profile too.
- Dmitry Vostokov @ DumpAnalysis.org + TraceAnalysis.org -
Posted in Announcements, Citrix, History, Social Media | No Comments »
Wednesday, October 13th, 2010
I now transition to 8 similar to 7-to-8 transition from user to kernel space (new dialectical quality):
switch(years_at_citrix)

{

  case 5:

  write_blog_post(”I’ve just passed 5 year mark … “);

  wait_for_certificate();

  write_blog_post(”Shortly after celebrating 5 years … “);

  break;

  case 6:

  write_blog_post(”Threads in my process run very fast. Not long ago … “);

  break;

  case 7:

  write_blog_post(”Transition to kernel mode and space … “);

  break;

  case 8:

  // … TBD
}
I also abandoned monthly counting started earlier because in kernel space time is counted in clock cycles per quantum unit where the latter is 1/3 of a clock tick (Windows Internals, 5th edition, pp. 406 - 408) :-)
- Dmitry Vostokov @ DumpAnalysis.org + TraceAnalysis.org -
Posted in Announcements, Citrix, Crash Dump Analysis, Debugging, Escalation Engineering, History, Software Architecture, Software Engineering, Software Technical Support, Software Trace Analysis, Tools | No Comments »
Sunday, September 19th, 2010
Finally, after the delay, the issue is available in print on Amazon and through other sellers:
Debugged! MZ/PE: Multithreading

- Dmitry Vostokov @ DumpAnalysis.org + TraceAnalysis.org -
Posted in .NET Debugging, Announcements, CDF Analysis Tips and Tricks, Citrix, Computer Science, Debugged! MZ/PE, Debugging, Memory Dump Analysis Services, Multithreading, Publishing, Science of Software Tracing, Software Trace Analysis, Software Trace Visualization, Tools, Trace Analysis Patterns, WinDbg Tips and Tricks | No Comments »
Tuesday, May 25th, 2010
Finally Citrix has published a tool (written by my colleague Colm Naish, lead escalation engineer) that allows controlled injection of events into CDF (ETW) trace message stream. This is useful in many troubleshooting scenarios where we need to rely on Significant Event and Anchor Message analysis patterns to partition traces into artificial Activity Regions to start our analysis with. This is also analogous for the imposition of the external time on the stream of tracing events from software narratology perspective:
CDFMarker On Demand - For XenApp and XenDesktop
- Dmitry Vostokov @ DumpAnalysis.org + TraceAnalysis.org -
Posted in Announcements, CDF Analysis Tips and Tricks, Citrix, Debugging, Escalation Engineering, Software Engineering, Software Narratology, Software Technical Support, Software Trace Analysis, Software Trace Reading, Tools, Trace Analysis Patterns | 1 Comment »
Thursday, May 6th, 2010
Some recent news about StressPrinters tool designed according to Tool Façade DebugWare pattern:
“HP tests its print drivers with the StressPrinters tool provided by Citrix to simulate a user logon where multiple printers are autocreated concurrently.”
Source
- Dmitry Vostokov @ DumpAnalysis.org + TraceAnalysis.org -
Posted in Citrix, DebugWare Patterns, Debugging, Testing, Tools | No Comments »
Monday, May 3rd, 2010
Modern pattern-driven software trace analysis on Microsoft and Citrix platforms urgently requires a practical guide and OpenTask plans to publish this summer the following book in both Practical Foundations and Systematic Software Fault Analysis series:
- Title: Citrix Common Diagnostic Facility (CDF) and Microsoft Event Tracing for Windows (ETW) Software Trace Analysis: Practical Foundations
- Author: Dmitry Vostokov
- Publisher: Opentask (August 2010)
- Language: English
- Product Dimensions: 22.86 x 15.24
- ISBN: 1906717176
- ISBN-13: 978-1906717179
- Paperback: 200 pages
- Dmitry Vostokov @ DumpAnalysis.org + TraceAnalysis.org -
Posted in Announcements, Books, Citrix, Escalation Engineering, Publishing, Software Engineering, Software Technical Support, Software Trace Analysis, Software Tracing for Dummies, Testing, Tools, Trace Analysis Patterns, Training and Seminars, Windows System Administration | No Comments »
Tuesday, April 20th, 2010
The following tool published by Citrix follows DebugWare patterns in its overall architecture and design and was implemented by a team of engineers using RADII process:
SsOnExpert - Single Sign-On XenApp Plug-in Troubleshooting Tool
- Dmitry Vostokov @ DumpAnalysis.org + TraceAnalysis.org -
Posted in Announcements, Citrix, DebugWare Patterns, Debugging, Debugging Methodology, Escalation Engineering, Software Architecture, Software Engineering, Software Maintenance Institute, Software Technical Support, Tools, Troubleshooting Methodology | No Comments »
Sunday, April 18th, 2010
OpenTask to offer first 3 volumes of Memory Dump Analysis Anthology in one set:


The set is available exclusively from OpenTask e-Commerce web site starting from June. Individual volumes are also available from Amazon, Barnes & Noble and other bookstores worldwide.
Product information:
- Title: Modern Memory Dump and Software Trace Analysis: Volumes 1-3
- Author: Dmitry Vostokov
- Language: English
- Product Dimensions: 22.86 x 15.24
- Paperback: 1600 pages
- Publisher: Opentask (31 May 2010)
- ISBN-13: 978-1-906717-99-5
Information about individual volumes:
- Dmitry Vostokov @ DumpAnalysis.org + TraceAnalysis.org -
Posted in .NET Debugging, Aesthetics of Memory Dumps, Announcements, AntiPatterns, Art, Assembly Language, Books, Bugchecks Depicted, C and C++, CDA Pattern Classification, CDF Analysis Tips and Tricks, Categorical Debugging, Certification, Citrix, Code Reading, Common Mistakes, Computational Ghosts and Bug Hauntings, Computer Science, Countefactual Debugging, Crash Analysis Report Environment (CARE), Crash Dump Analysis, Crash Dump Patterns, Crash Dumps for Dummies, Data Recovery, DebugWare Patterns, Debugging, Debugging Methodology, Debugging Slang, Deep Down C++, Dictionary of Debugging, Dr. Watson, Education and Research, Escalation Engineering, Fun with Crash Dumps, Futuristic Memory Dump Analysis, GDB for WinDbg Users, Hardware, History, Horrors of Computation, Hyper-V, Intelligent Memory Movement, Kernel Development, Laws of Troubleshooting and Debugging, Mathematics of Debugging, Memiotics (Memory Semiotics), Memoidealism, Memoretics, Memory Analysis Culture, Memory Analysis Forensics and Intelligence, Memory Auralization, Memory Dump Analysis Jobs, Memory Religion (Memorianity), Memory Space Art, Memory Space Music, Memory Systems Language, Memory Visualization, Memuonics, Minidump Analysis, Multithreading, Music for Debugging, Music of Computation, New Acronyms, New Words, Occult Debugging, Philosophy, Psi-computation, Publishing, Science of Memory Dump Analysis, Science of Software Tracing, Security, Software Architecture, Software Defect Construction, Software Engineering, Software Generalist, Software Maintenance Institute, Software Narratology, Software Technical Support, Software Trace Analysis, Software Trace Visualization, Software Tracing for Dummies, Software Victimology, Stack Trace Collection, Testing, Tools, Trace Analysis Patterns, Training and Seminars, Troubleshooting Methodology, Victimware, Virtualization, Vista, Visual Dump Analysis, WinDbg Scripts, WinDbg Tips and Tricks, WinDbg for GDB Users, Windows 7, Windows Server 2008, Windows System Administration | No Comments »
Wednesday, April 14th, 2010
Time flows fast and I have refined my code I wrote at 6 year anniversary to include finer monthly tracing:
switch (months_at_citrix)

{

  case 60:

    write_blog_post(”I’ve just passed 5 year mark … “);

    wait_for_certificate();

    write_blog_post(”Shortly after celebrating 5 years … “);

    break;

  case 72:

    write_blog_post(”Threads in my process run very fast. Not long ago … “);

    break;

  case 78:

    write_blog_post(”Time flows fast and I have refined my code …“);

    break;

case 84:

    // … TBD

}
- Dmitry Vostokov @ DumpAnalysis.org + TraceAnalysis.org -
Posted in Announcements, Citrix, Crash Dump Analysis, Debugging, Escalation Engineering, History, Software Engineering, Software Technical Support, Software Trace Analysis | 1 Comment »
Thursday, April 8th, 2010
“Capturing delicate moments, one gives birth to a poetry of traces …”
Ange Leccia, Motionless Journeys, by Fabien Danesi
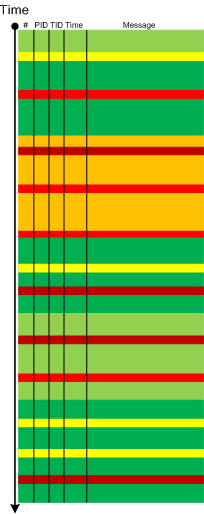
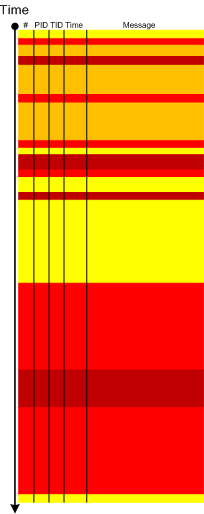
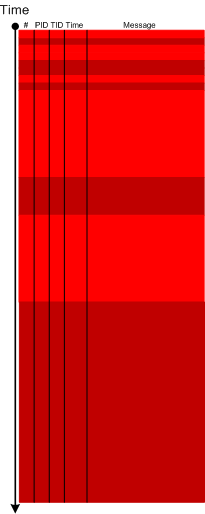
More patterns from software narratology. Now we illustrate Defamiliarizing Effect where we see sudden unfamiliar trace statements across familiar landscape of characteristic blocks and activity regions:
/familar traces/
/new trace from a problem system/
- Dmitry Vostokov @ DumpAnalysis.org + TraceAnalysis.org -
Posted in CDF Analysis Tips and Tricks, Citrix, Debugging, Software Narratology, Software Trace Analysis, Software Trace Visualization, Trace Analysis Patterns | 1 Comment »
Thursday, April 8th, 2010
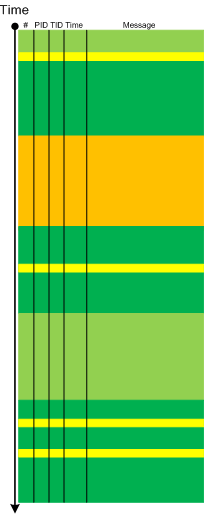
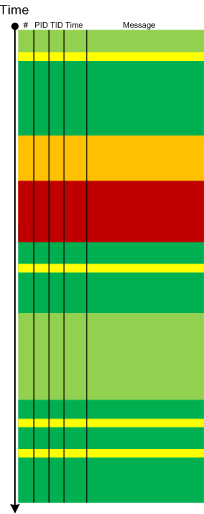
Metaphorical bijection from literary narratology to software narratology provides a pattern of Background and Foreground Components. This can be easily illustrated on pseudo-trace color diagrams. Suppose we troubleshoot a graphical issue using an ETW trace containing the output from all components of the problem system. Graphic components and their messages are foreground for a trace viewer (a person) against numerous background components (for example, database, file and registry access, shown in shades of green):
Trace viewers (for example, CDFAnalyzer) can filter out background component messages and present only foreground components (that I propose to call component foregrounding):
Of course, this process is iterative and parts of what once was foreground become background and candidates for further filtering:
- Dmitry Vostokov @ DumpAnalysis.org + TraceAnalysis.org -
Posted in CDF Analysis Tips and Tricks, Citrix, Debugging, Software Narratology, Software Trace Analysis, Software Trace Visualization, Tools, Trace Analysis Patterns | 2 Comments »