Archive for the ‘Software Trace Analysis’ Category
Sunday, April 11th, 2021
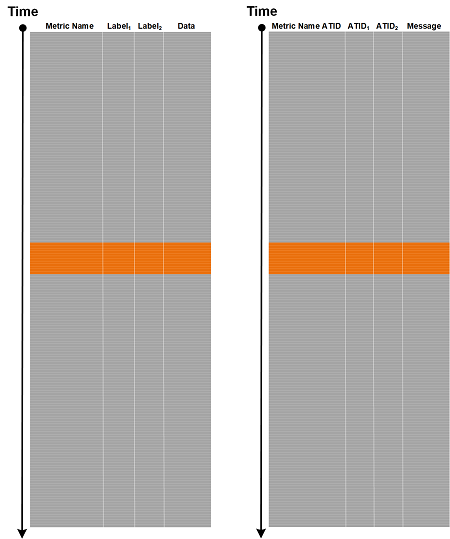
Most of trace and log analysis pattern illustrations using Dia|gram language are of these two general forms:

Although the first form represents typical ETW trace attributes, the analysis pattern descriptions are usually independent of attribute name semantics. It, therefore, makes sense to generalize such forms into the following Trace Schema forms, with ATIDs for Adjoint Threads of Activity for the first form, and with FIDs for Features of Activity for the second form:
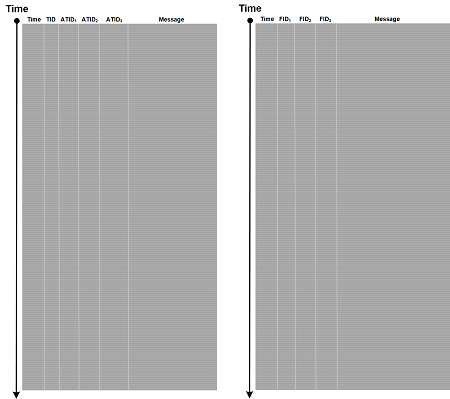
Such Trace Schemas are useful for various trace and log joins other than Trace Mask.
- Dmitry Vostokov @ DumpAnalysis.org + TraceAnalysis.org -
Posted in Data Analysis, Data Science, Databases, Log Analysis, Software Trace Analysis, Trace Analysis Patterns | Comments Off
Sunday, April 4th, 2021
When looking at trace and log messages we are usually interested in some features (for example, when doing feature engineering, but not limited to) which can be labelled via Feature IDs (FID). Messages that have the same FID value constitute Feature of Activity, similar to Thread of Activity (or Adjoint Thread of Activity).
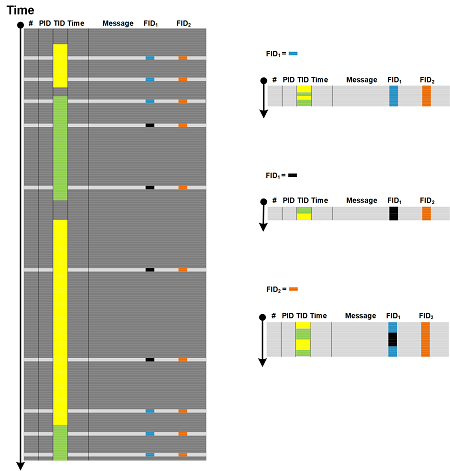
Such Features of Activity can span several (A)TIDs in contrast to Fibers of Activity which are confined to the same (A)TID and may have different FID values. Therefore, inside (A)TID there can be several Features of Activity having different FID values.
This analysis pattern serves as a base for other data science analysis patterns we add next.
- Dmitry Vostokov @ DumpAnalysis.org + TraceAnalysis.org -
Posted in Data Analysis, Data Science, Feature Engineering, Log Analysis, Software Trace Analysis, Trace Analysis Patterns | Comments Off
Sunday, March 7th, 2021
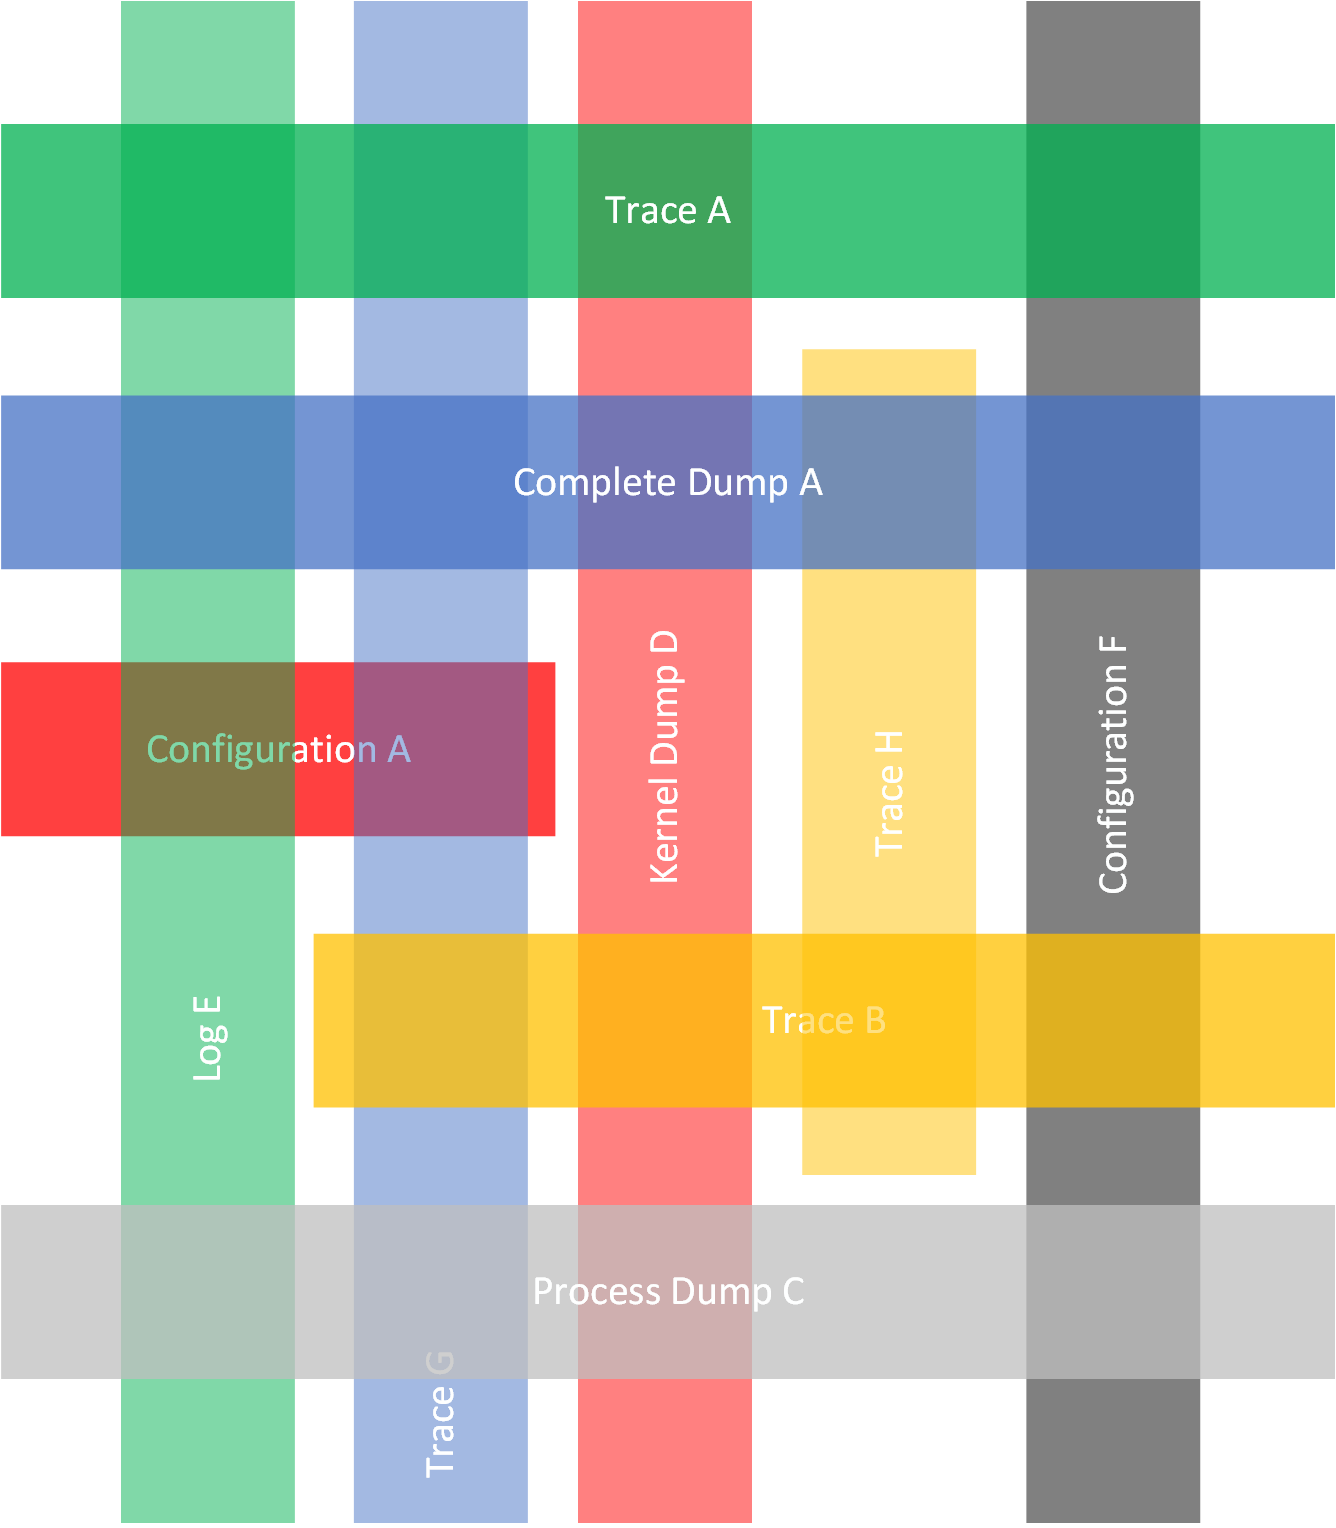
Trace Intra-Correlation may be quite elaborate and include analysis of 2-dimensional Weaves of Activity. A similar 2-dimensional metaphor can be applied to Inter-Correlation between several artefacts such as traces and logs, configuration information including infrastructure as code (Small DA+TA), telemetry and event streams, memory dumps (Adjoint Spaces, Trace Presheaf, Memory Fibration, State Dump). All these memory patches, layers, and Trace Fabrics are “sewn” together by Braids, Threads, Adjoint Threads, Strands, Cords, and Weaves of Activities. We call this pattern Trace Quilt but analogy with quilting and quilts.
- Dmitry Vostokov @ DumpAnalysis.org + TraceAnalysis.org -
Posted in Log Analysis, Software Trace Analysis, Trace Analysis Patterns | Comments Off
Sunday, January 10th, 2021
Various metrics are covered by Counter Value trace and log analysis pattern. However, metric labels or metric metadata as implemented by monitoring tools such as Prometheus can be mapped directly to Adjoint Threads of Activity in our trace and log analysis pattern catalog:
<Metric Name>{<Label Name>=<Label Value>, ...}=<Metric Value> (from Prometheus data model)
{<Metric Name ATID>=<ATID Value>, <ATID Name>=<ATID Value>, ..., <Message (Metric Value)>}
This allows the application of many trace and log analysis patterns related to threading and adjoint threading (multibraiding).
We call this analysis pattern Message Metadata. It is illustrated for time series in the following diagram where we have the same Labels for all metric names (in general labels may be different):
- Dmitry Vostokov @ DumpAnalysis.org + TraceAnalysis.org -
Posted in Log Analysis, Metrics, Monitoring, Performance Monitoring, Prometheus, Software Trace Analysis, Trace Analysis Patterns | Comments Off
Sunday, November 8th, 2020
Abstract is usually the summary of an artifact (see Trace Summary analysis pattern) or not concrete description (see Analysis Pattern Square diagram).
Accent as stress in a line of verse has its correspondence to data in Message Pattern, which can be seen as a sequence of variables and Message Invariants.
Act as a play division corresponds to Activity Regions (see also trace partitioning and Activity Theatre analysis patterns).
Action as the main story of a narrative artifact may involve a sequence of selected Significant Events, Macrofunctions, Activity Regions with Motives. In a software narratological framework for presenting software stories, action is a sequence of selected messages that constitutes a software plot (an acquired software artifact that may not be complete/full due to abridgment like restricting tracing/logging to selected components).
Adaptation as interpreting an artifact as a different one (from one media to another, or a different structure) is similar to treating memory dumps as traces/logs or vice versa as Projective Debugging.
Address as a story written for a specific group of people could be a software execution artifact explicitly acquired and adapted to some external users or Declarative Trace messages crafted for a specific team in mind (see also Embedded Comment analysis pattern).
- Dmitry Vostokov @ DumpAnalysis.org + TraceAnalysis.org -
Posted in Log Analysis, Software Narratology, Software Narratology and Literary Theory, Software Trace Analysis | No Comments »
Thursday, November 5th, 2020
Ab ovo is a software story (for example, a trace or log, a problem description, see software narratology square) that starts from the beginning of the use case events it narrates (see also Use Case Trail analysis patterns) or the start of software execution (see also Visibility Limit analysis pattern). Logging may start from some middle event of a use case, source code (see also Declarative Trace analysis pattern), or a log may be a part of a larger full trace (see also a software narratological framework for presenting software stories): in medias res. Such software stories may also have flashbacks, for example, stack traces, especially in software problem descriptions. Often, flashbacks are the only available software stories. Some tracing and logging sessions may be deliberately shortened to save space, communication throughput, or other reasons like security, similar to abridged editions of literary works (see also Abridged Dump and Missing Component analysis patterns). Such editions of software execution artifacts often hinder analysis (see Lateral Damage analysis pattern).
- Dmitry Vostokov @ DumpAnalysis.org + TraceAnalysis.org -
Posted in Log Analysis, Software Narratology, Software Narratology and Literary Theory, Software Trace Analysis | No Comments »
Sunday, October 25th, 2020
Ideally a trace or log message should contain only one piece of information including associated data. However, some Multidimensional Messages may contain unrelated information, including several Message Invariants and variable data places, for example: “Entry GetData. Error opening file: 0×5″ or “Window handle: 0xa60834 pHandler: 0×456210F0″. Such messages may be split into several independent messages and, if necessary, additional ATIDs (new Adjoint Threads of Activity) may be added like depicted in this diagram of Combed Trace:
Another example is Exception Stack Trace messages in some logging implementations.
- Dmitry Vostokov @ DumpAnalysis.org + TraceAnalysis.org -
Posted in Log Analysis, Software Trace Analysis, Software Trace Linguistics, Trace Analysis Patterns | No Comments »
Saturday, September 19th, 2020
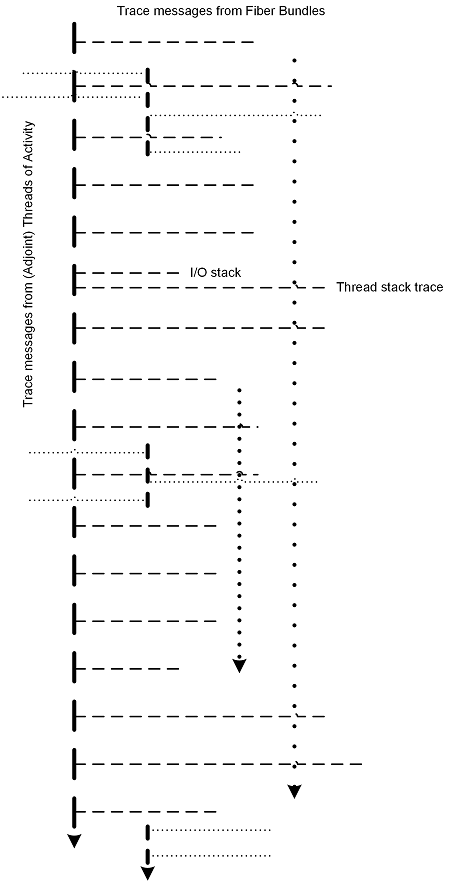
If messages from (Adjoint) Thread of Activity also have associated traces (Fiber Bundle) then the latter messages data, for example, module names, can be interlinked with corresponding Adjoint Threads of Activity, thus forming “two-dimensional” Weave of Activity.
- Dmitry Vostokov @ DumpAnalysis.org + TraceAnalysis.org -
Posted in Log Analysis, Software Trace Analysis, Trace Analysis Patterns | No Comments »
Friday, September 18th, 2020
We introduced Procedure Call Chain in Stack Trace Collection and Coupled Processes analysis patterns. It is a stack trace formed by gluing stack trace fragments (for example, from LPC/ALPC and RPC Wait Chains) after removing middleware subtraces. For example, we use the following case study (32-bit for less space), follow its Wait Chain, and construct Procedure Call Chain (we use different colors to show gluing):
b88dccb8 804e1bf2 nt!KiSwapContext+0×2f

b88dccc4 804e1c3e nt!KiSwapThread+0×8a

b88dccec 8056dff6 nt!KeWaitForSingleObject+0×1c2

b88dcd50 804dd99f nt!NtWaitForSingleObject+0×9a

b88dcd50 7c90e514 nt!KiFastCallEntry+0xfc (TrapFrame @ b88dcd64)

036ef714 7c90df5a ntdll!KiFastSystemCallRet

036ef718 7c91b24b ntdll!ZwWaitForSingleObject+0xc

036ef7a0 7c901046 ntdll!RtlpWaitForCriticalSection+0×132

036ef7a8 6648a33b ntdll!RtlEnterCriticalSection+0×46

036ef7b0 6648c2ed ipnathlp!FwLock+0xa

036ef808 6648c705 ipnathlp!FwDynPortAdd+0×1d

036ef8c4 77e799f4 ipnathlp!FwOpenDynamicFwPort+0×125

00a9ef9c 662dafa9 hnetcfg!FwOpenDynamicFwPort+0×1b

00a9f048 71a55025 hnetcfg!IcfOpenDynamicFwPort+0×6a

00a9f0e4 71a590f2 mswsock!WSPBind+0×332

00a9f200 71ab2fd7 mswsock!WSPSendTo+0×230

00a9f250 76f252c0 WS2_32!sendto+0×88

00a9f280 76f251ea DNSAPI!SendMessagePrivate+0×18d

00a9f2a0 76f2517c DNSAPI!SendUsingServerInfo+0×33

00a9f2c8 76f25436 DNSAPI!SendUdpToNextDnsServers+0×80

00a9f314 76f24dec DNSAPI!Dns_SendAndRecvUdp+0×121

00a9f34c 76f24d20 DNSAPI!Dns_SendAndRecv+0×7b

00a9f37c 76f24a7d DNSAPI!Query_SingleName+0×8b

00a9f3b0 7677373a DNSAPI!Query_Main+0×11a

00a9f3c8 7677303f dnsrslvr!ResolverQuery+0×48

00a9f8bc 77e799f4 dnsrslvr!R_ResolverQuery+0×111

00a8f4c4 76f2357b DNSAPI!R_ResolverQuery+0×1b

00a8f520 71a526c6 DNSAPI!DnsQuery_W+0×14f

00a8f554 71a5266f mswsock!HostentBlob_Query+0×29

00a8f580 71a51b0a mswsock!Rnr_DoDnsLookup+0×7d

00a8f9c8 71ab32b0 mswsock!NSPLookupServiceNext+0×533

00a8f9e0 71ab3290 WS2_32!NSPROVIDER::NSPLookupServiceNext+0×17

00a8f9fc 71ab325a WS2_32!NSPROVIDERSTATE::LookupServiceNext+0×1c

00a8fa28 71ab31f8 WS2_32!NSQUERY::LookupServiceNext+0xae

00a8fa48 76f775eb WS2_32!WSALookupServiceNextW+0×78

00a8faec 76f6a9d2 WLDAP32!GetHostByNameW+0xef

00a8fb38 76f6667b WLDAP32!OpenLdapServer+0×435

00a8fb58 76f6fb05 WLDAP32!LdapConnect+0×169

00a8fef8 76f704f3 WLDAP32!LdapBind+0×34

00a8ff20 5e95651a WLDAP32!ldap_bind_sW+0×2c

00a8ff68 5e95a887 PAUTOENR!AERobustLdapBind+0xc9

00a8ffb4 7c80b729 PAUTOENR!AEMainThreadProc+0xef

00a8ffec 00000000 kernel32!BaseThreadStart+0×37
This similar to Glued Stack Trace which is produced from fragments that belong to one stack region.
- Dmitry Vostokov @ DumpAnalysis.org + TraceAnalysis.org -
Posted in Crash Dump Analysis, Crash Dump Patterns, Software Trace Analysis | No Comments »
Sunday, September 13th, 2020
Trace and log analysis patterns may be additionally applied not only to a database like tables but also to texts (as an example of general trace and log analysis). Sentences may form trace messages with paragraphs and chapters corresponding to traditional ATIDs (IDs for Adjoint Threads of Activity) such as TID and PID in the most simple syntax mapping case, and certain sentences may be interpreted as Silent Messages.
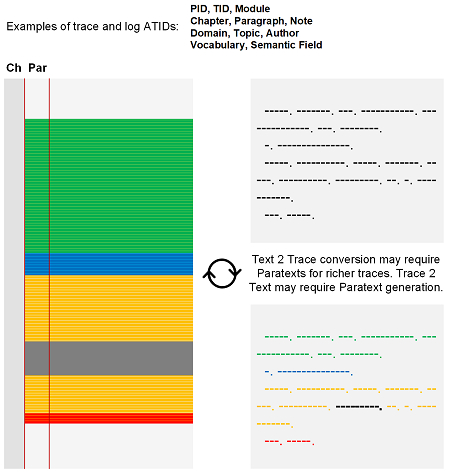
Different attribute generation schemas may be used, for example, selected vocabulary may be used to assign TID numbers. More complex cases may require paratexts, supplementary texts providing additional structure and semantic information like in the case of Paratext memory analysis pattern, the case of extended traces.
The opposite process of converting traces and logs to text is also possible with additional paratext generation if necessary. We call this two-way analysis pattern Text Trace. After converting texts to logs it is possible to apply the majority of trace and log analysis patterns from the catalog.
- Dmitry Vostokov @ DumpAnalysis.org + TraceAnalysis.org -
Posted in Crash Dump Analysis, Crash Dump Patterns, Log Analysis, Software Narratology, Software Trace Analysis, Text Analysis, Trace Analysis Patterns | No Comments »
Sunday, September 13th, 2020
Several Strands of Activity from different types of ATIDs (Adjoint Threads of Activity) combine into Cord of Activity:
Between cord and rope analogies we chose cord as having “ord” (ordinal) in it (and c as cardinal). It is also possible to combine several Cords of Activity from different traces (Trace Dimension) to form a “cable-laid rope”. We don’t introduce a separate pattern here since in the resulting Trace Mask we have new Cord of Activity due to the additionally created ATID type referencing former separate traces and logs. Data references in messages may provide additional braiding via Braids of Activity.
We started with strands (we got the idea from the discussion of ethnomathematics where strand analysis was mentioned) but then we found the following useful discussion on rope terminology: “Art and Science of Rope“.
- Dmitry Vostokov @ DumpAnalysis.org + TraceAnalysis.org -
Posted in Log Analysis, Mathematics of Debugging, Software Trace Analysis, Trace Analysis Patterns | No Comments »
Saturday, September 12th, 2020
Strand of Activity combines different Threads of Activity or Adjoint Threads of Activity of the same type.
Strands extend cable and rope composition metaphors that start with Fibers of Activity, and continue with threads and Braids of Activity.
- Dmitry Vostokov @ DumpAnalysis.org + TraceAnalysis.org -
Posted in Log Analysis, Software Trace Analysis, Trace Analysis Patterns | No Comments »
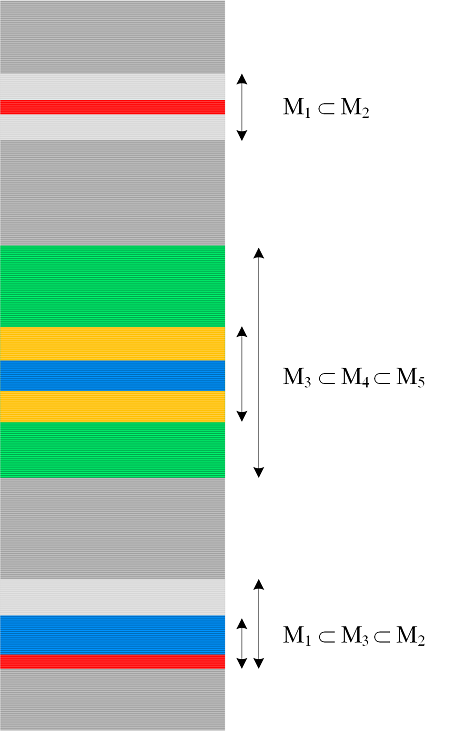
Sunday, August 23rd, 2020
Sometimes we may want to Flag a message or Activity Region, for example, using Message Annotations. In other cases we may have Activity Regions are sorted by their coordinate-wise inclusion. Or we have inclusion of Message Sets. The analysis pattern name is borrowed from flag filtration in mathematics, where we consider subsets of messages and Activity Regions as subspaces. Dia|gram pictures of Flags may even resemble flags of some countries.
- Dmitry Vostokov @ DumpAnalysis.org + TraceAnalysis.org -
Posted in Log Analysis, Mathematics of Debugging, Software Trace Analysis, Trace Analysis Patterns | No Comments »
Friday, July 31st, 2020
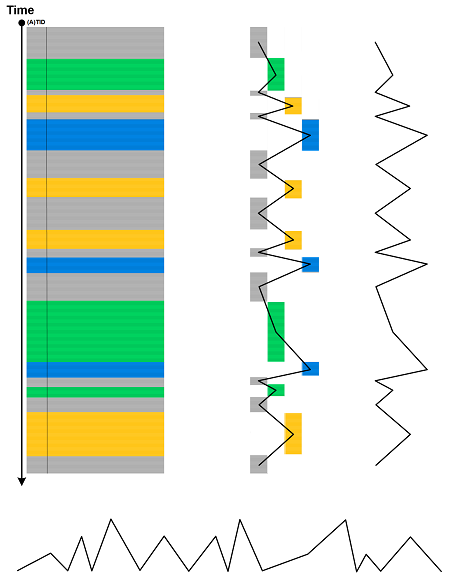
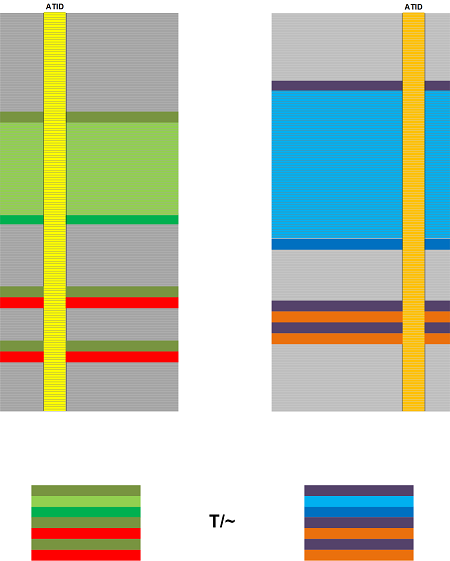
It is possible to foliate traces into separate traces having the same structure and scale (we also show corresponding Trace Fabric for the original trace):
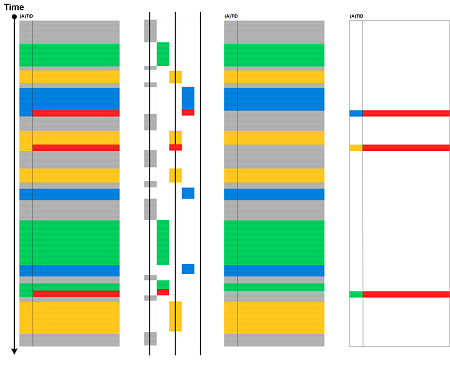
In the diagram above Trace Foliation was done for message type, for example, error and normal messages. The reverse operation of Trace Mask would produce the same original trace.
Correspondingly Trace Fabric can be foliated too giving rise to “orchestra” representation and vice versa via Trace Mask:
Bars can be added with the help of Silent Messages.
The name of this analysis pattern was also inspired by foliations in mathematics.
- Dmitry Vostokov @ DumpAnalysis.org + TraceAnalysis.org -
Posted in Log Analysis, Mathematics of Debugging, Software Trace Analysis, Trace Analysis Patterns, Trace Analysis and Music | No Comments »
Friday, July 31st, 2020
Semantic Field is a set of messages that belong to particular category or subject:
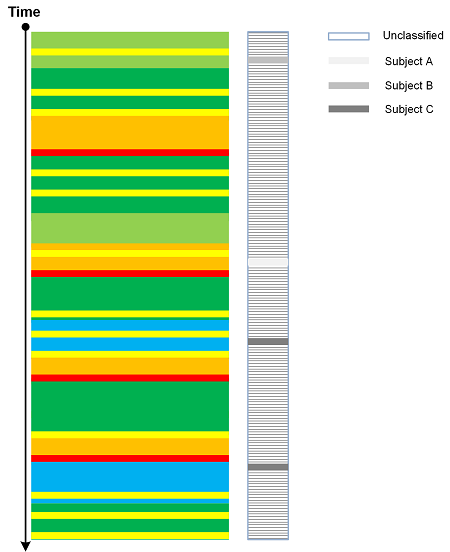
It is different from Trace Field which is a function, not an already prepared codomain of mapping.
Some Semantic Fields may be formed by the analysis of Implementation Discourse, for example using machine learning techniques.
The pattern name was inspired by semantic field in linguistics and came to our attention when reading “German Loanwords in English: An Historical Dictionary” book.
- Dmitry Vostokov @ DumpAnalysis.org + TraceAnalysis.org -
Posted in Log Analysis, Software Trace Analysis, Software Trace Linguistics, Trace Analysis Patterns | No Comments »
Friday, July 31st, 2020
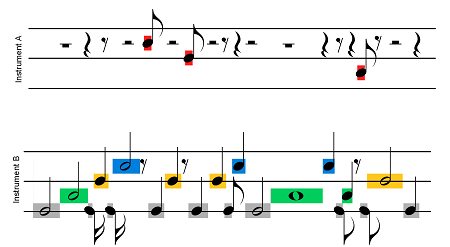
If we take Combed Trace for Thread of Activity or some Adjoint Thread of Activity and strip other message content like we did for Trace Contour log analysis pattern we get individual braids that form Trace Fabric:
We can also get a stave representation of individual braids after a counter clockwise 90 degree rotation:
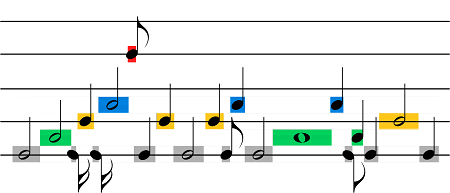
Bars can be added with the help of Silent Messages. Conversely, a musical piece can be transformed into some trace.
We mentioned “fabric” metaphor already when we introduced multibraiding.
- Dmitry Vostokov @ DumpAnalysis.org + TraceAnalysis.org -
Posted in Log Analysis, Software Trace Analysis, Trace Analysis Patterns, Trace Analysis and Music | No Comments »
Monday, July 20th, 2020
Traces and logs from diverse software systems doing different things may have similar Trace Shape despite completely different message content, especially for specific Threads of Activity or Adjoint Threads of Activity:
This may be apparent when we compare Trace Shape of Quotient Trace.
- Dmitry Vostokov @ DumpAnalysis.org + TraceAnalysis.org -
Posted in Log Analysis, Mathematics of Debugging, Software Trace Analysis, Trace Analysis Patterns, Trace Analysis and Geometry, Trace Analysis and Topology | No Comments »
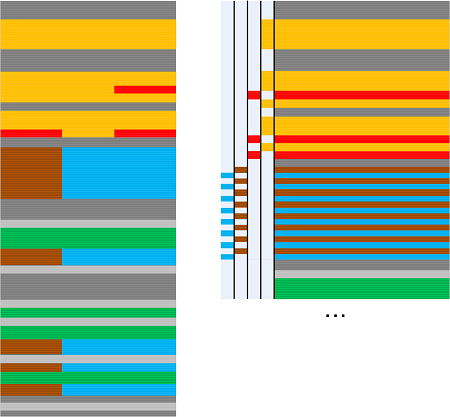
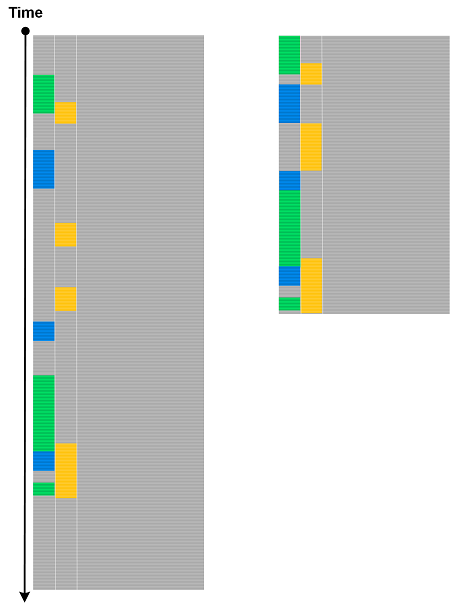
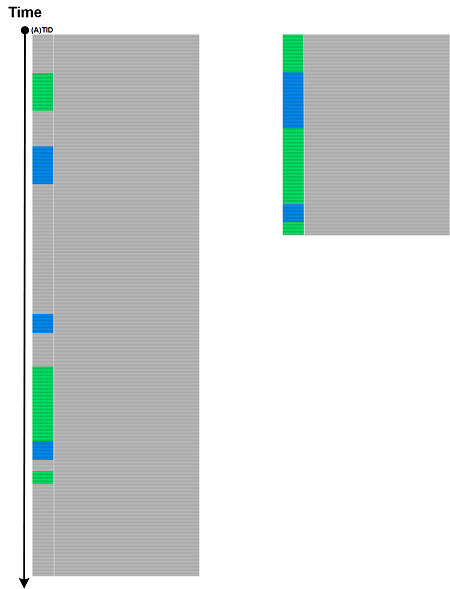
Sunday, July 19th, 2020
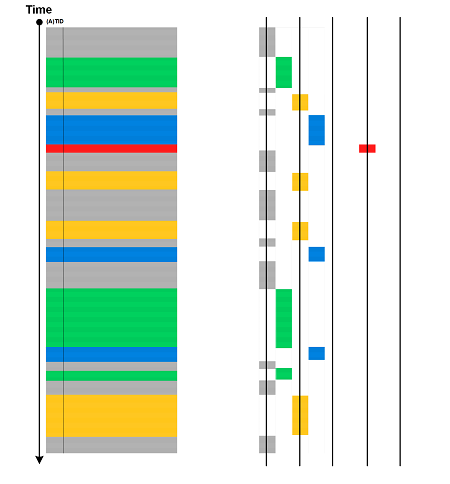
If we have an attribute we can sort messages based on that attribute values and get Sorted Trace. If that attribute is TID or ATID we get the sequence of Threads of Activity or Adjoint Threads of Activity:
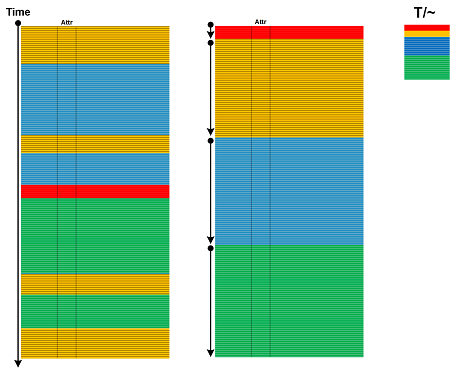
If we sort by message types or Message Invariants or some message data we get a sequence of Fibers of Activity.
The diagram above also shows on the right Quotient Trace by message type equivalence after additional sorting inside each Adjoint Thread of Activity.
- Dmitry Vostokov @ DumpAnalysis.org + TraceAnalysis.org -
Posted in Log Analysis, Software Trace Analysis, Trace Analysis Patterns | No Comments »