Trace Analysis Patterns (Part 12)
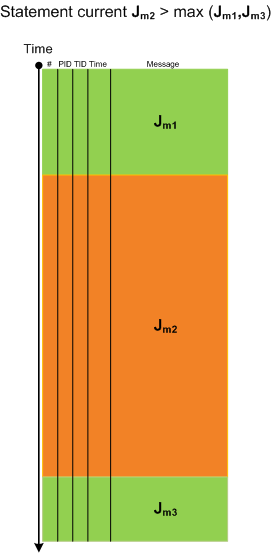
When looking at lengthy traces with thousands and millions of messages (trace statements) we can see regions of activity where statement current (Jm, msg/s) is much higher than in surrounding temporal regions. Hence the name of this pattern, Activity Region. Here is an illustration for a typical ETW/CDF trace where a middle region of activity (Jm2) signifies a system performing some response function like a user session initialization and application launch:
- Dmitry Vostokov @ TraceAnalysis.org -
November 19th, 2009 at 1:16 pm
Димочка, вот ты где !!!!
Наконец-то проявился.
Будь добр, отпиши на мой мейл весточку.
November 19th, 2009 at 6:32 pm
Hi Boris! Will do very soon!
Thanks,
Dmitry
December 31st, 2009 at 2:27 pm
[…] pattern. In our trace example, the search for “password” jumps straight to a small activity region of authorization modules starting from the message number #180,010 and the last […]
March 8th, 2010 at 3:57 pm
[…] we have a sequence of Activity Regions with increasing values of Statement Current, like depicted […]
May 25th, 2010 at 10:17 am
[…] rely on Significant Event and Anchor Message analysis patterns to partition traces into artificial Activity Regions to start our analysis with. This is also analogous for the imposition of the external time on the […]
September 13th, 2010 at 8:25 pm
[…] The last one if converted to a hex status is 8010001D but unfortunately the same errors were present in the working trace too in the same activity regions. […]
October 20th, 2010 at 4:26 pm
[…] threads can enter the same module or function and here other patterns more appropriate like Activity Region, Characteristic Message Block, Background and Foreground […]
November 4th, 2010 at 1:35 pm
[…] Experts Magazine Online Activity Region pattern highlights “mechanical” and syntactical aspects of trace analysis whereas […]