Archive for the ‘Software Trace Analysis’ Category
Sunday, February 19th, 2023
When we construct Trace Molecule, we may find that some Message Complex links from different ATIDs point to the same message and Tracemes. In such a case we have Message Bond by analogy with covalent bonds. One such example is illustrated in the following diagram:
- Dmitry Vostokov @ DumpAnalysis.org + TraceAnalysis.org -
Posted in Chemistry, Log Analysis, Software Trace Analysis, Trace Analysis Patterns | Comments Off
Saturday, February 18th, 2023
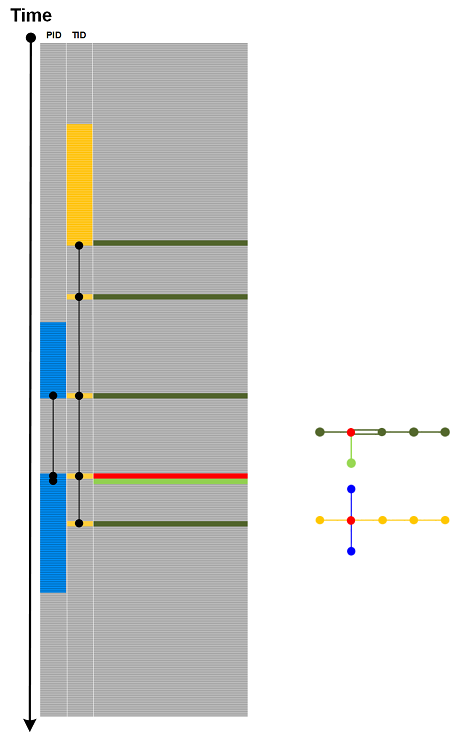
Trace Nerve is Thread of Activity or Adjoint Thread of Activity that runs through all Activity Regions. An example is illustrated in the following diagram:
Of course, depending on trace or log, there can be several Trace Nerves. This analysis pattern was inspired by nerve complexes in topology.
- Dmitry Vostokov @ DumpAnalysis.org + TraceAnalysis.org -
Posted in Log Analysis, Software Trace Analysis, Trace Analysis Patterns, Trace Analysis and Topology | Comments Off
Saturday, February 18th, 2023
Looking at software traces and logs as 2-categories allows us to consider Whisker Traces (horizontal composition) in addition to vertical composition such as Serial Traces, Trace Mask, and Container Traces. The same ATIDs can be combined, and if there is a time mismatch, additional message copies need to be added (whiskering). The process is illustrated in the following diagram:
- Dmitry Vostokov @ DumpAnalysis.org + TraceAnalysis.org -
Posted in Log Analysis, Mathematics of Debugging, Software Trace Analysis, Trace Analysis Patterns | Comments Off
Friday, February 17th, 2023
Trace embedding usually happens when some external tracing or logging framework or library is used. In this case, a trace message becomes part of an outer trace message which may have its own uniform Trace Schema. In this case, Embedded Trace analysis pattern is different from Container Trace where outer Trace Schemas may be different.
- Dmitry Vostokov @ DumpAnalysis.org + TraceAnalysis.org -
Posted in Log Analysis, Software Trace Analysis, Trace Analysis Patterns | Comments Off
Saturday, February 11th, 2023
Trace Windows, the obvious analysis pattern that was always implicit, is added now due to the proliferation of stream processing nowadays. However, it captures not only horizontal windows but vertical ones, similar to subspaces if we consider messages as vectors. Both types of windows can be combined. This is illustrated in the following diagram:
- Dmitry Vostokov @ DumpAnalysis.org + TraceAnalysis.org -
Posted in Data Analysis, Data Science, Databases, Log Analysis, Software Trace Analysis, Trace Analysis Patterns | Comments Off
Wednesday, February 8th, 2023
There’s some kind of duality between trace data and activity. For example, trace data corresponds to CoData (CoTrace, CoLog), the analysis activity. On the other hand, Regions of Activity (and various Activity-related patterns such Thread of Activity) may contain data that itself may point to some activity (not necessarily the same), CoActivity. For example, some keyboard-related message data may contain values of passwords. This analysis pattern is illustrated schematically in the following diagram:
CoActivity is different from Data Flow, where the same or modified value is passed from one message to another, not necessarily inside the same activity.
- Dmitry Vostokov @ DumpAnalysis.org + TraceAnalysis.org -
Posted in Log Analysis, Security, Software Trace Analysis, Trace Analysis Patterns | Comments Off
Tuesday, February 7th, 2023
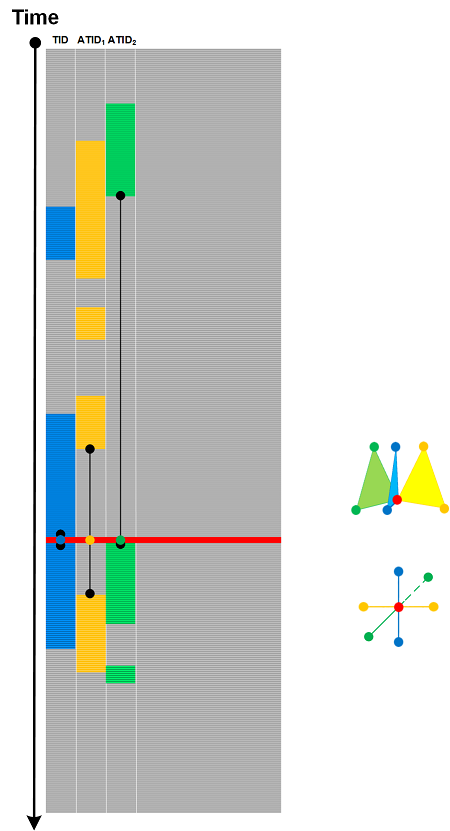
For any Message Complex, we can choose the corresponding Tracemes and assign them to points. If we keep ourselves only to line segments, we call these arrangements Trace Molecules. One example is illustrated in the following diagram:
This molecular approach was inspired by semic molecules in semic analysis. On the other hand, ultimately, the whole trace is one giant molecule similar to the traces and logs as proteins metaphor. This approach differs from the earlier artificial chemistry approach to trace and log analysis where molecules are patterns.
- Dmitry Vostokov @ DumpAnalysis.org + TraceAnalysis.org -
Posted in Chemistry, Log Analysis, Semantics, Semiotics, Software Trace Analysis, Software Trace Linguistics, Trace Analysis Patterns | Comments Off
Monday, February 6th, 2023
Consider the following trace message:
object: 0x77F468AB100 ref: 2
It contains several Tracemes, the smallest units of tracing (trace meaning, by analogy with semes), corresponding to Message Invariants and their data: //object memory address//, and //reference count//. However, they are structurally higher in the semantic hierarchy when compared with sememes. Traceme is pronounced /tɹeɪˈsiːm/ and can also be interpreted as trace me.
- Dmitry Vostokov @ DumpAnalysis.org + TraceAnalysis.org -
Posted in Log Analysis, Semantics, Semiotics, Software Trace Analysis, Software Trace Linguistics, Trace Analysis Patterns | Comments Off
Sunday, February 5th, 2023
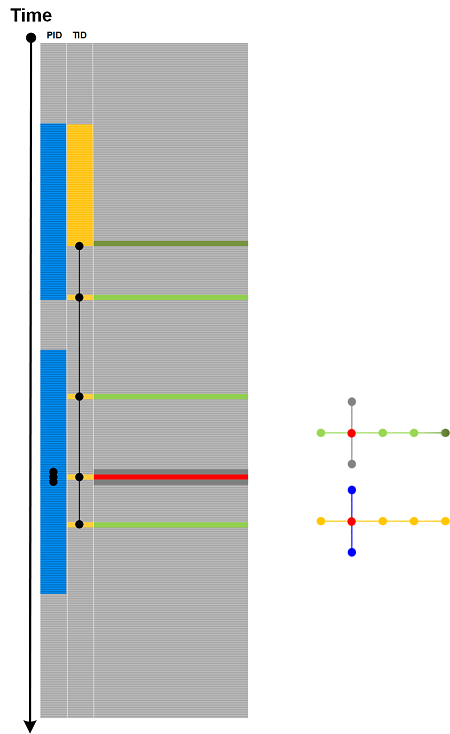
Message Complex takes inspiration from simplicial complexes. We select a message, choose TID or ATID, and connect to the nearest messages having the same TID or ATID. This procedure can be repeated for newly connected messages. Then we select another ATID and repeat the procedure. Three connected messages with the same ATID may form a triangle and may also intersect another triangle with a different ATID if they share the same message. A very simple example is illustrated in the following diagram:
Message Complex is more structural and geometric compared to Message Context, which is just a set of surrounding messages regardless of their TID or ATID based on some relationship criteria.
- Dmitry Vostokov @ DumpAnalysis.org + TraceAnalysis.org -
Posted in Log Analysis, Mathematics of Debugging, Software Trace Analysis, Trace Analysis Patterns | Comments Off
Saturday, February 4th, 2023
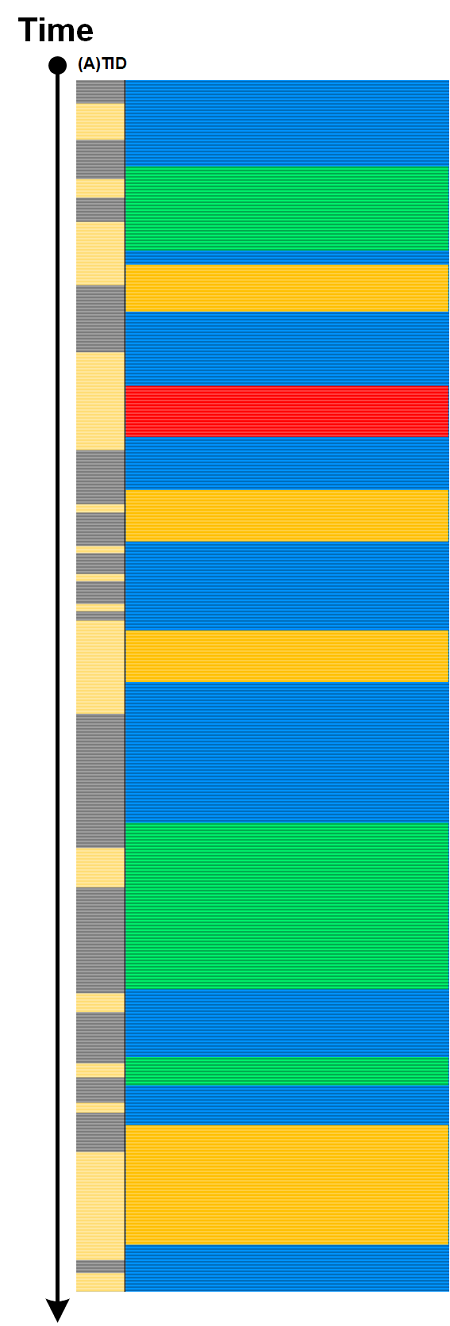
(Adjoint) Threads of Activity can be interpreted as braids (multibraiding). This braid analogy assumes that all (adjoint) threads implicitly start and end outside of the trace boundaries. However, some (adjoint) threads may start after the beginning of the tracing or end before the finishing of the tracing. Such modified braids are called braidoids. There can be several braidoids per trace based on the chosen (A)TIDs. We call this analysis pattern Trace Braidoids and one, based on TID, is illustrated in the following diagram:
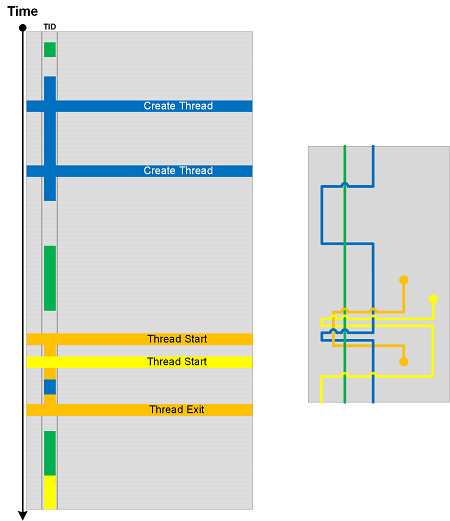
We added arc crossings when a different TID becomes current. Please also compare these crossings with other analysis patterns such as Braid Group and Braid of Activity.
- Dmitry Vostokov @ DumpAnalysis.org + TraceAnalysis.org -
Posted in Log Analysis, Software Trace Analysis, Trace Analysis Patterns | Comments Off
Thursday, February 2nd, 2023
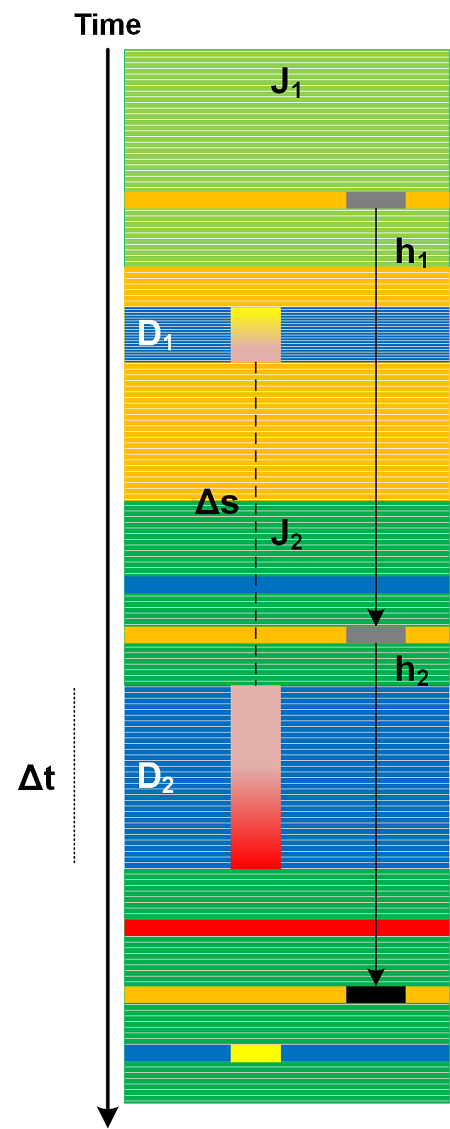
Message data may point to other messages in the same trace (see the example of Linked Messages) or in the other trace (see the Data Selector example). But similar data in other messages may not point to any other messages in the same or other, perhaps Truncated, traces and logs collected at the same time - similar to invalid pointers, for example, kernel addresses in process memory dumps or user space addresses in kernel memory dumps. We call this analysis pattern Null Reference (also notice the analogy with foreign key values in data tables where Null is not a value). Another analogy here is referential failure. This is illustrated in the following diagram adapted from Linked Messages analysis pattern diagram.
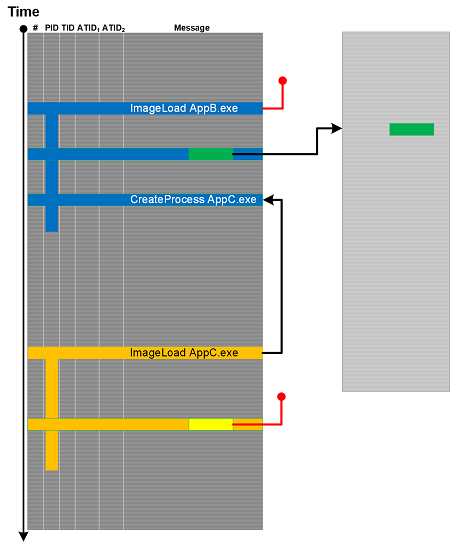
This analysis pattern is different from Missing Data where the reference is itself missing.
These Null References can be remediated by longer supplemental traces, Fiber Bundle, and Adjoint Spaces.
- Dmitry Vostokov @ DumpAnalysis.org + TraceAnalysis.org -
Posted in Log Analysis, Software Trace Analysis, Trace Analysis Patterns | Comments Off
Wednesday, February 1st, 2023
When we disregard the length of message blocks having the same attribute (ATID), we get Quotient Trace. But when we disregard the content of these message blocks (and replace each message with the same “empty” non-Silent Message) but preserve their length, we get Trace Skeleton.
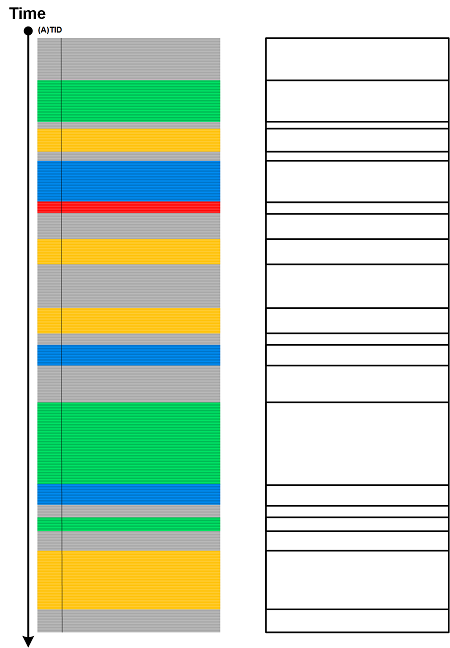
Different Trace Shapes may have different Trace Skeletons but we can generate similar shapes from one skeleton.
We can also apply a music metaphor and consider it as Trace Rhythm:

- Dmitry Vostokov @ DumpAnalysis.org + TraceAnalysis.org -
Posted in Log Analysis, Software Trace Analysis, Trace Analysis Patterns | Comments Off
Wednesday, November 9th, 2022
Sometimes we want to collapse messages into one message while preserving content, for example, for grep. We call such an analysis pattern Collapsed Message (by an analogy for collapsing an internal directed graph edge, or edge contraction). Several consecutive messages having the same attribute, for example Thread of Activity for Exception Stack Trace may be collapsed into one longer trace message. This is a simple case of Quotient Trace without compression or transform. And this is different than Motivic Trace which doesn’t preserve message content.
- Dmitry Vostokov @ DumpAnalysis.org + TraceAnalysis.org -
Posted in Log Analysis, Software Trace Analysis, Trace Analysis Patterns | Comments Off
Thursday, January 13th, 2022
Various types of Measurements are important in software diagnostics. We consider traces and logs, and general software narratives (and even hardware narratives) as a medium for all types of possible measurements. Even a small display in a handheld device showing a number is an example of Singleton Trace.
Typical trace and log measurement analysis patterns include Time Delta, Statement Density and Current, and Trace Acceleration. Numeric analysis patterns include Counter Value, Trace Field, Signal in general, and the forthcoming Trace Distance that uses various metrics, for example, the number of messages, Activity Regions, or just hops.
- Dmitry Vostokov @ DumpAnalysis.org + TraceAnalysis.org -
Posted in Log Analysis, Metrics, Monitoring, Performance Analysis, Performance Monitoring, Prometheus, Software Narratology, Software Trace Analysis, Telemetry, Trace Analysis Patterns | Comments Off
Saturday, September 11th, 2021
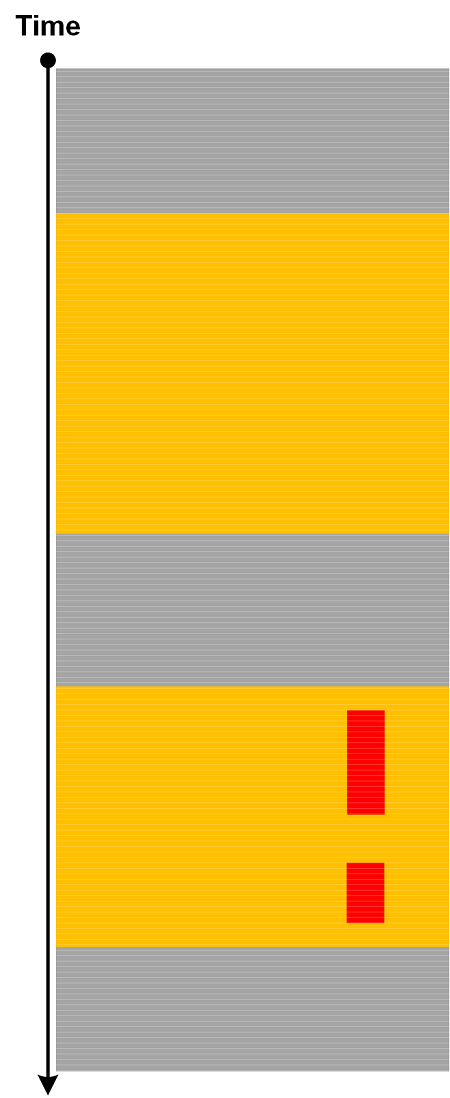
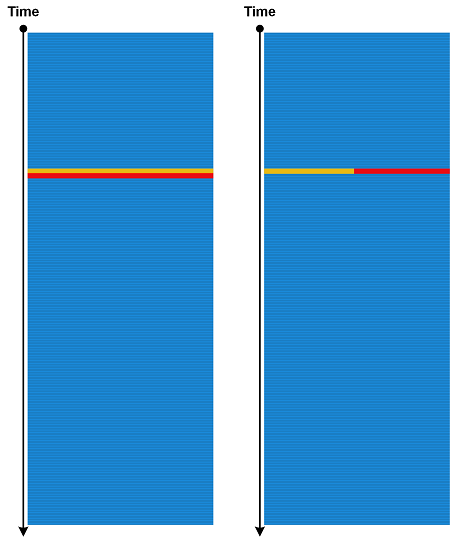
Even if traces and logs are perfectly synchronized (Unsynchronized Traces) we me still get Unsynchronized Messages. If respective message times are the same (can depend on time resolution) we don’t know which one was first. This is visible if we do Trace Mask using different order:
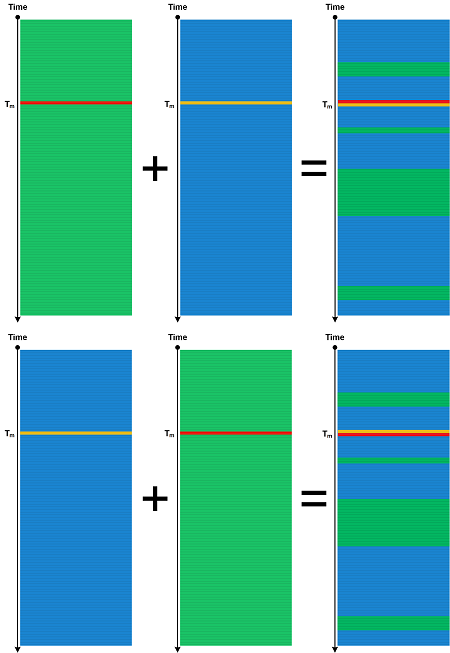
If both messages belong to the same Thread of Activity we may be able to reorder them correctly based on additional message semantics, such as module hierarchy (for example, OS runtime library and application code that are traced separately).
- Dmitry Vostokov @ DumpAnalysis.org + TraceAnalysis.org -
Posted in Log Analysis, Software Trace Analysis, Trace Analysis Patterns | Comments Off
Sunday, August 29th, 2021
Usually, when we find an interesting message in a log (maybe also a frame from Exception Stack Trace), especially from an unfamiliar component, we also want to search past problem cases either on the Internet or in some internal database. However, we just put the message as is or some small fragment of it we may get a lot of noise results. The problem is to find the optimal Message Essence. Often, this is done by omitting variable data (including Adjoint Thread of Activity fields) but leaving Message Invariants and Trace Constants usually refine a diagnostic error:
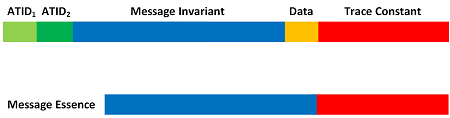
This analysis pattern is different from Message Invariant. where the latter is useful when finding its emitter’s source code lines (PLOT).
- Dmitry Vostokov @ DumpAnalysis.org + TraceAnalysis.org -
Posted in Debugging, Log Analysis, Software Trace Analysis, Trace Analysis Patterns | Comments Off
Wednesday, August 11th, 2021
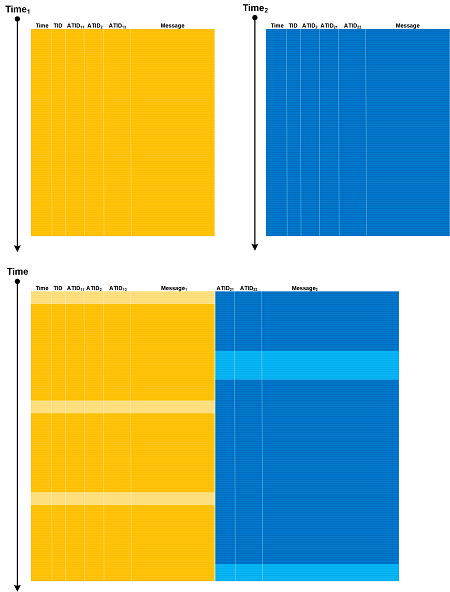
When we have different traces and logs not necessarily with the same Trace Schema and select only messages that have some condition, for example, the same ATID (see Adjoint Thread of Activity) or FID (see Feature of Activity) value, we get the new trace that we call Trace Join. A combination of ATID from one trace or Message Set from another is also possible as illustrated in this allegorical picture when joining is done by “Plato” author value or title containing “Plato” (all case-insensitive):

This is very similar to relational data joins. Join of the same trace is possible too. A Dia|gram picture (similar to the previous patterns) is left as an exercise.
We initially wanted to call this analysis pattern Filtered Mask but later realized that it may not be possible to do Trace Mask if there is no global ordering information, such as time. In such a case, Serial Trace is possible.
- Dmitry Vostokov @ DumpAnalysis.org + TraceAnalysis.org -
Posted in Data Analysis, Log Analysis, Software Trace Analysis, Trace Analysis Patterns | No Comments »
Tuesday, August 10th, 2021
The name of this pattern, Container Trace, originates from the logging style that is recommended as the best practice for containers (like Docker), where various components output their tracing and logging statements to the standard console output. Such components may have their own incompatible Trace Schemas, for example, normal trace messages intermingled with Exception Stack Traces. However, in general, this pattern can be extended to any log file (a container for trace statements). This pattern is different from Trace Mask, where individual traces come from separate files and have Trace Schema with some ATID (see Adjoint Thread of Activity) or FID (see Feature of Activity), such as time, that allows for blending them correctly. Components that output their messages to Container Trace may not even have any internal Trace Schema. In such a case, Container Trace may simply be treated as Text Trace.
- Dmitry Vostokov @ DumpAnalysis.org + TraceAnalysis.org -
Posted in Containers, Log Analysis, Software Trace Analysis, Trace Analysis Patterns | Comments Off
Saturday, May 29th, 2021
Most of the time tracing and logging is done sequentially, for example, when a service or application is restarted after the crash or bug fix, or the host is rebooted. Then we can glue all resulted traces together (similar to Glued Stack Trace) into one large Serial Trace. Here we assume the same Trace Schema for all individual traces and logs. It can also be considered as flattening a 2-dimensional Trace Tensor:
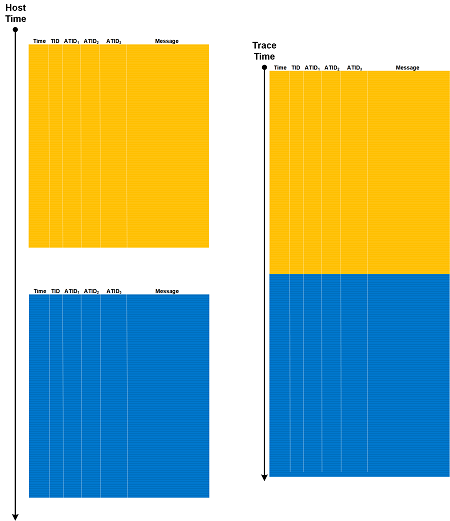
This allows us to apply various trace and log analysis patterns to the unified Serial Trace instead of doing Inter-Correlation (vs. Intra-Correlation).
Serial Trace is different from Meta Trace which is a trace about trace and Master Trace which is a trace we compare all other traces to. It is similar to Trace Mask when there is no overlap in time. Also, Serial Trace is not a reverse of Split Trace in a general case due to Visibility Limits between individual traces.
When gluing traces together, Ornament messages may be added to serve as a boundary between fragments.
- Dmitry Vostokov @ DumpAnalysis.org + TraceAnalysis.org -
Posted in Log Analysis, Software Trace Analysis, Trace Analysis Patterns | Comments Off
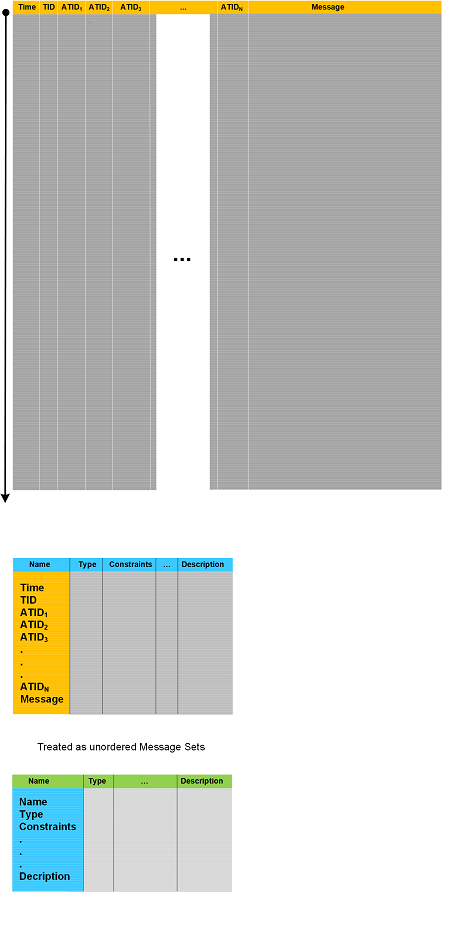
Monday, April 26th, 2021
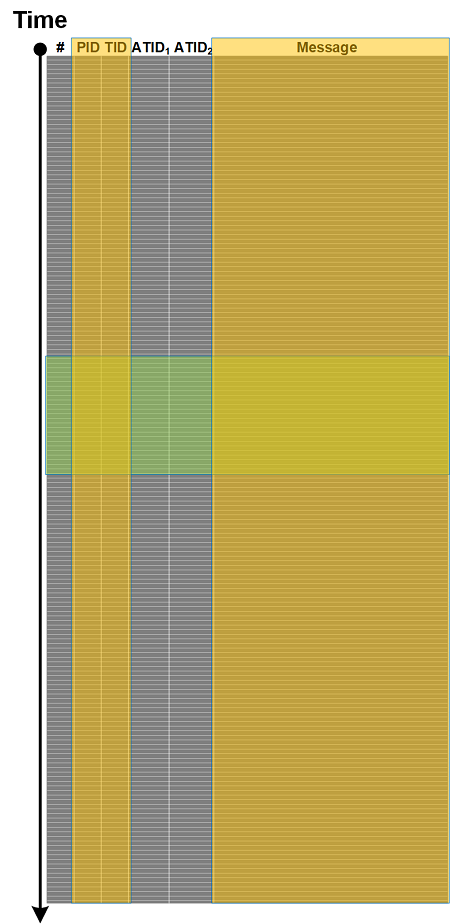
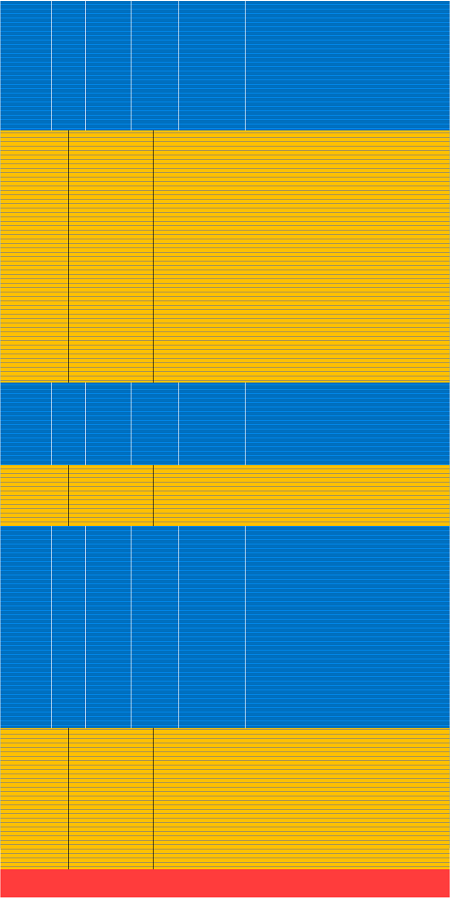
Trace Schema can be represented as Schema Trace or, avoiding naming confusion, Definition Trace. The resulting trace looses ordering (similar to unordered Message Set) but allows application of trace and log analysis patterns, especially if some order is fixed, for example, alphabetical for names or original presentation column arrangement. Schema definition Trace Schema can be represented as another Definition Trace as illustrated in the following diagram:
- Dmitry Vostokov @ DumpAnalysis.org + TraceAnalysis.org -
Posted in Data Analysis, Data Science, Log Analysis, Software Trace Analysis, Trace Analysis Patterns | Comments Off