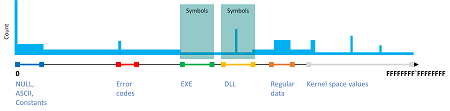
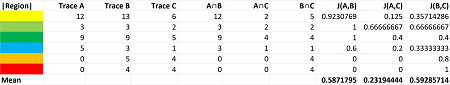
When developers look at crash dumps they are more interested at parameters and local variables in particular stack frames of interest. However, sometimes it is useful to look at all such frames especially to gather information that may be useful for technical support or to correlate to additional traces and logs (for example, Historical Information to establish additional Basic Facts and build Vocabulary Index).
Listing the parameters can be done, for example, by using Stack Trace command variant (kP WinDbg commend, but we use kPL to exclude source code references to reduce visual clutter):
0:000> kPL

# Child-SP          RetAddr           Call Site

00 000000e4`c0afe488 00007ffe`cc888037 ntdll!NtWaitForMultipleObjects+0x14

01 000000e4`c0afe490 00007ffe`cc887f1e KERNELBASE!WaitForMultipleObjectsEx+0x107

02 000000e4`c0afe790 00007ffe`cd8271fb KERNELBASE!WaitForMultipleObjects+0xe

03 000000e4`c0afe7d0 00007ffe`cd826ca8 kernel32!WerpReportFaultInternal+0x51b

04 000000e4`c0afe8f0 00007ffe`cc9300b8 kernel32!WerpReportFault+0xac

05 000000e4`c0afe930 00007ffe`cf6c4ab2 KERNELBASE!UnhandledExceptionFilter+0x3b8

06 000000e4`c0afea50 00007ffe`cf6ac656 ntdll!RtlUserThreadStart$filt$0+0xa2

07 000000e4`c0afea90 00007ffe`cf6c11cf ntdll!_C_specific_handler+0x96

08 000000e4`c0afeb00 00007ffe`cf68a209 ntdll!RtlpExecuteHandlerForException+0xf

09 000000e4`c0afeb30 00007ffe`cf6bfe3e ntdll!RtlDispatchException+0x219

0a 000000e4`c0aff240 00007ffe`cc8f0aa2 ntdll!KiUserExceptionDispatch+0x2e

0b 000000e4`c0aff948 00007ff6`c8ab1568 KERNELBASE!wil::details::DebugBreak+0x2

0c 000000e4`c0aff950 00007ff6`c8ab1560 FrameTrace!foo(

			unsigned int64 num = 0,

			class std::basic_string<wchar_t,std::char_traits<wchar_t>,std::allocator<wchar_t> > * str = 0×000000e4`c0aff9d0 “Hello World! Hello World! Hello World! Hello World! Hello World! Hello World! Hello World! Hello World! Hello World! Hello World! Hello World! Hello World! Hello World! Hello World! Hello World! Hello World! Hello World! Hello World! Hello World! Hello World! Hello World! Hello World! Hello World! Hello World! Hello World! Hello World! Hello World! Hello World! Hello World! Hello World! Hello World! Hello World! “)+0×68

0d 000000e4`c0aff9b0 00007ff6`c8ab1560 FrameTrace!foo(

			unsigned int64 num = 0,

			class std::basic_string<wchar_t,std::char_traits<wchar_t>,std::allocator<wchar_t> > * str = 0×000000e4`c0affa30 “Hello World! Hello World! Hello World! Hello World! Hello World! Hello World! Hello World! Hello World! Hello World! Hello World! Hello World! Hello World! Hello World! Hello World! Hello World! Hello World! “)+0×60

0e 000000e4`c0affa10 00007ff6`c8ab1560 FrameTrace!foo(

			unsigned int64 num = 1,

			class std::basic_string<wchar_t,std::char_traits<wchar_t>,std::allocator<wchar_t> > * str = 0×000000e4`c0affa90 “Hello World! Hello World! Hello World! Hello World! Hello World! Hello World! Hello World! Hello World! “)+0×60

0f 000000e4`c0affa70 00007ff6`c8ab1560 FrameTrace!foo(

			unsigned int64 num = 2,

			class std::basic_string<wchar_t,std::char_traits<wchar_t>,std::allocator<wchar_t> > * str = 0×000000e4`c0affaf0 “Hello World! Hello World! Hello World! Hello World! “)+0×60

10 000000e4`c0affad0 00007ff6`c8ab1560 FrameTrace!foo(

			unsigned int64 num = 3,

			class std::basic_string<wchar_t,std::char_traits<wchar_t>,std::allocator<wchar_t> > * str = 0×000000e4`c0affb50 “Hello World! Hello World! “)+0×60

11 000000e4`c0affb30 00007ff6`c8ab15b5 FrameTrace!foo(

			unsigned int64 num = 4,

			class std::basic_string<wchar_t,std::char_traits<wchar_t>,std::allocator<wchar_t> > * str = 0×000000e4`c0affbb0 “Hello World! “)+0×60

12 000000e4`c0affb90 00007ff6`c8ab2b14 FrameTrace!main(void)+0×25

13 (Inline Function) ——–`——– FrameTrace!invoke_main+0×22

14 000000e4`c0affbe0 00007ffe`cd7d7bd4 FrameTrace!__scrt_common_main_seh(void)+0×10c

15 000000e4`c0affc20 00007ffe`cf68ce51 kernel32!BaseThreadInitThunk+0×14

16 000000e4`c0affc50 00000000`00000000 ntdll!RtlUserThreadStart+0×21
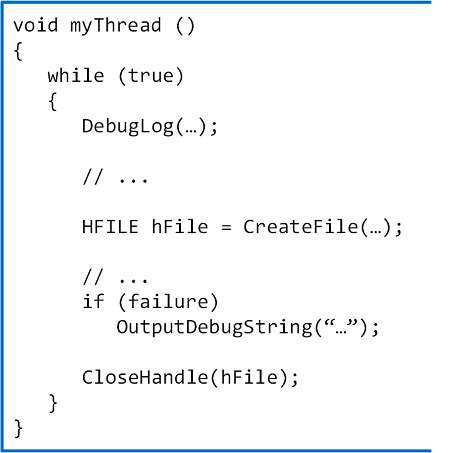
The stack trace comes from the following modeling application:
void foo(std::size_t num, const std::wstring& str)

{

	if (std::wstring concatStr{ str }; num)

	{

		concatStr += str;


		foo(–num, concatStr);

	}

	else

	{

		::DebugBreak();

	}

}
int main()

{

	foo(5, L”Hello World! “);

}
To list local variable we need to use !for_each_frame WinDbg command:
0:000> !for_each_frame "dv"

_ _ _ _ _ _ _ _ _ _ _ _ _ _ _ _

00 000000e4`c0afe488 00007ffe`cc888037 ntdll!NtWaitForMultipleObjects+0x14

Unable to enumerate locals, Win32 error 0n87

Private symbols (symbols.pri) are required for locals.

Type ".hh dbgerr005" for details.

_ _ _ _ _ _ _ _ _ _ _ _ _ _ _ _

01 000000e4`c0afe490 00007ffe`cc887f1e KERNELBASE!WaitForMultipleObjectsEx+0x107

_ _ _ _ _ _ _ _ _ _ _ _ _ _ _ _

02 000000e4`c0afe790 00007ffe`cd8271fb KERNELBASE!WaitForMultipleObjects+0xe

Unable to enumerate locals, Win32 error 0n87

Private symbols (symbols.pri) are required for locals.

Type ".hh dbgerr005" for details.

_ _ _ _ _ _ _ _ _ _ _ _ _ _ _ _

03 000000e4`c0afe7d0 00007ffe`cd826ca8 kernel32!WerpReportFaultInternal+0x51b

Unable to enumerate locals, Win32 error 0n87

Private symbols (symbols.pri) are required for locals.

Type ".hh dbgerr005" for details.

_ _ _ _ _ _ _ _ _ _ _ _ _ _ _ _

04 000000e4`c0afe8f0 00007ffe`cc9300b8 kernel32!WerpReportFault+0xac

Unable to enumerate locals, Win32 error 0n87

Private symbols (symbols.pri) are required for locals.

Type ".hh dbgerr005" for details.

_ _ _ _ _ _ _ _ _ _ _ _ _ _ _ _

05 000000e4`c0afe930 00007ffe`cf6c4ab2 KERNELBASE!UnhandledExceptionFilter+0x3b8

Unable to enumerate locals, Win32 error 0n87

Private symbols (symbols.pri) are required for locals.

Type ".hh dbgerr005" for details.

_ _ _ _ _ _ _ _ _ _ _ _ _ _ _ _

06 000000e4`c0afea50 00007ffe`cf6ac656 ntdll!RtlUserThreadStart$filt$0+0xa2

_ _ _ _ _ _ _ _ _ _ _ _ _ _ _ _

07 000000e4`c0afea90 00007ffe`cf6c11cf ntdll!_C_specific_handler+0x96

Unable to enumerate locals, Win32 error 0n87

Private symbols (symbols.pri) are required for locals.

Type ".hh dbgerr005" for details.

_ _ _ _ _ _ _ _ _ _ _ _ _ _ _ _

08 000000e4`c0afeb00 00007ffe`cf68a209 ntdll!RtlpExecuteHandlerForException+0xf

Unable to enumerate locals, Win32 error 0n87

Private symbols (symbols.pri) are required for locals.

Type ".hh dbgerr005" for details.

_ _ _ _ _ _ _ _ _ _ _ _ _ _ _ _

09 000000e4`c0afeb30 00007ffe`cf6bfe3e ntdll!RtlDispatchException+0x219

_ _ _ _ _ _ _ _ _ _ _ _ _ _ _ _

0a 000000e4`c0aff240 00007ffe`cc8f0aa2 ntdll!KiUserExceptionDispatch+0x2e

Unable to enumerate locals, Win32 error 0n87

Private symbols (symbols.pri) are required for locals.

Type ".hh dbgerr005" for details.

_ _ _ _ _ _ _ _ _ _ _ _ _ _ _ _

0b 000000e4`c0aff948 00007ff6`c8ab1568 KERNELBASE!wil::details::DebugBreak+0x2

Unable to enumerate locals, Win32 error 0n87

Private symbols (symbols.pri) are required for locals.

Type ".hh dbgerr005" for details.

_ _ _ _ _ _ _ _ _ _ _ _ _ _ _ _

0c 000000e4`c0aff950 00007ff6`c8ab1560 FrameTrace!foo+0x68 [C:\NewWork\FrameTrace\FrameTrace.cpp @ 14]

concatStr = "Hello World! Hello World! Hello World! Hello World! Hello World! Hello World! Hello World! Hello World! Hello World! Hello World! Hello World! Hello World! Hello World! Hello World! Hello World! Hello World! Hello World! Hello World! Hello World! Hello World! Hello World! Hello World! Hello World! Hello World! Hello World! Hello World! Hello World! Hello World! Hello World! Hello World! Hello World! Hello World! "

num = 0

str = 0x000000e4`c0aff9d0 "Hello World! Hello World! Hello World! Hello World! Hello World! Hello World! Hello World! Hello World! Hello World! Hello World! Hello World! Hello World! Hello World! Hello World! Hello World! Hello World! Hello World! Hello World! Hello World! Hello World! Hello World! Hello World! Hello World! Hello World! Hello World! Hello World! Hello World! Hello World! Hello World! Hello World! Hello World! Hello World! "

_ _ _ _ _ _ _ _ _ _ _ _ _ _ _ _

0d 000000e4`c0aff9b0 00007ff6`c8ab1560 FrameTrace!foo+0x60 [C:\NewWork\FrameTrace\FrameTrace.cpp @ 11]

concatStr = "Hello World! Hello World! Hello World! Hello World! Hello World! Hello World! Hello World! Hello World! Hello World! Hello World! Hello World! Hello World! Hello World! Hello World! Hello World! Hello World! Hello World! Hello World! Hello World! Hello World! Hello World! Hello World! Hello World! Hello World! Hello World! Hello World! Hello World! Hello World! Hello World! Hello World! Hello World! Hello World! "

num = 0

str = 0x000000e4`c0affa30 "Hello World! Hello World! Hello World! Hello World! Hello World! Hello World! Hello World! Hello World! Hello World! Hello World! Hello World! Hello World! Hello World! Hello World! Hello World! Hello World! "

_ _ _ _ _ _ _ _ _ _ _ _ _ _ _ _

0e 000000e4`c0affa10 00007ff6`c8ab1560 FrameTrace!foo+0x60 [C:\NewWork\FrameTrace\FrameTrace.cpp @ 11]

concatStr = "Hello World! Hello World! Hello World! Hello World! Hello World! Hello World! Hello World! Hello World! Hello World! Hello World! Hello World! Hello World! Hello World! Hello World! Hello World! Hello World! "

num = 1

str = 0x000000e4`c0affa90 "Hello World! Hello World! Hello World! Hello World! Hello World! Hello World! Hello World! Hello World! "

_ _ _ _ _ _ _ _ _ _ _ _ _ _ _ _

0f 000000e4`c0affa70 00007ff6`c8ab1560 FrameTrace!foo+0x60 [C:\NewWork\FrameTrace\FrameTrace.cpp @ 11]

concatStr = "Hello World! Hello World! Hello World! Hello World! Hello World! Hello World! Hello World! Hello World! "

num = 2

str = 0x000000e4`c0affaf0 "Hello World! Hello World! Hello World! Hello World! "

_ _ _ _ _ _ _ _ _ _ _ _ _ _ _ _

10 000000e4`c0affad0 00007ff6`c8ab1560 FrameTrace!foo+0x60 [C:\NewWork\FrameTrace\FrameTrace.cpp @ 11]

concatStr = "Hello World! Hello World! Hello World! Hello World! "

num = 3

str = 0x000000e4`c0affb50 "Hello World! Hello World! "

_ _ _ _ _ _ _ _ _ _ _ _ _ _ _ _

11 000000e4`c0affb30 00007ff6`c8ab15b5 FrameTrace!foo+0x60 [C:\NewWork\FrameTrace\FrameTrace.cpp @ 11]

concatStr = "Hello World! Hello World! "

num = 4

str = 0x000000e4`c0affbb0 "Hello World! "

_ _ _ _ _ _ _ _ _ _ _ _ _ _ _ _

12 000000e4`c0affb90 00007ff6`c8ab2b14 FrameTrace!main+0x25 [C:\NewWork\FrameTrace\FrameTrace.cpp @ 20]

_ _ _ _ _ _ _ _ _ _ _ _ _ _ _ _

13 (Inline Function) --------`-------- FrameTrace!invoke_main+0x22 [d:\A01\_work\6\s\src\vctools\crt\vcstartup\src\startup\exe_common.inl @ 78]

_ _ _ _ _ _ _ _ _ _ _ _ _ _ _ _

14 000000e4`c0affbe0 00007ffe`cd7d7bd4 FrameTrace!__scrt_common_main_seh+0x10c [d:\A01\_work\6\s\src\vctools\crt\vcstartup\src\startup\exe_common.inl @ 288]

has_cctor = false

main_result = <value unavailable>

tls_init_callback = <value unavailable>

is_nested = <value unavailable>

tls_dtor_callback = <value unavailable>

main_result = <value unavailable>

__scrt_current_native_startup_state = <value unavailable>

_ _ _ _ _ _ _ _ _ _ _ _ _ _ _ _

15 000000e4`c0affc20 00007ffe`cf68ce51 kernel32!BaseThreadInitThunk+0x14

Unable to enumerate locals, Win32 error 0n87

Private symbols (symbols.pri) are required for locals.

Type ".hh dbgerr005" for details.

_ _ _ _ _ _ _ _ _ _ _ _ _ _ _ _

16 000000e4`c0affc50 00000000`00000000 ntdll!RtlUserThreadStart+0x21

Unable to enumerate locals, Win32 error 0n87

Private symbols (symbols.pri) are required for locals.

Type ".hh dbgerr005" for details.

_ _ _ _ _ _ _ _ _ _ _ _ _ _ _ _

15 000000e4`c0affc20 00007ffe`cf68ce51 kernel32!BaseThreadInitThunk+0x14
We can also apply “dv /i /V” command to each frame to get additional low-level frame details:
[...]

11 000000e4`c0affb30 00007ff6`c8ab15b5 FrameTrace!foo+0x60 [C:\NewWork\FrameTrace\FrameTrace.cpp @ 11]

prv local  000000e4`c0affb50 @rsp+0x0020             concatStr = "Hello World! Hello World! "

prv param  000000e4`c0affb90 @rsp+0x0060                   num = 4

prv param  000000e4`c0affb98 @rsp+0x0068                   str = 0x000000e4`c0affbb0 "Hello World! "

[...]
We see this as a form of back tracing Execution Residue, for example:
0:000> !for_each_frame ".frame /c @$frame; dps rsp"

[...]

_ _ _ _ _ _ _ _ _ _ _ _ _ _ _ _

04 000000e4`c0afe8f0 00007ffe`cc9300b8 kernel32!WerpReportFault+0xac

04 000000e4`c0afe8f0 00007ffe`cc9300b8 kernel32!WerpReportFault+0xac

rax=000000000000005b rbx=0000000000000000 rcx=0000000000000003

rdx=000000e4c0afe888 rsi=0000000000000000 rdi=0000000000000003

rip=00007ffecd826ca8 rsp=000000e4c0afe8f0 rbp=0000000000000000

r8=0000000000000000  r9=00000000ffffffff r10=0000000000000000

r11=000000e4c0afdc30 r12=000000e4c0afeac0 r13=ffffffffffffffff

r14=000000e4c0afeac0 r15=0000000000001a38

iopl=0         nv up ei pl zr na po nc

cs=0033  ss=002b  ds=002b  es=002b  fs=0053  gs=002b             efl=00000246

kernel32!WerpReportFault+0xac:

00007ffe`cd826ca8 8bf8            mov     edi,eax

000000e4`c0afe8f0  00000000`00000000

000000e4`c0afe8f8  00000000`00000000

000000e4`c0afe900  00000000`00000003

000000e4`c0afe908  000000e4`c0afeac0

000000e4`c0afe910  00000000`00000004

000000e4`c0afe918  00000000`00000001

000000e4`c0afe920  00000000`00000000

000000e4`c0afe928  00007ffe`cc9300b8 KERNELBASE!UnhandledExceptionFilter+0x3b8

000000e4`c0afe930  00000000`00000000

000000e4`c0afe938  000000e4`c0affc50

000000e4`c0afe940  00007ffe`cd7c0000 kernel32!RtlVirtualUnwindStub <PERF> (kernel32+0x0)

000000e4`c0afe948  00000207`5d660000

000000e4`c0afe950  00000000`00000000

000000e4`c0afe958  00007ffe`cf6660b9 ntdll!RtlpFindEntry+0x4d

000000e4`c0afe960  00000004`00000006

000000e4`c0afe968  00000001`00000000

_ _ _ _ _ _ _ _ _ _ _ _ _ _ _ _

05 000000e4`c0afe930 00007ffe`cf6c4ab2 KERNELBASE!UnhandledExceptionFilter+0x3b8

05 000000e4`c0afe930 00007ffe`cf6c4ab2 KERNELBASE!UnhandledExceptionFilter+0x3b8

rax=000000000000005b rbx=0000000000000000 rcx=0000000000000003

rdx=000000e4c0afe888 rsi=00007ffecd7c0000 rdi=0000000000000000

rip=00007ffecc9300b8 rsp=000000e4c0afe930 rbp=000000e4c0affc50

r8=0000000000000000  r9=00000000ffffffff r10=0000000000000000

r11=000000e4c0afdc30 r12=000000e4c0afeac0 r13=ffffffffffffffff

r14=0000000000000001 r15=0000000000000004

iopl=0         nv up ei pl zr na po nc

cs=0033  ss=002b  ds=002b  es=002b  fs=0053  gs=002b             efl=00000246

KERNELBASE!UnhandledExceptionFilter+0x3b8:

00007ffe`cc9300b8 0f1f440000      nop     dword ptr [rax+rax]

000000e4`c0afe930  00000000`00000000

000000e4`c0afe938  000000e4`c0affc50

000000e4`c0afe940  00007ffe`cd7c0000 kernel32!RtlVirtualUnwindStub <PERF> (kernel32+0x0)

000000e4`c0afe948  00000207`5d660000

000000e4`c0afe950  00000000`00000000

000000e4`c0afe958  00007ffe`cf6660b9 ntdll!RtlpFindEntry+0x4d

000000e4`c0afe960  00000004`00000006

000000e4`c0afe968  00000001`00000000

000000e4`c0afe970  00000000`00000001

000000e4`c0afe978  00007ffe`cd7c0000 kernel32!RtlVirtualUnwindStub <PERF> (kernel32+0x0)

000000e4`c0afe980  00000207`5d662ff0

000000e4`c0afe988  00000000`00000000

000000e4`c0afe990  000000e4`c0afeac0

000000e4`c0afe998  00007ffe`cd7c0000 kernel32!RtlVirtualUnwindStub <PERF> (kernel32+0x0)

000000e4`c0afe9a0  00000000`005a0058

000000e4`c0afe9a8  00007ffe`cca6ff70 KERNELBASE!`string'

_ _ _ _ _ _ _ _ _ _ _ _ _ _ _ _

06 000000e4`c0afea50 00007ffe`cf6ac656 ntdll!RtlUserThreadStart$filt$0+0xa2

06 000000e4`c0afea50 00007ffe`cf6ac656 ntdll!RtlUserThreadStart$filt$0+0xa2

rax=000000000000005b rbx=00007ffecf764420 rcx=0000000000000003

rdx=000000e4c0afe888 rsi=0000000000000000 rdi=0000000000000000

rip=00007ffecf6c4ab2 rsp=000000e4c0afea50 rbp=000000e4c0affc50

r8=0000000000000000  r9=00000000ffffffff r10=0000000000000000

r11=000000e4c0afdc30 r12=000000e4c0aff730 r13=000000e4c0affc50

r14=000000e4c0aff0c0 r15=00007ffecf620000

iopl=0         nv up ei pl zr na po nc

cs=0033  ss=002b  ds=002b  es=002b  fs=0053  gs=002b             efl=00000246

ntdll!RtlUserThreadStart$filt$0+0xa2:

00007ffe`cf6c4ab2 eb16            jmp     ntdll!RtlUserThreadStart$filt$0+0xba (00007ffe`cf6c4aca)

000000e4`c0afea50  00000000`00000000

000000e4`c0afea58  00007ffe`cf764420 ntdll!`string'+0x9aa8

000000e4`c0afea60  00000000`00000000

000000e4`c0afea68  000000e4`c0affbe0

000000e4`c0afea70  00000000`00000000

000000e4`c0afea78  00007ffe`cf6457d8 ntdll!LdrpAppendUnicodeStringToFilenameBuffer+0x50

000000e4`c0afea80  00000000`0006ce51

000000e4`c0afea88  00007ffe`cf6ac656 ntdll!_C_specific_handler+0x96

000000e4`c0afea90  000000e4`c0afeb40

000000e4`c0afea98  00007ffe`cf642930 ntdll!LdrpFindLoadedDllByNameLockHeld+0xe4

000000e4`c0afeaa0  000000e4`c0aff088

000000e4`c0afeaa8  000000e4`c0aff110

000000e4`c0afeab0  000000e4`c0aff240

000000e4`c0afeab8  00000000`00000000

000000e4`c0afeac0  000000e4`c0aff730

000000e4`c0afeac8  000000e4`c0aff240

_ _ _ _ _ _ _ _ _ _ _ _ _ _ _ _

07 000000e4`c0afea90 00007ffe`cf6c11cf ntdll!_C_specific_handler+0x96

07 000000e4`c0afea90 00007ffe`cf6c11cf ntdll!_C_specific_handler+0x96

rax=000000000000005b rbx=00007ffecf764420 rcx=0000000000000003

rdx=000000e4c0afe888 rsi=0000000000000000 rdi=0000000000000000

rip=00007ffecf6ac656 rsp=000000e4c0afea90 rbp=000000000006ce51

r8=0000000000000000  r9=00000000ffffffff r10=0000000000000000

r11=000000e4c0afdc30 r12=000000e4c0aff730 r13=000000e4c0affc50

r14=000000e4c0aff0c0 r15=00007ffecf620000

iopl=0         nv up ei pl zr na po nc

cs=0033  ss=002b  ds=002b  es=002b  fs=0053  gs=002b             efl=00000246

ntdll!_C_specific_handler+0x96:

00007ffe`cf6ac656 85c0            test    eax,eax

000000e4`c0afea90  000000e4`c0afeb40

000000e4`c0afea98  00007ffe`cf642930 ntdll!LdrpFindLoadedDllByNameLockHeld+0xe4

000000e4`c0afeaa0  000000e4`c0aff088

000000e4`c0afeaa8  000000e4`c0aff110

000000e4`c0afeab0  000000e4`c0aff240

000000e4`c0afeab8  00000000`00000000

000000e4`c0afeac0  000000e4`c0aff730

000000e4`c0afeac8  000000e4`c0aff240

000000e4`c0afead0  00000000`00000000

000000e4`c0afead8  000000e4`c0afeb70

000000e4`c0afeae0  000000e4`c0aff240

000000e4`c0afeae8  00007ffe`cf6ac5c0 ntdll!_C_specific_handler

000000e4`c0afeaf0  00000000`00000000

000000e4`c0afeaf8  00007ffe`cf6c11cf ntdll!RtlpExecuteHandlerForException+0xf

000000e4`c0afeb00  00000000`00000000

000000e4`c0afeb08  000000e4`c0aff070

_ _ _ _ _ _ _ _ _ _ _ _ _ _ _ _

08 000000e4`c0afeb00 00007ffe`cf68a209 ntdll!RtlpExecuteHandlerForException+0xf

08 000000e4`c0afeb00 00007ffe`cf68a209 ntdll!RtlpExecuteHandlerForException+0xf

rax=000000000000005b rbx=0000000000000000 rcx=0000000000000003

rdx=000000e4c0afe888 rsi=000000e4c0aff730 rdi=0000000000000000

rip=00007ffecf6c11cf rsp=000000e4c0afeb00 rbp=000000e4c0aff070

r8=0000000000000000  r9=00000000ffffffff r10=0000000000000000

r11=000000e4c0afdc30 r12=00007ffecf6ac5c0 r13=000000e4c0aff240

r14=000000e4c0afeb70 r15=0000000000000000

iopl=0         nv up ei pl zr na po nc

cs=0033  ss=002b  ds=002b  es=002b  fs=0053  gs=002b             efl=00000246

ntdll!RtlpExecuteHandlerForException+0xf:

00007ffe`cf6c11cf 90              nop

000000e4`c0afeb00  00000000`00000000

000000e4`c0afeb08  000000e4`c0aff070

000000e4`c0afeb10  000000e4`c0aff730

000000e4`c0afeb18  000000e4`c0aff730

000000e4`c0afeb20  000000e4`c0aff0c0

000000e4`c0afeb28  00007ffe`cf68a209 ntdll!RtlDispatchException+0x219

000000e4`c0afeb30  000000e4`00000001

000000e4`c0afeb38  00007ffe`cf620000 ntdll!RtlStringCchCopyW <PERF> (ntdll+0x0)

000000e4`c0afeb40  00000000`00000000

000000e4`c0afeb48  00007ffe`cf78e9f0 ntdll!__PchSym_ <PERF> (ntdll+0x16e9f0)

000000e4`c0afeb50  000000e4`c0afeb70

000000e4`c0afeb58  000000e4`c0aff090

000000e4`c0afeb60  000000e4`c0aff080

000000e4`c0afeb68  00000000`00000000

000000e4`c0afeb70  000000e4`00000000

000000e4`c0afeb78  00007ffe`cc8300f0 KERNELBASE!UrlHashW <PERF> (KERNELBASE+0xf0)

_ _ _ _ _ _ _ _ _ _ _ _ _ _ _ _

09 000000e4`c0afeb30 00007ffe`cf6bfe3e ntdll!RtlDispatchException+0x219

09 000000e4`c0afeb30 00007ffe`cf6bfe3e ntdll!RtlDispatchException+0x219

rax=000000000000005b rbx=0000000000000000 rcx=0000000000000003

rdx=000000e4c0afe888 rsi=000000e4c0aff730 rdi=0000000000000000

rip=00007ffecf68a209 rsp=000000e4c0afeb30 rbp=000000e4c0aff070

r8=0000000000000000  r9=00000000ffffffff r10=0000000000000000

r11=000000e4c0afdc30 r12=00007ffecf6ac5c0 r13=000000e4c0aff240

r14=000000e4c0afeb70 r15=0000000000000000

iopl=0         nv up ei pl zr na po nc

cs=0033  ss=002b  ds=002b  es=002b  fs=0053  gs=002b             efl=00000246

ntdll!RtlDispatchException+0x219:

00007ffe`cf68a209 8bd0            mov     edx,eax

000000e4`c0afeb30  000000e4`00000001

000000e4`c0afeb38  00007ffe`cf620000 ntdll!RtlStringCchCopyW <PERF> (ntdll+0x0)

000000e4`c0afeb40  00000000`00000000

000000e4`c0afeb48  00007ffe`cf78e9f0 ntdll!__PchSym_ <PERF> (ntdll+0x16e9f0)

000000e4`c0afeb50  000000e4`c0afeb70

000000e4`c0afeb58  000000e4`c0aff090

000000e4`c0afeb60  000000e4`c0aff080

000000e4`c0afeb68  00000000`00000000

000000e4`c0afeb70  000000e4`00000000

000000e4`c0afeb78  00007ffe`cc8300f0 KERNELBASE!UrlHashW <PERF> (KERNELBASE+0xf0)

000000e4`c0afeb80  00000001`00000000

000000e4`c0afeb88  00000012`00000018

000000e4`c0afeb90  00000000`00000000

000000e4`c0afeb98  00360030`00300030

000000e4`c0afeba0  00001f80`0010000f

000000e4`c0afeba8  00000000`00000033

_ _ _ _ _ _ _ _ _ _ _ _ _ _ _ _

0a 000000e4`c0aff240 00007ffe`cc8f0aa2 ntdll!KiUserExceptionDispatch+0x2e

0a 000000e4`c0aff240 00007ffe`cc8f0aa2 ntdll!KiUserExceptionDispatch+0x2e

rax=000000000000005b rbx=000002075d662a10 rcx=0000000000000003

rdx=000000e4c0afe888 rsi=0000000000000000 rdi=000002075d666e40

rip=00007ffecf6bfe3e rsp=000000e4c0aff240 rbp=0000000000000000

r8=0000000000000000  r9=00000000ffffffff r10=0000000000000000

r11=000000e4c0afdc30 r12=0000000000000000 r13=0000000000000000

r14=0000000000000000 r15=0000000000000000

iopl=0         nv up ei pl zr na po nc

cs=0033  ss=002b  ds=002b  es=002b  fs=0053  gs=002b             efl=00000246

ntdll!KiUserExceptionDispatch+0x2e:

00007ffe`cf6bfe3e 84c0            test    al,al

000000e4`c0aff240  00007ff6`c8ac32f0 FrameTrace!`string'

000000e4`c0aff248  00000000`000a0008

000000e4`c0aff250  00000207`5d662a10

000000e4`c0aff258  00007ff6`00200000

000000e4`c0aff260  000000e4`c0aff2f0

000000e4`c0aff268  000000e4`c0aff2f0

000000e4`c0aff270  00001f80`0010005f

000000e4`c0aff278  0053002b`002b0033

000000e4`c0aff280  00000246`002b002b

000000e4`c0aff288  00000000`00000000

000000e4`c0aff290  00000000`00000000

000000e4`c0aff298  00000000`00000000

000000e4`c0aff2a0  00000000`00000000

000000e4`c0aff2a8  00000000`00000000

000000e4`c0aff2b0  00000000`00000000

000000e4`c0aff2b8  000000e4`c0aff970

_ _ _ _ _ _ _ _ _ _ _ _ _ _ _ _

0b 000000e4`c0aff948 00007ff6`c8ab1568 KERNELBASE!wil::details::DebugBreak+0x2

0b 000000e4`c0aff948 00007ff6`c8ab1568 KERNELBASE!wil::details::DebugBreak+0x2

rax=000000000000005b rbx=000002075d662a10 rcx=0000000000000003

rdx=000000e4c0afe888 rsi=0000000000000000 rdi=000002075d666e40

rip=00007ffecc8f0aa2 rsp=000000e4c0aff948 rbp=0000000000000000

r8=0000000000000000  r9=00000000ffffffff r10=0000000000000000

r11=000000e4c0afdc30 r12=0000000000000000 r13=0000000000000000

r14=0000000000000000 r15=0000000000000000

iopl=0         nv up ei pl zr na po nc

cs=0033  ss=002b  ds=002b  es=002b  fs=0053  gs=002b             efl=00000246

KERNELBASE!wil::details::DebugBreak+0x2:

00007ffe`cc8f0aa2 cc              int     3

000000e4`c0aff948  00007ff6`c8ab1568 FrameTrace!foo+0x68 [C:\NewWork\FrameTrace\FrameTrace.cpp @ 14]

000000e4`c0aff950  000000e4`c0aff970

000000e4`c0aff958  000000e4`c0aff9d0

000000e4`c0aff960  00000000`000000d0

000000e4`c0aff968  00000207`5d66a990

000000e4`c0aff970  00000207`5d66b070

000000e4`c0aff978  00007ff6`c8ab15ed FrameTrace!std::basic_string<wchar_t,std::char_traits<wchar_t>, std::allocator<wchar_t> >::operator+=+0x1d [C:\Program Files (x86)\Microsoft Visual Studio\2019\Professional\VC\Tools\MSVC\14.26.28801\include\xstring @ 2821]

000000e4`c0aff980  00000000`000001a0

000000e4`c0aff988  00000000`000001a7

000000e4`c0aff990  0000e8d4`e5494150

000000e4`c0aff998  0000e8d4`e5494150

000000e4`c0aff9a0  000000e4`c0affa30

000000e4`c0aff9a8  00007ff6`c8ab1560 FrameTrace!foo+0x60 [C:\NewWork\FrameTrace\FrameTrace.cpp @ 11]

000000e4`c0aff9b0  00000000`00000000

000000e4`c0aff9b8  000000e4`c0aff9d0

000000e4`c0aff9c0  00000000`00000068

_ _ _ _ _ _ _ _ _ _ _ _ _ _ _ _

0c 000000e4`c0aff950 00007ff6`c8ab1560 FrameTrace!foo+0x68 [C:\NewWork\FrameTrace\FrameTrace.cpp @ 14]

0c 000000e4`c0aff950 00007ff6`c8ab1560 FrameTrace!foo+0x68 [C:\NewWork\FrameTrace\FrameTrace.cpp @ 14]

rax=000000000000005b rbx=000002075d662a10 rcx=0000000000000003

rdx=000000e4c0afe888 rsi=0000000000000000 rdi=000002075d666e40

rip=00007ff6c8ab1568 rsp=000000e4c0aff950 rbp=0000000000000000

r8=0000000000000000  r9=00000000ffffffff r10=0000000000000000

r11=000000e4c0afdc30 r12=0000000000000000 r13=0000000000000000

r14=0000000000000000 r15=0000000000000000

iopl=0         nv up ei pl zr na po nc

cs=0033  ss=002b  ds=002b  es=002b  fs=0053  gs=002b             efl=00000246

FrameTrace!foo+0x68:

00007ff6`c8ab1568 90              nop

000000e4`c0aff950  000000e4`c0aff970

000000e4`c0aff958  000000e4`c0aff9d0

000000e4`c0aff960  00000000`000000d0

000000e4`c0aff968  00000207`5d66a990

000000e4`c0aff970  00000207`5d66b070

000000e4`c0aff978  00007ff6`c8ab15ed FrameTrace!std::basic_string<wchar_t,std::char_traits<wchar_t>, std::allocator<wchar_t> >::operator+=+0x1d [C:\Program Files (x86)\Microsoft Visual Studio\2019\Professional\VC\Tools\MSVC\14.26.28801\include\xstring @ 2821]

000000e4`c0aff980  00000000`000001a0

000000e4`c0aff988  00000000`000001a7

000000e4`c0aff990  0000e8d4`e5494150

000000e4`c0aff998  0000e8d4`e5494150

000000e4`c0aff9a0  000000e4`c0affa30

000000e4`c0aff9a8  00007ff6`c8ab1560 FrameTrace!foo+0x60 [C:\NewWork\FrameTrace\FrameTrace.cpp @ 11]

000000e4`c0aff9b0  00000000`00000000

000000e4`c0aff9b8  000000e4`c0aff9d0

000000e4`c0aff9c0  00000000`00000068

000000e4`c0aff9c8  00000207`5d66a8a0

_ _ _ _ _ _ _ _ _ _ _ _ _ _ _ _

[...]
We need to reset the current context after the command above since the last frame becomes the current:
0:000> kc

  *** Stack trace for last set context - .thread/.cxr resets it

 # Call Site

15 ntdll!RtlUserThreadStart
0:000> .cxr

Resetting default scope
0:000> kc

 # Call Site

00 ntdll!NtWaitForMultipleObjects

01 KERNELBASE!WaitForMultipleObjectsEx

02 KERNELBASE!WaitForMultipleObjects

03 kernel32!WerpReportFaultInternal

04 kernel32!WerpReportFault

05 KERNELBASE!UnhandledExceptionFilter

06 ntdll!RtlUserThreadStart$filt$0

07 ntdll!_C_specific_handler

08 ntdll!RtlpExecuteHandlerForException

09 ntdll!RtlDispatchException

0a ntdll!KiUserExceptionDispatch

0b KERNELBASE!wil::details::DebugBreak

0c FrameTrace!foo

0d FrameTrace!foo

0e FrameTrace!foo

0f FrameTrace!foo

10 FrameTrace!foo

11 FrameTrace!foo

12 FrameTrace!main

13 FrameTrace!invoke_main

14 FrameTrace!__scrt_common_main_seh

15 kernel32!BaseThreadInitThunk

16 ntdll!RtlUserThreadStart
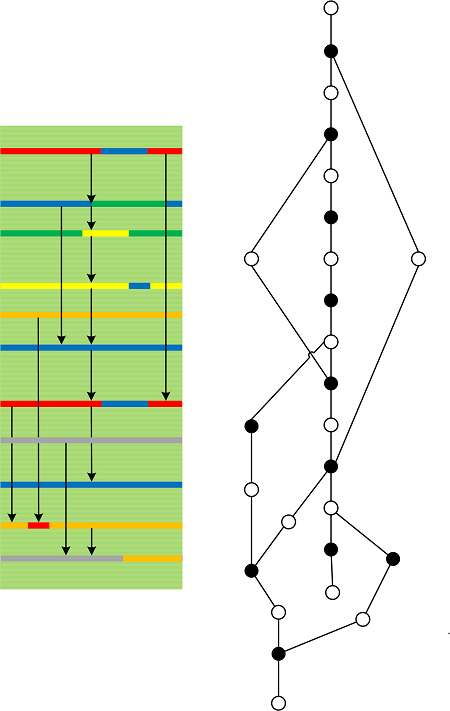
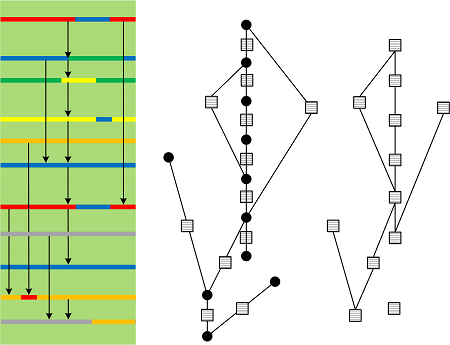
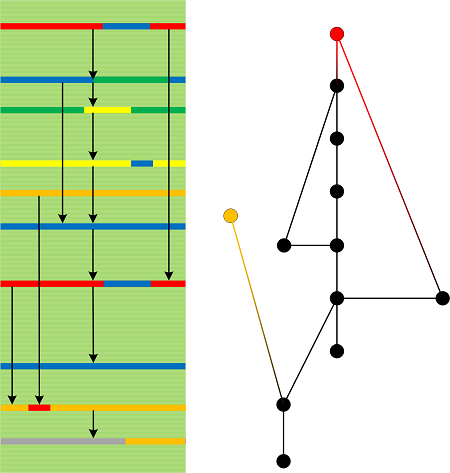
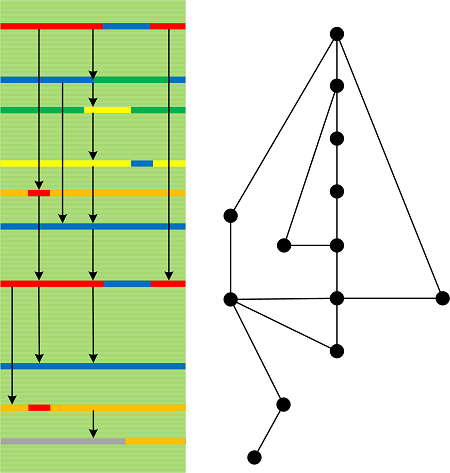
We call this analysis pattern Frame Trace.
The example memory dump, the application PDB file, and source code can be downloaded from here.
- Dmitry Vostokov @ DumpAnalysis.org + TraceAnalysis.org -