Bugtation No.87
April 26th, 2009“A” fix “can break a” bug “in two.”
- Dmitry Vostokov @ DumpAnalysis.org -
“A” fix “can break a” bug “in two.”
- Dmitry Vostokov @ DumpAnalysis.org -
“It is easier to know” programming “in general than to understand one” program “in particular.”
François de La Rochefoucauld, Maxims
- Dmitry Vostokov @ DumpAnalysis.org -
I finally read this book from cover to cover and I must say it is the very sound book and presents a consistent approach to debugging real-life problems with user-land C and C++ code on Linux environments.
The Developer’s Guide to Debugging

Although it uses mainly GDB for illustrations and provides Visual C++ equivalents when possible it doesn’t cover Debugging Tools for Windows and its main GUI debugger, WinDbg. To rectify this I created extensive notes while reading.
Additional reader audience for this book might include a Windows engineer who needs to debug software on Linux or FreeBSD so a quick GDB crash course is needed. It would also serve as an excellent debugging course or as a supplemental course to any C or C++ course. Highly recommended if you are a Linux C/C++ software engineer. Even if you are an experienced one, you will find something new or make your debugging more consistent. If you need to teach or mentor juniors, this book helps too.
- Dmitry Vostokov @ DumpAnalysis.org -
Noticed UnusualBoost in !process WinDbg command output from the complete memory dump taken from Windows 7 Beta which I’m evaluating for the purposes of memory dump analysis:
THREAD 852b5d48  Cid 071c.0950  Teb: 7ff9c000 Win32Thread: fe1fc008 WAIT: (WrUserRequest) UserMode Non-Alertable

    853e0690  SynchronizationEvent

Not impersonating

DeviceMap                 8f909fc8

Owning Process            8538a030       Image:         explorer.exe

Attached Process          N/A            Image:         N/A

Wait Start TickCount      47057          Ticks: 9460 (0:00:02:27.812)

Context Switch Count      61

UserTime                  00:00:00.000

KernelTime                00:00:00.046

Win32 Start Address WINMM!mciwindow (0x73942761)

Stack Init 904b9fd0 Current 904b9a60 Base 904ba000 Limit 904b7000 Call 0

Priority 13 BasePriority 10 UnusualBoost 0 ForegroundBoost 2 IoPriority 2 PagePriority 5

Kernel stack not resident.

ChildEBP RetAddr

904b9a78 8268951d nt!KiSwapContext+0×26

904b9abc 826cf460 nt!KiSwapThread+0×57b

904b9b10 8268ccaf nt!KiCommitThreadWait+0×340

904b9be8 8e50c768 nt!KeWaitForSingleObject+0×3ee

904b9c44 8e50c575 win32k!xxxRealSleepThread+0×1d7

904b9c60 8e508379 win32k!xxxSleepThread+0×2d

904b9cb8 8e50cf9a win32k!xxxRealInternalGetMessage+0×4b2

904b9d1c 8269066a win32k!NtUserGetMessage+0×3f

904b9d1c 771e5704 nt!KiFastCallEntry+0×12a

053af7e8 76fdbb29 ntdll!KiFastSystemCallRet

053af7ec 76fd3f49 USER32!NtUserGetMessage+0xc

053af810 739427e0 USER32!GetMessageA+0×8d

053af848 76f536d6 WINMM!mciwindow+0×102

053af854 771c883c kernel32!BaseThreadInitThunk+0xe

053af894 771c880f ntdll!__RtlUserThreadStart+0×70

053af8ac 00000000 ntdll!_RtlUserThreadStart+0×1b
There is also ForegroundBoost but its meaning is obvious to me.
- Dmitry Vostokov @ DumpAnalysis.org -
I looked at thread raw stack in a process dump from Windows Server 2008 and found ntdll!FinalExceptionHandler symbol:
Loading Dump File [App.dmp]

User Mini Dump File with Full Memory: Only application data is available

Windows Server 2008/Windows Vista Version 6001 (Service Pack 1) MP (4 procs) Free x86 compatible
0:000> !teb
TEB at 7ffde000
ExceptionList: 0022fdd8
StackBase: 00230000
StackLimit: 00225000
SubSystemTib: 00000000
FiberData: 00001e00
ArbitraryUserPointer: 00000000
Self: 7ffde000
EnvironmentPointer: 00000000
ClientId: 00002458 . 00002478
RpcHandle: 00000000
Tls Storage: 7ffde02c
PEB Address: 7ffdf000
LastErrorValue: 0
LastStatusValue: c0000035
Count Owned Locks: 0
HardErrorMode: 0
0:000> dds 00225000 00230000

[...]

0022ff7c  00000000

0022ff80  00000000

0022ff84  00000000

0022ff88  0022ff94

0022ff8c  76744911 kernel32!BaseThreadInitThunk+0xe

0022ff90  7ffdf000

0022ff94  0022ffd4

0022ff98  77b5e4b6 ntdll!__RtlUserThreadStart+0x23

0022ff9c  7ffdf000

0022ffa0  2497b80a

0022ffa4  00000000

0022ffa8  00000000

0022ffac  7ffdf000

0022ffb0  00000000

0022ffb4  00000000

0022ffb8  00000000

0022ffbc  0022ffa0

0022ffc0  00000000

0022ffc4  0022ffe4

0022ffc8  77b29834 ntdll!_except_handler4

0022ffcc  530d7826

0022ffd0  00000000

0022ffd4  0022ffec

0022ffd8  77b5e489 ntdll!_RtlUserThreadStart+0x1b

0022ffdc  00401110 App+0x1110

0022ffe0  7ffdf000

0022ffe4  ffffffff

0022ffe8  77bc75de ntdll!FinalExceptionHandler

0022ffec  00000000

0022fff0  00000000

0022fff4  00401110 App+0×1110

0022fff8  7ffdf000

0022fffc  00000000

00230000  78746341
Search on Internet led me to this very interesting review article about Windows memory protection mechanisms:
http://taossa.com/archive/bh08sotirovdowd.pdf
It also explains this new “Final” exception mechanism in W2K8.
I couldn’t find this in raw stack traces on Windows 7 so it might be the case that it is not enabled by default there like in Windows Vista.
- Dmitry Vostokov @ DumpAnalysis.org -
One application was hanging after printing and its user dump was taken. Inspection of threads reveals only one blocked thread:
0:000> ~*kL
.  0  Id: 486c.5704 Suspend: 1 Teb: 7ffa9000 Unfrozen

ChildEBP RetAddr

01c0fb68 7c827cfb ntdll!KiFastSystemCallRet

01c0fb6c 77e6202c ntdll!NtWaitForMultipleObjects+0xc

01c0fc14 77e62fbe kernel32!WaitForMultipleObjectsEx+0x11a

01c0fc30 00439f16 kernel32!WaitForMultipleObjects+0×18

01c0fd94 77bcaed6 App!~MyPrinter+0xe

01c0fdc0 77bcaf82 msvcrt!_cinit+0xad

01c0fdd0 77baf582 msvcrt!_cexit+0xb

01c0fde0 7c81a352 msvcrt!__CRTDLL_INIT+0×15c

01c0fe00 7c830e70 ntdll!LdrpCallInitRoutine+0×14

01c0feb8 77e668a3 ntdll!LdrShutdownProcess+0×182
We see that the process was being terminated and the last thread was blocked in a destructor of MyPrinter class. However we see some historical information, faultrep.dll unloaded, and this means that some exception happened prior to the process shutdown:
0:000> lm

[...]

Unloaded modules:

69500000 69517000   faultrep.dll

[…]
Then we look at the thread raw stack to see any signs of execution residue and hidden exceptions in particular:
0:000> !teb

TEB at 7ffa9000

    ExceptionList:        01c0fc04

    StackBase:            01c10000

    StackLimit:           01c08000

    SubSystemTib:         00000000

    FiberData:            00001e00

    ArbitraryUserPointer: 00000000

    Self:                 7ffa9000

    EnvironmentPointer:   00000000

    ClientId:             0000486c . 00005704

    RpcHandle:            00000000

    Tls Storage:          00000000

    PEB Address:          7ffd9000

    LastErrorValue:       0

    LastStatusValue:      c0000010

    Count Owned Locks:    0

    HardErrorMode:        0
0:000> dds 01c08000 01c10000

01c08000  00000000

01c08004  00000000

01c08008  00000000

[...]

01c0e704  00001000

01c0e708  01c0ea14

01c0e70c  7c82855e ntdll!KiUserExceptionDispatcher+0xe

01c0e710  01c0a000

01c0e714  01c0e73c

01c0e718  01c0e720

01c0e71c  01c0e73c

01c0e720  c0000005

01c0e724  00000000

01c0e728  00000000

01c0e72c  7c82a756 ntdll!RtlpCoalesceFreeBlocks+0×370

01c0e730  00000002

01c0e734  00000000

[…]
Applying exception context we see heap corruption:
0:000> .cxr 01c0e73c

eax=01998db0 ebx=00370000 ecx=01998db0 edx=4d445443 esi=01998da8 edi=01998010

eip=7c82a756 esp=01c0ea08 ebp=01c0ea14 iopl=0 nv up ei pl zr na pe nc

cs=001b ss=0023 ds=0023 es=0023 fs=003b gs=0000    efl=00010246

ntdll!RtlpCoalesceFreeBlocks+0×370:

7c82a756 3b4a04  cmp    ecx,dword ptr [edx+4] ds:0023:4d445447=????????
However stack trace a bit incorrect at the end (shown in magenta) but this can be explained that it is a residual stack trace that happened in the past with some data overwritten by exception processing:
0:000> kL

  *** Stack trace for last set context - .thread/.cxr resets it

ChildEBP RetAddr

01c0ea14 7c82a82b ntdll!RtlpCoalesceFreeBlocks+0x370

01c0eafc 77bbcef6 ntdll!RtlFreeHeap+0x38e

01c0eb44 00421fdc msvcrt!free+0xc3

01c0eb6c 00422395 App!SetData+0x3a5

[...]

01c0f81c 7c829f60 App!CreatePrinter+0x6a

01c0f824 7c829f59 ntdll!CheckHeapFillPattern+0×64

01c0f948 7c82770b ntdll!RtlFreeHeap+0×70f

01c0f96c 77c27631 ntdll!NtQueryValueKey+0xc

01c0fab8 00000000 gdi32!ReadDisableMetaFilesRegKey+0xfc
Because the hang happens after printing we detect old printer drivers in the module list (certainly not my version of the environment used for application testing):
0:000> lmt

start    end        module name

[...]

6b900000 6b925000   PrinterDriverA  [...] 2002

6c900000 6c947000   PrinterDriverB  […] 2002

[…]
- Dmitry Vostokov @ DumpAnalysis.org -
If we assume the model-based definition of software defects we can easily see that any changes to an underlying model can surface the new unanticipated defects and hide the known ones. New and evolving disciplines like software security engineering can change our views about solid code and create defects by introducing non-functional constraints on models. Another aspect of this is the interaction of a human debugger with code, the very act of reading code can create defects. However the latter effect is controversial and belongs to the evolving quantum theory of software defects (see my previous post about bugtanglement).
- Dmitry Vostokov @ DumpAnalysis.org -
Before we explain stages of the analysis process shown in Part 1, let’s start with a brief overview of memory dumps, debuggers and logs. Recall that a memory dump is a snapshot of a process, system or physical memory state. This unifies post-mortem analysis and live debugging. Debuggers are tools that allow us to get and modify these memory snapshots. Other tools that allow us to get memory dump files are process dumpers like userdump.exe, Task Manager since Vista, WER, and system dumpers like LiveKd and Win32dd. We should not forget tools and methods that allow us to trigger Windows kernel ability to save consistent memory dump files: NMI button, keyboard method and various software bugcheck-triggers like Citrix SystemDump. Now coming back to debuggers. One of their essential features is to save a debugging session log, formatted textual output saved in a text file for further processing. One good example is !process 0 ff WinDbg command to output all processes and their thread stack traces (see Stack Trace Collection pattern for other variations).
I’ve created a page to add all P-DMA parts as soon as I write them:
Pattern-Driven Memory Analysis
- Dmitry Vostokov @ DumpAnalysis.org -
I used to be a fun of Yanni music in the late 1990s. Today I started listening again to some of his albums and recommend them for any debugging session. If you are new to this music there is a compilation album that I’m listening to while I’m writing this post:

Here is my version of track titles inspired by listening (with my comments in italics):
1. In the Memory Dump File
2. The Morning Session
3. Love for Debugging
4. A Debugger’s Dream
5. Within Kernel
6. Forbidden Access
7. Once Upon a Second Chance
8. Chasing Bugs
9. The Main Thread [Special Debugging Version]
10. Quiet Memory Analyst
11. Debugging Joy (My Life is Debugging)
12. So Long My Debugger (My Only Friend on Virtual Memory Plains)
13. Before I Leave the Debugger
14. End of Session (It wasn’t bad after all)
15. Face in the Memory Dump (after applying Natural Memory Visualization techniques: you can see pictures and various artifacts stored in memory buffers)
- Dmitry Vostokov @ DumpAnalysis.org -
DumpAnalysis.org announces forthcoming 2011 - 2020 as The Debugging Decade.
Q&A
Q. Why 2011 - 2020?
A. The main reason is the fact that 2009 is The Year of Debugging and 2010 is The Year of Dump Analysis. This naturally extends to a decade.
Q. Do you plan The Debugging Century?
A. Yes, I do. Details will be announced later.
- Dmitry Vostokov @ DumpAnalysis.org -
The system was hanging and a manual kernel dump file was generated:
0: kd> !analyze -v

[...]

NMI_HARDWARE_FAILURE (80)

This is typically due to a hardware malfunction.  The hardware supplier should

be called.

Arguments:

Arg1: 004f4454

Arg2: 00000000

Arg3: 00000000

Arg4: 00000000

[...]
Initially it looked like an earlier premature crash dump taken after the reboot:
0: kd> version

[...]

System Uptime: 0 days 0:00:54.203

[…]
However the incident description stated that the system was hanging during its startup so we went further to look at a stack trace collection of all its threads and found the main thread of spooler was hanging for about 23 seconds after 4 seconds since process creation:
0: kd> !process 0 ff
[...]
PROCESS 8cf06020  SessionId: 0  Cid: 04a4    Peb: 7ffde000  ParentCid: 0244

    DirBase: cff8c1a0  ObjectTable: d70086d0  HandleCount:  24.

    Image: spoolsv.exe

    VadRoot 8bb19130 Vads 32 Clone 0 Private 60. Modified 0. Locked 0.

    DeviceMap d66028f0

    Token                             d6e88988

    ElapsedTime                       00:00:27.921

    UserTime                          00:00:00.000

    KernelTime                        00:00:00.000

    QuotaPoolUsage[PagedPool]         27844

    QuotaPoolUsage[NonPagedPool]      1280

    Working Set Sizes (now,min,max)  (312, 50, 345) (1248KB, 200KB, 1380KB)

    PeakWorkingSetSize                312

    VirtualSize                       12 Mb

    PeakVirtualSize                   12 Mb

    PageFaultCount                    322

    MemoryPriority                    BACKGROUND

    BasePriority                      8

    CommitCharge                      80
THREAD 8cf22db0  Cid 04a4.04a8  Teb: 7ffdd000 Win32Thread: bc155948 WAIT: (Unknown) KernelMode Non-Alertable

    8beeca28  SynchronizationEvent

IRP List:

    8beecd08: (0006,0094) Flags: 00000884  Mdl: 00000000

Not impersonating

DeviceMap                 d66028f0

Owning Process            8cf06020       Image:         spoolsv.exe

Attached Process          N/A            Image:         N/A

Wait Start TickCount      1981           Ticks: 1488 (0:00:00:23.250)

Context Switch Count      9                 LargeStack

UserTime                  00:00:00.000

KernelTime                00:00:00.000

Win32 Start Address 0×0100468c

Start Address 0×77e617f8

Stack Init b6a63b30 Current b6a630cc Base b6a64000 Limit b6a60000 Call b6a63b34

Priority 9 BasePriority 8 PriorityDecrement 0

ChildEBP RetAddr

b6a630e4 80833465 nt!KiSwapContext+0×26

b6a63110 80829a62 nt!KiSwapThread+0×2e5

b6a63158 b5dbc727 nt!KeWaitForSingleObject+0×346

b6a6318c b5dbd020 mrxdav!RxConstructSrvCall+0×187

b6a63200 b5dbd144 mrxdav!RxFindOrCreateConnections+0×58a

b6a6324c b5dbd552 mrxdav!RxConstructVirtualNetRoot+0×38

b6a632b8 b5db27fc mrxdav!RxFindOrConstructVirtualNetRoot+0×220

b6a63304 b5da7ff1 mrxdav!RxPrefixClaim+0×160

b6a6331c b5d93f72 mrxdav!RxCommonDevFCBIoCtl+0×71

b6a633ac b5da780c mrxdav!RxFsdCommonDispatch+0×320

b6a633cc b5da0fc4 mrxdav!RxFsdDispatch+0xd4

b6a63440 8081df65 mrxdav!MRxDAVFsdDispatch+0×1f0

b6a63454 bace232e nt!IofCallDriver+0×45

b6a63460 bace24f6 Mup!MupiIssueQueryRequest+0×18

b6a63488 bace2414 Mup!MupiResolvePrefix+0×11b

b6a634d4 bacdf4ed Mup!CreateRedirectedFile+0×385

b6a63530 8081df65 Mup!MupCreate+0×1cb

b6a63544 808f8f71 nt!IofCallDriver+0×45

b6a6362c 80937942 nt!IopParseDevice+0xa35

b6a636ac 80933a76 nt!ObpLookupObjectName+0×5b0

b6a63700 808ec76b nt!ObOpenObjectByName+0xea

b6a63884 8088978c nt!NtQueryAttributesFile+0×11d

b6a63884 7c8285ec nt!KiFastCallEntry+0xfc (TrapFrame @ b6a63894)
Looking at IRP we see that I/O request was redirected to the following file share:
0: kd> !irp 8beecd08

Irp is active with 1 stacks 1 is current (= 0x8beecd78)

 No Mdl: No System Buffer: Thread 8cf22db0:  Irp stack trace.

     cmd  flg cl Device   File     Completion-Context

>[  0, 0]   0  0 8cfdcee8 b6a637f0 00000000-00000000

        \FileSystem\Mup

   Args: b6a63570 01200000 00070000 00000000
0: kd> !fileobj b6a637f0
\SERVER-A\f$\AppFiles\Component.dll
Device Object: 0x8cfdcee8   \FileSystem\Mup

Vpb is NULL
Flags: 0x0
CurrentByteOffset: 0
When looking at other processes we see 2 threads blocked in svchost.exe in the same redirector component:
0: kd> !stacks

Proc.Thread  .Thread  Ticks   ThreadState Blocker

[...]

                            [8bb2a728 svchost.exe]

 3d0.0003d4  8bb2a290 0000701 Blocked    nt!NtReadFile+0x5d5

 3d0.0003d8  8bb2aba0 00006ff Blocked    nt!ObpWaitForMultipleObjects+0x202

 3d0.0003dc  8bb338c0 00005eb Blocked    nt!ObpWaitForMultipleObjects+0x202

 3d0.0003e8  8bb2cdb0 0000892 Blocked    nt!ObpWaitForMultipleObjects+0x202

 3d0.0003ec  8bb2c838 0000892 Blocked    nt!KiFastCallEntry+0xfc

 3d0.0003f0  8bb26cd0 0000892 Blocked    nt!KiFastCallEntry+0xfc

 3d0.000488  8ceffb88 00006fb Blocked    mrxdav!UMRxAssignWork+0xdf

 3d0.00048c  8cec3db0 00005d0 Blocked    mrxdav!UMRxAssignWork+0xdf

 3d0.000490  8cec3b40 00006fb Blocked    nt!KiFastCallEntry+0xfc

 3d0.0004d4  8bb02918 00005c7 Blocked    nt!KiFastCallEntry+0xfc

 3d0.0004d8  8bafdb40 00005c4 Blocked    nt!KiFastCallEntry+0xfc

[…]
In these two threads we see pass through functions in driverA and driverB:
0: kd> !thread 8ceffb88

THREAD 8ceffb88  Cid 03d0.0488  Teb: 7ffd8000 Win32Thread: 00000000 WAIT: (Unknown) UserMode Non-Alertable

    8cef1f28  QueueObject

Not impersonating

DeviceMap                 d6e2c298

Owning Process            8bb2a728       Image:         svchost.exe

Attached Process          N/A            Image:         N/A

Wait Start TickCount      1682           Ticks: 1787 (0:00:00:27.921)

Context Switch Count      2

UserTime                  00:00:00.000

KernelTime                00:00:00.000

Win32 Start Address 0x5a005e80

Start Address 0x77e617ec

Stack Init b5ed8000 Current b5ed7a64 Base b5ed8000 Limit b5ed5000 Call 0

Priority 8 BasePriority 8 PriorityDecrement 0

ChildEBP RetAddr

b5ed7a7c 80833465 nt!KiSwapContext+0x26

b5ed7aa8 8082b60f nt!KiSwapThread+0x2e5

b5ed7af0 b5da714d nt!KeRemoveQueue+0x417

b5ed7b10 b5d9d7db mrxdav!UMRxAssignWork+0xdf

b5ed7b70 bae71bc5 mrxdav!MRxDAVFastIoDeviceControl+0x13d

b5ed7ba8 bae7f42d fltmgr!FltpPerformFastIoCall+0x153

b5ed7bf4 b5f57300 fltmgr!FltpFastIoDeviceControl+0xb1

b5ed7c20 b6e20f8f driverB!FS_FastIoDeviceControl+0×60

b5ed7c5c 808f5e2f driverA!FastIoDeviceControl+0xcf

b5ed7d00 808eed08 nt!IopXxxControlFile+0×255

b5ed7d34 8088978c nt!NtDeviceIoControlFile+0×2a

b5ed7d34 7c8285ec nt!KiFastCallEntry+0xfc (TrapFrame @ b5ed7d64)
- Dmitry Vostokov @ DumpAnalysis.org -
A number of Copernican revolutions occurred or announced in various branches of various sciences. Now it’s my turn to say that action-based ”earth-centric” debugging is replaced by memory (dump) analysis as a “heliocentric” foundation of debugging. Because even in live debugging we have memory snapshots and differential memory analysis. Traces in trace-based debugging is another example of universal memory dumps. Therefore memory (dump) analysis comes first.
- Dmitry Vostokov @ DumpAnalysis.org -
Here is the promised case study for the previous post about data NULL pointers. The complete dump has this bugcheck:
0: kd> !analyze -v
[...]
KERNEL_MODE_EXCEPTION_NOT_HANDLED (8e)

This is a very common bugcheck.  Usually the exception address pinpoints the driver/function that caused the problem.  Always note this address as well as the link date of the driver/image that contains this address. Some common problems are exception code 0x80000003.  This means a hard coded breakpoint or assertion was hit, but this system was booted /NODEBUG.  This is not supposed to happen as developers should never have hardcoded breakpoints in retail code, but ... If this happens, make sure a debugger gets connected, and the system is booted /DEBUG.  This will let us see why this breakpoint is happening.

Arguments:

Arg1: c0000005, The exception code that was not handled

Arg2: 8081c7c4, The address that the exception occurred at

Arg3: f1b5d730, Trap Frame

Arg4: 00000000
[...]
FAULTING_IP:

nt!IoIsOperationSynchronous+e

8081c7c4 f6412c02        test    byte ptr [ecx+2Ch],2
TRAP_FRAME:  f1b5d730 -- (.trap 0xfffffffff1b5d730)

[...]
0: kd> .trap 0xfffffffff1b5d730

ErrCode = 00000000

eax=8923b008 ebx=00000000 ecx=00000000 edx=8923b008 esi=891312d0 edi=89f0b300

eip=8081c7c4 esp=f1b5d7a4 ebp=f1b5d7a4 iopl=0 nv up ei ng nz ac pe nc

cs=0008 ss=0010 ds=0023 es=0023 fs=0030 gs=0000 efl=00010296

nt!IoIsOperationSynchronous+0xe:

8081c7c4 f6412c02   test    byte ptr [ecx+2Ch],2  ds:0023:0000002c=??
0: kd> kv 100

ChildEBP RetAddr  Args to Child

f1b5d7a4 f42cdea9 8923b008 89f0b300 8923b008 nt!IoIsOperationSynchronous+0xe

f1b5d7bc 8081df85 89f0b300 8923b008 00000200 driveB!FsdDeviceIoControlFile+0×19

f1b5d7d0 808ed7a9 00000000 f1b5da84 f1b5db6c nt!IofCallDriver+0×45

f1b5da20 f3c3a521 89f0b300 f1b5da84 f1b5da84 nt!IoVolumeDeviceToDosName+0×89

WARNING: Stack unwind information not available. Following frames may be wrong.

f1b5da3c f3c3b58e 00000618 e4e00420 f1b5dad4 driverA+0×18531

[…]

f1b5dc3c 8081df85 89f48b48 87fa3008 89140d30 driverA+0×1df4

f1b5dc50 808f5437 87fa3078 89140d30 87fa3008 nt!IofCallDriver+0×45

f1b5dc64 808f61bf 89f48b48 87fa3008 89140d30 nt!IopSynchronousServiceTail+0×10b

f1b5dd00 808eed08 000000f0 00000000 00000000 nt!IopXxxControlFile+0×5e5

f1b5dd34 808897bc 000000f0 00000000 00000000 nt!NtDeviceIoControlFile+0×2a

f1b5dd34 7c8285ec 000000f0 00000000 00000000 nt!KiFastCallEntry+0xfc (TrapFrame @ f1b5dd64)

0856e154 7c826fcb 77e416f5 000000f0 00000000 ntdll!KiFastSystemCallRet

0856e158 77e416f5 000000f0 00000000 00000000 ntdll!NtDeviceIoControlFile+0xc

0856e1bc 6f050c6c 000000f0 5665824c 0856e234 kernel32!DeviceIoControl+0×137

[…]
From WDK help we know that the first parameter to IoIsOperationSynchronous is a pointer to an IRP structure:
0: kd> !irp 8923b008

Irp is active with 3 stacks 3 is current (= 0x8923b0c0)

 No Mdl: System buffer=878b7288: Thread 8758a020:  Irp stack trace.

     cmd  flg cl Device   File     Completion-Context

 [  0, 0]   0  0 00000000 00000000 00000000-00000000

                     Args: 00000000 00000000 00000000 00000000

 [  0, 0]   0  0 00000000 00000000 00000000-00000000

                     Args: 00000000 00000000 00000000 00000000

>[  e, 0]   0  0 89f0b300 00000000 00000000-00000000

              \FileSystem\DriverB

                     Args: 00000200 00000000 004d0008 00000000
Disassembling the function shows some pointer dereferencing and we can reconstruct it starting from EBP+8, a pointer to an IRP.
0: kd> .asm no_code_bytes

Assembly options: no_code_bytes
0: kd> u nt!IoIsOperationSynchronous nt!IoIsOperationSynchronous+0xe

nt!IoIsOperationSynchronous:

8081c7b6 mov     edi,edi

8081c7b8 push    ebp

8081c7b9 mov     ebp,esp

8081c7bb mov     eax,dword ptr [ebp+8]

8081c7be mov     ecx,dword ptr [eax+60h]

8081c7c1 mov     ecx,dword ptr [ecx+18h]
EAX+60 seems to be a current stack location member of IRP and it is a pointer itself to _IO_STACK_LOCATION structure:
0: kd> dt -r _IRP 8923b008

ntdll!_IRP

   +0x000 Type             : 6

   +0x002 Size             : 0x268

   +0x004 MdlAddress       : (null)

   +0x008 Flags            : 0x70

[...]

   +0x038 CancelRoutine    : (null)

   +0x03c UserBuffer       : 0xf1b5d814

   +0×040 Tail             : __unnamed

      +0×000 Overlay          : __unnamed

         +0×000 DeviceQueueEntry : _KDEVICE_QUEUE_ENTRY

         +0×000 DriverContext    : [4] (null)

         +0×010 Thread           : 0×8758a020 _ETHREAD

         +0×014 AuxiliaryBuffer  : (null)

         +0×018 ListEntry        : _LIST_ENTRY [ 0×0 - 0×0 ]

         +0×020 CurrentStackLocation : 0×8923b0c0 _IO_STACK_LOCATION

[…]
ECX+18 is a pointer to a file object in _IO_STACK_LOCATION structure:
0: kd> dt _IO_STACK_LOCATION 8923b008+60

ntdll!_IO_STACK_LOCATION

   +0x000 MajorFunction    : 0xc0 ''

   +0x001 MinorFunction    : 0xb0 ''

   +0x002 Flags            : 0x23 '#'

   +0x003 Control          : 0x89 ''

   +0x004 Parameters       : __unnamed

   +0x014 DeviceObject     : (null)

   +0×018 FileObject       : (null)

   +0×01c CompletionRoutine : (null)

   +0×020 Context          : (null)
2C offset at the crash point test byte ptr [ecx+2Ch],2 is _FILE_OBJECT Flags member:
0: kd> dt _FILE_OBJECT

ntdll!_FILE_OBJECT

   +0x000 Type             : Int2B

   +0x002 Size             : Int2B

   +0x004 DeviceObject     : Ptr32 _DEVICE_OBJECT

   +0x008 Vpb              : Ptr32 _VPB

   +0x00c FsContext        : Ptr32 Void

   +0x010 FsContext2       : Ptr32 Void

   +0x014 SectionObjectPointer : Ptr32 _SECTION_OBJECT_POINTERS

   +0x018 PrivateCacheMap  : Ptr32 Void

   +0x01c FinalStatus      : Int4B

   +0x020 RelatedFileObject : Ptr32 _FILE_OBJECT

   +0x024 LockOperation    : UChar

   +0x025 DeletePending    : UChar

   +0x026 ReadAccess       : UChar

   +0x027 WriteAccess      : UChar

   +0x028 DeleteAccess     : UChar

   +0x029 SharedRead       : UChar

   +0x02a SharedWrite      : UChar

   +0x02b SharedDelete     : UChar

   +0×02c Flags            : Uint4B

   +0×030 FileName         : _UNICODE_STRING

   +0×038 CurrentByteOffset : _LARGE_INTEGER

   +0×040 Waiters          : Uint4B

   +0×044 Busy             : Uint4B

   +0×048 LastLock         : Ptr32 Void

   +0×04c Lock             : _KEVENT

   +0×05c Event            : _KEVENT

   +0×06c CompletionContext : Ptr32 _IO_COMPLETION_CONTEXT
So it looks like driverA passed an IRP with NULL File object address to driverB and this is also shown in the output of !irp command above.
- Dmitry Vostokov @ DumpAnalysis.org -
Some fellow debuggers ask me what brand of headphones I use during debugging. It depends on the working environment. In the office I use STAX electrostatic headphones, one of the previous versions of their Basic System that I bought 4 years ago, similar to this one:
http://www.stax.co.jp/Export/SRS2050II.html
I learnt about STAX in 2000, Moscow, when I was obsessed with pure sound and rushed to the nearest dealer to buy the old version of SR-001:
http://www.stax.co.jp/Export/SR001mk2e.html
- Dmitry Vostokov @ DumpAnalysis.org -
If you like me totally immerse in complete memories of computation you probably would like a complete Beethoven collection that I bought last year and now listen to the second time:
Beethoven Edition: Complete Works

- Dmitry Vostokov @ DumpAnalysis.org -
On 15th of April last year I published
The First Windows Memory Dump Analysis Book!
To celebrate its anniversary OpenTask iterative and incremental publisher will publish Volume 3 this year simultaneously with another book featuring selected articles from Volumes 1-3 printed in full color:
Memory Dump Analysis Anthology: Color Supplement for Volumes 1-3 (ISBN: 978-1906717698)
This title will compensate for the lack of color inserts in MDAA volumes.
- Dmitry Vostokov @ DumpAnalysis.org -
I aim to make Debugged! MZ/PE a quarterly publication and the next issue is to be by the end of June. Its main topic is modeling software bugs:
Debugged! MZ/PE: Modeling Software Defects, June, 2009 (ISBN: 978-1906717681)
If you have an article idea or if you’d like to write an article for this issue please use the following contact form:
http://www.dumpanalysis.org/contact
The deadline is June 15.
Here is the draft front cover:
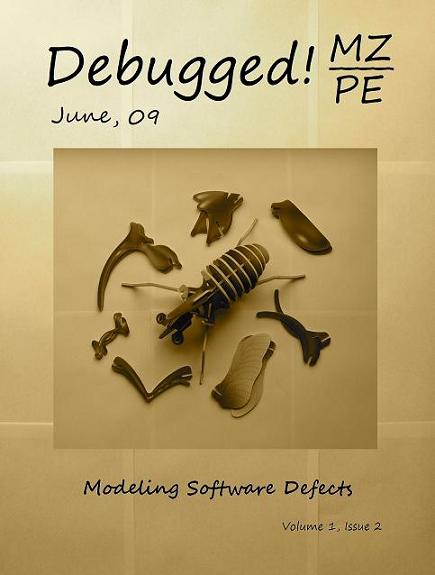
The back cover remains secret until release and will feature tips on debugging.
- Dmitry Vostokov @ DumpAnalysis.org -
NULL Data Pointer is a special version of the more general Invalid Pointer pattern like NULL Code Pointer. The effective address is below 0xFFFF and it is usually a register with 0 value and the small offset, for example:
0: kd> r

Last set context:

eax=8923b008 ebx=00000000 ecx=00000000 edx=8923b008 esi=891312d0 edi=89f0b300

eip=8081c7c4 esp=f1b5d7a4 ebp=f1b5d7a4 iopl=0 nv up ei ng nz ac pe nc

cs=0008 ss=0010 ds=0023 es=0023 fs=0030 gs=0000 efl=00010296

nt!IoIsOperationSynchronous+0xe:

8081c7c4 f6412c02  test    byte ptr [ecx+2Ch],2   ds:0023:0000002c=??
Here, after disassembling the function backwards, we see the succession of dereferences starting from [EBP+8] and this means that a pointer to a structure (an IRP here) was passed to the function and it had a data pointer in it, pointing to another structure and the latter contained an NULL pointer:
0: kd> ub 8081c7c4

nt!IoIsOperationSynchronous:

8081c7b6 8bff            mov     edi,edi

8081c7b8 55              push    ebp

8081c7b9 8bec            mov     ebp,esp

8081c7bb 8b4508          mov     eax,dword ptr [ebp+8]

8081c7be 8b4860          mov     ecx,dword ptr [eax+60h]

8081c7c1 8b4918          mov     ecx,dword ptr [ecx+18h]
Next post will feature a full case study.
Note: pointers are discussed in great detail in my latest book: Windows Debugging: Practical Foundations
- Dmitry Vostokov @ DumpAnalysis.org -
When constantly looking at Stack Trace Collections from complete or kernel memory dumps we notice that certain processes are always present and remember them. They are no longer suspicious. The same about thread stacks. Some are always present and some are not suspicious because of their function or status, like Passive Threads or Passive System Threads. Going more fine-grained we can talk about components and their specific functions. For example, certain kernel space components have special filter functions, they get an IRP and pass it down the device stack. It doesn’t take much code to check an IRP and forward it. This is usually reflected in small function offsets, for example:
ChildEBP RetAddr

aeced780 80833ec5 nt!KiSwapContext+0x26

aeced7ac 80829bc0 nt!KiSwapThread+0x2e5

aeced7f4 badffece nt!KeWaitForSingleObject+0x346

WARNING: Stack unwind information not available. Following frames may be wrong.

aeced824 bae00208 AVFilterB+0×1ece

aeced868 bae0e45a AVFilterB+0×2208

aeced8a0 8081e095 AVFilterB+0×1045a

aeced8b4 b946673b nt!IofCallDriver+0×45

aeced8c4 b94626ee driverB!FS_Dispatch+0xfb

aeced8d4 8081e095 driverB!dispatch+0×6e

aeced8e8 b96e04e1 nt!IofCallDriver+0×45

aeced90c b96e0755 driverA!PassThrough+0xd1

aeced92c 8081e095 driverA!Create+0×155

aeced940 b882df08 nt!IofCallDriver+0×45

aeceda5c 8081e095 AVFilterA!DispatchPassThrough+0×48

aeceda70 808fb13b nt!IofCallDriver+0×45

aecedb58 80939c6a nt!IopParseDevice+0xa35

aecedbd8 80935d9e nt!ObpLookupObjectName+0×5b0

aecedc2c 808ece57 nt!ObOpenObjectByName+0xea

aecedca8 808ee0f1 nt!IopCreateFile+0×447

aecedd04 808f1e31 nt!IoCreateFile+0xa3

aecedd44 8088ad3c nt!NtOpenFile+0×27

[…]
Here, if the thread is blocked, AVFilterB is more suspicious than AVFilterA because it is on top of the stack, waiting and AVFilterA just passed an IRP to driverA. DriverA seems also relayed the IRP to driverB and the latter relayed it to AVFilterB.
Another x64 example shows how these filter functions can be identified. They have “Dispatch” or “PassThrough” in their function names:
Child-SP          RetAddr           Call Site

fffffa60`12610880 fffff800`01875f8a nt!KiSwapContext+0x7f

fffffa60`126109c0 fffff800`0187776a nt!KiSwapThread+0x2fa

fffffa60`12610a30 fffff800`01ab16d6 nt!KeWaitForSingleObject+0x2da

[...]

fffffa60`12610fe0 fffffa60`06c5191a rdbss!RxFsdCommonDispatch+0×786

fffffa60`126110d0 fffffa60`07e4f21f rdbss!RxFsdDispatch+0×21a

fffffa60`12611140 fffffa60`011e05f5 mrxsmb!MRxSmbFsdDispatch+0xbf

fffffa60`12611180 fffffa60`011e0130 mup!MupiCallUncProvider+0×159

fffffa60`126111f0 fffffa60`011e17af mup!MupStateMachine+0×120

fffffa60`12611240 fffffa60`00d200b4 mup!MupCreate+0×2c3

fffffa60`126112c0 fffffa60`06d332d6 fltmgr!FltpCreate+0xa4

fffffa60`12611370 fffffa60`06d786c7 driverB!FS_Dispatch+0×156

fffffa60`126113a0 fffffa60`06d7894d driverA!PassThrough+0×177

fffffa60`12611400 fffffa60`090b3f30 driverA!Create+0×14d

fffffa60`12611430 fffff800`01aef360 AVDriverA!LowerDevicePassThrough+0×5c

fffffa60`12611700 fffff800`01aefa59 nt!IopParseDevice+0×5e3

fffffa60`126118a0 fffff800`01af3944 nt!ObpLookupObjectName+0×5eb

fffffa60`126119b0 fffff800`01affee0 nt!ObOpenObjectByName+0×2f4

fffffa60`12611a80 fffff800`01b00a0c nt!IopCreateFile+0×290

fffffa60`12611b20 fffff800`0186fdf3 nt!NtCreateFile+0×78

[…]
- Dmitry Vostokov @ DumpAnalysis.org -
To paraphrase ”The Importance of Being Earnest“ I have made a Euclidean rigid motion on a plane by coming back from management line back to engineering line: my new title at Citrix Systems is Principal Dev Analysis Engineer. In the past before embarking on a blogger’s and writer’s career I wanted to become a Manager (and eventually became the one after being a Team Lead) and even had plans to enroll into one of business schools to get an MBA but now engineering path seems more natural to me at these times.
- Dmitry Vostokov @ DumpAnalysis.org -


