Pattern-Driven Memory Analysis (Part 1)
CARE: Crash Analysis Report Environment
DATA (Dump Analysis + Trace Analysis) Facebook group
Please join the community of memory (dump) and trace analysis engineers. This group promotes scientific methods and memory dump-based worldview.
Twitter @ DumpAnalysis You can now follow portal and blog news at DumpAnalysis on Twitter
LinkedIn Group Dr. Watson Enthusiasts All about Dr. Watson errors and more. Get news, excerpts and progress reports about the forthcoming book The Science of Dr. Watson: An Illustrated History of Debugging (ISBN 978-1906717070)
2010 (0x7DA) - The Year of Dump Analysis 2011 (0x7DB) - 2020 (0x7E4) The Debugging Decade
Last week I had an opportunity to present a pattern-driven memory dump analysis methodology at a global engineering conference. Now in a series of articles I’m going to clarify certain points and extend it to wider domain of memory analysis including computer memory forensics and intelligence.
Today I post the reworked picture of a waterfall-like analysis process:
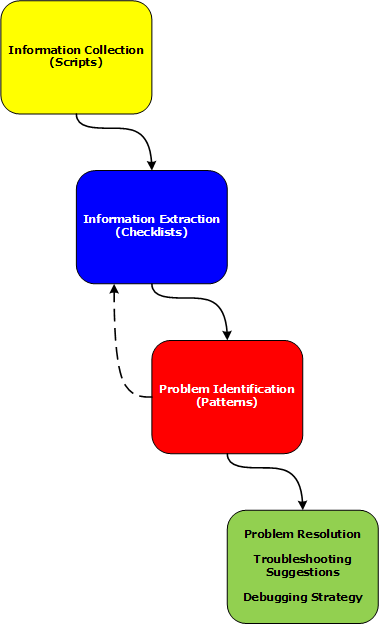
Various phases and their relationship will be discussed in subsequent parts together with examples.
- Dmitry Vostokov @ DumpAnalysis.org -
_1125.png)
Coming Soon:
Debugging Notebook: Essential Concepts, WinDbg Commands and Tools
Crash Dump Analysis for System Administrators and Support Engineers
New Magazines:
Debugged! MZ/PE: MagaZine for/from Practicing Engineers
New Books:
Memory Dump Analysis Anthology, Volume 3
First Fault Software Problem Solving: A Guide for Engineers, Managers and Users
x64 Windows Debugging: Practical Foundations
Also available:
Windows Debugging: Practical Foundations
DLL List Landscape: The Art from Computer Memory Space
Dumps, Bugs and Debugging Forensics: The Adventures of Dr. Debugalov
WinDbg: A Reference Poster and Learning Cards
Memory Dump Analysis Anthology, Volume 2
Memory Dump Analysis Anthology, Volume 1
New Children's Book:
April 21st, 2009 at 3:57 pm
[…] - 2020 (0×7E4) The Debugging DecadeBefore we explain stages of the analysis process shown in Part 1, let’s start with a brief overview of memory dumps, debuggers and logs. Recall that a memory dump […]
May 14th, 2009 at 11:06 am
[…] Therefore we start with the first step in our analysis process diagram introduced in Part 1: […]