Dump2Wave v1.2.1 source code

February 8th, 2008

Since the first release of Dump2Wave I was under pressure to publish its source code and today I released it under GPL. I have to apologize that it doesn’t always use secure string manipulation functions, error handling is copy/pasted several times and there are no comments. I promise better code in the next version. :-)

If you plan to make changes and improvements please let me know so I could enjoy your versions of memory sounds too. I used ancient Visual C++ 6.0 to compile and build the project.

// Dump2Wave version 1.2.1 (c) Dmitry Vostokov
// GNU GENERAL PUBLIC LICENSE
// http://www.gnu.org/licenses/gpl-3.0.txt

#include <iostream>
#include <process.h>
#include <windows.h>

#pragma pack(1)

typedef struct {

 unsigned int   riff;   // 'RIFF'
 unsigned int   length; // dump size + sizeof(WAVEFILEHDR) - 8
 unsigned int   wave;   // 'WAVE' 
 unsigned int   fmt;    // 'fmt '
 unsigned int   fmtlen; // 16  
 unsigned short code;   // 1
 unsigned short channels;  // 2
 unsigned int   sps;    // 44100
 unsigned int   avgbps; // sps*channels*(sbits/8)
 unsigned short alignment; // 4
 unsigned short sbits;  // 16
 unsigned int   data;   // 'data'
 unsigned int   datalen;  

} WAVEFILEHDR;

#pragma pack()

WAVEFILEHDR hdr = {'FFIR', sizeof(WAVEFILEHDR) - 8, 'EVAW',
  ' tmf', 16, 1, 2, 44100, 44100*4, 4, 16, 'atad', 0};

void DisplayError (LPCSTR szPrefix)
{
 LPSTR errMsg;
 CHAR  szMsg[256];
 strncpy(szMsg, szPrefix, 128);
 DWORD gle = GetLastError();
 if (gle && FormatMessage(FORMAT_MESSAGE_ALLOCATE_BUFFER|
  FORMAT_MESSAGE_FROM_SYSTEM, NULL, gle, 0,
  (LPSTR)&errMsg, 0, NULL))
 {
  strcat(szMsg, ": ");
  strncat(szMsg, errMsg, 120);
 }  
 std::cout << szMsg << std::endl; 
 LocalFree(errMsg);
}

int main(int argc, char* argv[])
{
 std::cout << std::endl << "Dump2Wave version 1.2.1" <<
    std::endl << "Written by Dmitry Vostokov, 2006" <<
    std::endl << std::endl;
 if (argc < 3)
 {
  std::cout << "Usage: Dump2Wave dumpfile wavefile [44100|22050|11025|8000 16|8 2|1]" << std::endl;
  return -1;
 }

 HANDLE hFile = CreateFile(argv[1],
  GENERIC_READ, FILE_SHARE_READ, NULL,
  OPEN_EXISTING, FILE_ATTRIBUTE_NORMAL, NULL);
 if (hFile == INVALID_HANDLE_VALUE)
 {
  DisplayError("Cannot read dump file"); 
  return -1;
 }

 DWORD dwDumpSizeHigh = 0;
 DWORD dwDumpSizeLow = GetFileSize(hFile, &dwDumpSizeHigh);
 CloseHandle(hFile);

 if (dwDumpSizeHigh)
 {
  std::cout << "The dump file must be less than 4Gb" <<
  std::endl;
  return -1;
 }

 if (argc == 6)
 {
  hdr.channels = atoi(argv[5]);
  hdr.sps = atoi(argv[3]);
  hdr.sbits = atoi(argv[4]);
  hdr.avgbps = hdr.sps*hdr.channels*(hdr.sbits/8);
  hdr.alignment = hdr.channels*(hdr.sbits/8);
 }

 dwDumpSizeLow = (dwDumpSizeLow/hdr.alignment)*(hdr.alignment);

 hdr.length += dwDumpSizeLow;
 hdr.datalen = dwDumpSizeLow;

 hFile = CreateFile(argv[2], GENERIC_WRITE, 0, 
  NULL, CREATE_ALWAYS, FILE_ATTRIBUTE_NORMAL, NULL);
 if (hFile == INVALID_HANDLE_VALUE)
 {
  DisplayError("Cannot create wave header file"); 
  return -1;
 }

 DWORD dwWritten;
 if (!WriteFile(hFile, &hdr, sizeof(hdr), &dwWritten, NULL))
 {
  DisplayError("Cannot write wave header file"); 
  CloseHandle(hFile);
  return -1;
 }

 
 CloseHandle(hFile);

 std::string str = "copy \"";
 str += argv[2];
 str += "\" /B + \"";
 str += argv[1];
 str += "\" /B \"";
 str += argv[2];
 str += "\" /B";

 system(str.c_str());
 
 return 0;
}

- Dmitry Vostokov @ DumpAnalysis.org -

WinDbg

February 8th, 2008

Google shows different cheat sheets for WinDbg and I want to remind about my own version that is geared towards postmortem dump analysis of native code:

Memory Dump Analysis Checklist

This post was motivated by WinDbg blog post written by Volker von Einem :-)

- Dmitry Vostokov @ DumpAnalysis.org -

Memory Dump Analysis Anthology, Volume 1

February 7th, 2008

It is very easy to become a publisher nowadays. Much easier than I thought. I registered myself as a publisher under the name of OpenTask which is my registered business name in Ireland. I also got the list of ISBN numbers and therefore can announce product details for the first volume of Memory Dump Analysis Anthology series:

Memory Dump Analysis Anthology, Volume 1

  • Paperback: 720 pages (*)
  • ISBN-13: 978-0-9558328-0-2
  • Hardcover: 720 pages (*)
  • ISBN-13: 978-0-9558328-1-9
  • Author: Dmitry Vostokov
  • Publisher: Opentask (15 Apr 2008)
  • Language: English
  • Product Dimensions: 22.86 x 15.24

(*) subject to change 

PDF file will be available for download too.

- Dmitry Vostokov @ DumpAnalysis.org -

Crash Dump Analysis Patterns (Part 47)

February 6th, 2008

Most of the time threads are not suspended explicitly. If you look at active and waiting threads in kernel and complete memory dumps their SuspendCount member is 0:

THREAD 88951bc8  Cid 03a4.0d24  Teb: 7ffaa000 Win32Thread: 00000000 WAIT: (Unknown) UserMode Non-Alertable
    889d6a78  Semaphore Limit 0x7fffffff
    88951c40  NotificationTimer
Not impersonating
DeviceMap                 e1b80b98
Owning Process            888a9d88       Image:         svchost.exe
Wait Start TickCount      12669          Ticks: 5442 (0:00:01:25.031)
Context Switch Count      3            
UserTime                  00:00:00.000
KernelTime                00:00:00.000
Win32 Start Address RPCRT4!ThreadStartRoutine (0x77c4b0f5)
Start Address kernel32!BaseThreadStartThunk (0x7c8217ec)
Stack Init f482f000 Current f482ec0c Base f482f000 Limit f482c000 Call 0
Priority 10 BasePriority 10 PriorityDecrement 0
ChildEBP RetAddr 
f482ec24 80833465 nt!KiSwapContext+0x26
f482ec50 80829a62 nt!KiSwapThread+0x2e5
f482ec98 809226bd nt!KeWaitForSingleObject+0x346
f482ed48 8088978c nt!NtReplyWaitReceivePortEx+0x521
f482ed48 7c9485ec nt!KiFastCallEntry+0xfc (TrapFrame @ f482ed64)
00efff84 77c58792 ntdll!KiFastSystemCallRet
00efff8c 77c5872d RPCRT4!RecvLotsaCallsWrapper+0xd
00efffac 77c4b110 RPCRT4!BaseCachedThreadRoutine+0x9d
00efffb8 7c824829 RPCRT4!ThreadStartRoutine+0x1b
00efffec 00000000 kernel32!BaseThreadStart+0x34

5: kd> dt _KTHREAD 88951bc8
ntdll!_KTHREAD
   +0x000 Header           : _DISPATCHER_HEADER
   +0x010 MutantListHead   : _LIST_ENTRY [ 0x88951bd8 - 0x88951bd8 ]
   +0x018 InitialStack     : 0xf482f000
   +0x01c StackLimit       : 0xf482c000
   +0x020 KernelStack      : 0xf482ec0c
   +0x024 ThreadLock       : 0
   +0x028 ApcState         : _KAPC_STATE
...
...
...
   +0x14f FreezeCount      : 0 ''
   +0×150 SuspendCount     : 0 ”


You won’t find SuspendCount in reference stack traces. Only when some other thread explicitly suspends another thread the latter has non-zero suspend count. Suspended threads are excluded from thread scheduling and therefore can be considered as blocked. This might be the sign of a debugger present, for example, all threads in a process are suspended when a user debugger is processing a debugger event like a breakpoint or access violation exception. In this case !process 0 ff command output shows SuspendCount value:

THREAD 888b8668  Cid 0ca8.1448  Teb: 00000000 Win32Thread: 00000000 WAIT: (Unknown) KernelMode Non-Alertable
SuspendCount 2
    888b87f8  Semaphore Limit 0×2
Not impersonating
DeviceMap                 e10028e8
Owning Process            898285b0       Image:         processA.exe
Wait Start TickCount      13456          Ticks: 4655 (0:00:01:12.734)
Context Switch Count      408            
UserTime                  00:00:00.000
KernelTime                00:00:00.000
Start Address driver!DriverThread (0xf6fb8218)
Stack Init f455b000 Current f455a3ac Base f455b000 Limit f4558000 Call 0
Priority 6 BasePriority 6 PriorityDecrement 0
ChildEBP RetAddr 
f455a3c4 80833465 nt!KiSwapContext+0×26
f455a3f0 80829a62 nt!KiSwapThread+0×2e5
f455a438 80833178 nt!KeWaitForSingleObject+0×346
f455a450 8082e01f nt!KiSuspendThread+0×18
f455a498 80833480 nt!KiDeliverApc+0×117
f455a4d0 80829a62 nt!KiSwapThread+0×300
f455a518 f6fb7f13 nt!KeWaitForSingleObject+0×346
f455a548 f4edd457 driver!WaitForSingleObject+0×75
f455a55c f4edcdd8 driver!DeviceWaitForRead+0×19
f455ad90 f6fb8265 driver!InputThread+0×17e
f455adac 80949b7c driver!DriverThread+0×4d
f455addc 8088e062 nt!PspSystemThreadStartup+0×2e
00000000 00000000 nt!KiThreadStartup+0×16

5: kd> dt _KTHREAD 888b8668
ntdll!_KTHREAD
   +0x000 Header           : _DISPATCHER_HEADER
   +0x010 MutantListHead   : _LIST_ENTRY [ 0x888b8678 - 0x888b8678 ]
   +0x018 InitialStack     : 0xf455b000
   +0x01c StackLimit       : 0xf4558000
   +0x020 KernelStack      : 0xf455a3ac
   +0x024 ThreadLock       : 0
...
...
...
   +0x14f FreezeCount      : 0 ''
   +0×150 SuspendCount     : 2 ”


I call this pattern Suspended Thread. It should rise suspicion bar and in some cases coupled with Special Process pattern can lead to immediate problem identification.

- Dmitry Vostokov @ DumpAnalysis.org -

Dump2Picture v1.1 source code

February 5th, 2008

Since the first release of Dump2Picture I was under pressure to publish its source code and today I released it under GPL. I have to apologize that it doesn’t always use secure string manipulation functions, error handling is copy/pasted several times and there are no comments. I promise better code in the next version. :-)

If you plan to make changes and improvements please let me know so I could enjoy your versions of memory visuals too. I used ancient Visual C++ 6.0 to compile and build the project.

// Dump2Picture version 1.1 (c) Dmitry Vostokov
// GNU GENERAL PUBLIC LICENSE
// http://www.gnu.org/licenses/gpl-3.0.txt

#include <math.h>
#include <iostream>
#include <process.h>
#include <windows.h>

BITMAPFILEHEADER bmfh = { 'MB', 0, 0, 0,
   sizeof(BITMAPFILEHEADER) + sizeof(BITMAPINFOHEADER) };
BITMAPINFOHEADER bmih = { sizeof(BITMAPINFOHEADER), 0, 0, 1, 32,
   0, 0, 0, 0, 0, 0 };
RGBQUAD rgb[256];

void DisplayError (LPCSTR szPrefix)
{
 LPSTR errMsg;
 CHAR  szMsg[256];
 strncpy(szMsg, szPrefix, 128);
 DWORD gle = GetLastError();
 if (gle && FormatMessage(
    FORMAT_MESSAGE_ALLOCATE_BUFFER|FORMAT_MESSAGE_FROM_SYSTEM,
    NULL, gle, 0, (LPSTR)&errMsg, 0, NULL))
 {
  strcat(szMsg, ": ");
  strncat(szMsg, errMsg, 120);
 }  
 std::cout << szMsg << std::endl;
 LocalFree(errMsg);
}

int main(int argc, char* argv[])
{
 std::cout << std::endl << "Dump2Picture version 1.1"
    << std::endl << "Written by Dmitry Vostokov, 2007"
    << std::endl << std::endl;
 if (argc < 3)
 {
  std::cout << "Usage: Dump2Picture dumpfile bmpfile [8|16|24|32]" << std::endl;
  return -1;
 }

 HANDLE hFile = CreateFile(argv[1], GENERIC_READ,
    FILE_SHARE_READ, NULL, OPEN_EXISTING,
    FILE_ATTRIBUTE_NORMAL, NULL);
 if (hFile == INVALID_HANDLE_VALUE)
 {
  DisplayError("Cannot read dump file"); 
  return -1;
 }

 DWORD dwDumpSizeHigh = 0;
 DWORD dwDumpSizeLow = GetFileSize(hFile, &dwDumpSizeHigh);
 CloseHandle(hFile);

 if (dwDumpSizeHigh)
 {
  std::cout << "The dump file must be less than 4Gb"
     << std::endl;
  return -1;
 }

 if (argc == 4)
 {
  if (!strcmp(argv[argc-1],"8"))
  {
   bmih.biBitCount = 8;
   for (int i = 0; i < 256; ++i)
   {
    rgb[i].rgbBlue = rgb[i].rgbGreen = rgb[i].rgbRed = i;
    rgb[i].rgbReserved = 0;
   }
  }
  else if (!strcmp(argv[argc-1],"16"))
  {
   bmih.biBitCount = 16;
  }
  else if (!strcmp(argv[argc-1],"24"))
  {
   bmih.biBitCount = 24;
  }
  else
  {
   bmih.biBitCount = 32;
  }
 }

 bmih.biWidth = bmih.biHeight = sqrt((double)(dwDumpSizeLow/
    (bmih.biBitCount/8)));
 bmih.biWidth -= bmih.biWidth%2;
 if (bmih.biBitCount == 8 )
 {
  bmih.biWidth -= bmih.biWidth%8;
 }
 bmih.biHeight -= bmih.biHeight%2;
 bmih.biSizeImage = bmih.biWidth*bmih.biHeight*
    (bmih.biBitCount/8);
 if (bmih.biBitCount == 8 )
 {
  bmfh.bfOffBits += sizeof(rgb);
 }
 bmfh.bfSize = bmfh.bfOffBits + bmih.biSizeImage;

 hFile = CreateFile(argv[2], GENERIC_WRITE, 0, NULL,
    CREATE_ALWAYS, FILE_ATTRIBUTE_NORMAL, NULL);
 if (hFile == INVALID_HANDLE_VALUE)
 {
  DisplayError("Cannot create bitmap header file"); 
  return -1;
 }

 DWORD dwWritten;
 if (!WriteFile(hFile, &bmfh, sizeof(bmfh), &dwWritten, NULL))
 {
  DisplayError("Cannot write bitmap header file"); 
  CloseHandle(hFile);
  return -1;
 }

 if (!WriteFile(hFile, &bmih, sizeof(bmih), &dwWritten, NULL))
 {
  DisplayError("Cannot write bitmap header file"); 
  CloseHandle(hFile);
  return -1;
 }

 if (bmih.biBitCount == 8 )
 {
  if (!WriteFile(hFile, &rgb, sizeof(rgb), &dwWritten, NULL))
  {
   DisplayError("Cannot write bitmap header file"); 
   CloseHandle(hFile);
   return -1;
  }
 }
 
 CloseHandle(hFile);

 std::string str = "copy \"";
 str += argv[2];
 str += "\" /B + \"";
 str += argv[1];
 str += "\" /B \"";
 str += argv[2];
 str += "\" /B";

 system(str.c_str());
 
 return 0;
}

- Dmitry Vostokov @ DumpAnalysis.org -
Memoretics

February 4th, 2008

I’ve been trying to put memory dump analysis on relevant scientific grounds for some time and now this branch of science needs its own name. After considering different alternative names I finally chose the word Memoretics. Here is the brief definition:

Computer Memoretics studies computer memory snapshots and their evolution in time.

Obviously this domain of research has many links with application and system debugging. However its scope is wider than debugging because it doesn’t necessarily study memory snapshots from systems and applications experiencing faulty behaviour.

Initially I was thinking about Memogenics word but its suffix is heavily associated with genes metaphor which I’m currently trying to avoid although I personally re-discovered software genes approach to software disorders when thinking about Memoretics vs. Memogenics. Later I found some research efforts going on but seems they are based on constructing software genes artificially. On the contrary I would try to discover genes in computer memories first.

genic

Also Memoretics has longer prefix almost resembling Memory word. This had the final influence on my decision.

PS. I was also thinking about Memorology word but it has negative connotations with Astrology or Numerology and was coined already by someone like Memology and Memorics

- Dmitry Vostokov @ DumpAnalysis.org -
Crash Dump Analysis Patterns (Part 13d)

February 4th, 2008

In order to maintain virtual to physical address translation OS needs page tables. These tables occupy memory too. If there is not enough memory for new tables the system will fail to create processes, allocate I/O buffers and memory from pools. You might see the following diagnostic message from WinDbg:

4: kd> !vm

*** Virtual Memory Usage ***
 Physical Memory:      851422 (   3405688 Kb)
 Page File: \??\C:\pagefile.sys
   Current:   2095104 Kb  Free Space:   2081452 Kb
   Minimum:   2095104 Kb  Maximum:      4190208 Kb
 Available Pages:      683464 (   2733856 Kb)
 ResAvail Pages:       800927 (   3203708 Kb)
 Locked IO Pages:         145 (       580 Kb)
 Free System PTEs:      23980 (     95920 Kb)

 ******* 356363 system PTE allocations have failed ******

 Free NP PTEs:           6238 (     24952 Kb)
 Free Special NP:           0 (         0 Kb)
 Modified Pages:          482 (      1928 Kb)
 Modified PF Pages:       482 (      1928 Kb)
 NonPagedPool Usage:    18509 (     74036 Kb)
 NonPagedPool Max:      31970 (    127880 Kb)
 PagedPool 0 Usage:      8091 (     32364 Kb)
 PagedPool 1 Usage:      2495 (      9980 Kb)
 PagedPool 2 Usage:      2580 (     10320 Kb)
 PagedPool 3 Usage:      2552 (     10208 Kb)
 PagedPool 4 Usage:      2584 (     10336 Kb)
 PagedPool Usage:       18302 (     73208 Kb)
 PagedPool Maximum:     39936 (    159744 Kb)

 ********** 48530 pool allocations have failed **********

 Shared Commit:          5422 (     21688 Kb)
 Special Pool:              0 (         0 Kb)
 Shared Process:         5762 (     23048 Kb)
 PagedPool Commit:      18365 (     73460 Kb)
 Driver Commit:          2347 (      9388 Kb)
 Committed pages:      129014 (    516056 Kb)
 Commit limit:        1342979 (   5371916 Kb)

We also see another diagnostic message about pool allocation failures which could be the consequence of PTE allocation failures.

The cause of system PTE allocation failures might be incorrect value of SystemPages registry key that needs to be adjusted as explained in the following TechNet article:

The number of free page table entries is low, which can cause system instability

Another cause would be /3GB boot option on x86 systems especially used for hosting terminal sessions. This case is explained in Brad Rutkowski’s blog post which also shows how to detect /3GB kernel and complete memory dumps:

Consequences of running 3GB and PAE together  

In our case the system was booted with /3GB:

4: kd> vertarget
Windows Server 2003 Kernel Version 3790 (Service Pack 2) MP (8 procs) Free x86 compatible
Product: Server, suite: Enterprise TerminalServer
Built by: 3790.srv03_sp2_gdr.070304-2240
Kernel base = 0xe0800000 PsLoadedModuleList = 0xe08af9c8
Debug session time: Fri Feb  1 09:10:17.703 2008 (GMT+0)
System Uptime: 6 days 17:14:45.528

Normal Windows 2003 systems have different kernel base address which can be checked from Reference Stack Traces for Windows Server 2003 (Virtual Memory section): 

kd> vertarget
Windows Server 2003 Kernel Version 3790 (Service Pack 2) UP Free x86 compatible
Product: Server, suite: Enterprise TerminalServer SingleUserTS
Built by: 3790.srv03_sp2_rtm.070216-1710
Kernel base = 0×80800000 PsLoadedModuleList = 0×8089ffa8
Debug session time: Wed Jan 30 17:54:13.390 2008 (GMT+0)
System Uptime: 0 days 0:30:12.000

- Dmitry Vostokov @ DumpAnalysis.org -
Optometrics and Crashes

February 4th, 2008

What’s the relation? During my eye test today an optometrist complained that he has to re-enter data because his program crashed. Later on I looked at the screen and saw familiar Borland style GUI. I resisted temptation to offer on the spot crash dump analysis assistance. Now I regret that - perhaps he might have offered better discount for me :-)

- Dmitry Vostokov @ DumpAnalysis.org -

2007 in Retrospection (Part 3)

February 1st, 2008

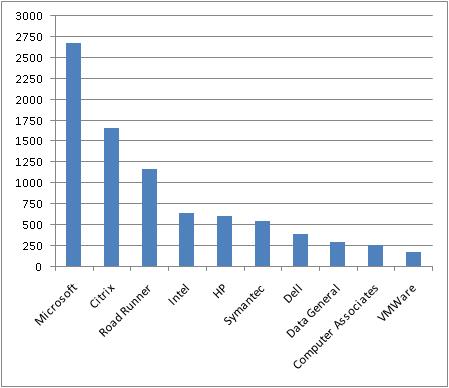
Out of more than 13,000 organizations including more than 450 universities and colleges I selected top 10 visited my blog. Here is the graph showing the number of visits vs. company name:

- Dmitry Vostokov @ DumpAnalysis.org -

LiterateScientist update (January, 2008)

February 1st, 2008

As promised here is the first monthly summary of my Literate Scientist blog:

- Dmitry Vostokov @ DumpAnalysis.org -

ManagementBits update (January, 2008)

February 1st, 2008

Next monthly summary of my Management Bits and Tips blog:

- Dmitry Vostokov @ DumpAnalysis.org -

Reference Stack Traces (Volume 3)

January 31st, 2008

Now the third volume is ready. Here is PDF file for free download:

Windows Server 2003™ x86 Complete Memory Dump

Surprisingly it is almost twice less in the number of pages than the first volume for Vista x86.  

Printed versions are available for purchase at the nominal price to cover manufacturing costs:

The second edition will contain annotations and comments.

Large print (paperback)

Buy

Small print (paperback)

Buy

Small print (hardcover)

Buy

- Dmitry Vostokov @ DumpAnalysis.org -

Crash Dump Analysis Patterns (Part 46)

January 31st, 2008

Similar to No Process Dumps pattern there is corresponding No System Dumps pattern where the system bluescreens either on demand or because of a bug check condition but no kernel or complete dumps are saved. In such cases I would advise to check free space on a drive where memory dumps are supposed to be saved. This is because crash dumps are saved to a page file first and then copied to a separate file during boot time, by default to memory.dmp file. Please see related Microsoft links in my old post. In case you have enough free space but not enough page file space you might get an instance of Truncated Dump or Corrupt Dump pattern.   

Yesterday I experienced No System Dump pattern on Windows Server 2003 SP2 running on VMWare workstation when I was trying to get a complete memory dump using SystemDump. I set up page file correctly as sizeof(PhysicalMemory) + 100Mb but I didn’t check free space on drive C: and no dump was saved, not even kernel minidump. System event log entry was blank too. 

- Dmitry Vostokov @ DumpAnalysis.org -

Domain-Driven Debugging and Troubleshooting

January 31st, 2008

SDT (Structured Debugging and Troubleshooting) is procedural (action-based). Once we get the description of the problem we jump to actions:

  1. Ask this
  2. Ask that
  3. Do this
  4. Do that

Whereas OODT is centered around objects (systems and customers are also objects):

  1. Get objects from the problem description and problem environment

  2. Interrogate them sending messages (could be an email at high levels :-)) like changing a registry key is a message to configuration management subsystem

OODT depends on troubleshooting domain and therefore finally we finally come to DDDT.

- Dmitry Vostokov @ DumpAnalysis.org -

Component-Based Debugging and Troubleshooting

January 31st, 2008

Component identification is one of the main goals of post-mortem memory dump analysis and troubleshooting process in general. Using the definition of components as units of deployment and 3rd-party composition taken from Clemens Szyperski’s seminal book discussing component software in general and COM, CORBA, Java and .NET in particular (highly recommended book)

Component Software: Beyond Object-Oriented Programming (2nd Edition)

Buy from Amazon

I would say that CBDT is centered around component isolation and replacement.

- Dmitry Vostokov @ DumpAnalysis.org -

Object-Oriented Debugging and Troubleshooting

January 31st, 2008

OODT pronounced ”Oddity” is not a paradigm shift for support and software maintenance environments but a recognized way to solve problems using object-oriented techniques. In contrast to Structured Debugging and Troubleshooting methods (SDT) where engineers have sequence of questions and structure troubleshooting plans around them OODT is based on targeting specific objects, subsystems and systems (sending “messages” to them) and evaluating response and changes in their behaviour. I have to say more about it later after introducing CBDT (no easy pronunciation for it but any suggestions are welcome :-)).

Note: OODT doesn’t mean troubleshooting OO systems - it means applying OO techniques to troubleshooting

- Dmitry Vostokov @ DumpAnalysis.org -

Crash Dump Analysis Patterns (Part 45)

January 30th, 2008

The absence of crash dumps when we expect them can be considered as a pattern on its own and I call it No Process Dumps. This can happen due to variety of reasons and troubleshooting should be based on the distinction between crashes and hangs. We have 3 combinations here:

  1. A process is visible in Task Manager and is functioning normally

  2. A process is visible in Task Manager and has stopped functioning normally

  3. A process is not visible in Task Manager

If a process is visible in task list and is functioning normally then the following reasons should be considered:

  • - Exceptions haven’t happened yet due to different code execution paths or the time has not come yet and we need to wait more

  • - Exceptions haven’t happened yet due to a different memory layout. This can be the instance of Changed Environment pattern.

If a process is visible in Task Manager and has stopped functioning normally then it might be hanging and waiting for some input. In such cases it is better to get  process dumps proactively

If a process is not visible in Task Manager then the following reasons should be considered:

  • - Debugger value for AeDebug key is invalid, missing or points to a wrong path or a command line has wrong arguments. For examples see Custom Postmortem Debuggers on Vista or NTSD on x64 Windows 2003.

  • - Something is wrong with exception handling mechanism or WER settings. Use Process Monitor to see what processes are launched and modules are loaded when an exception happens. Check WER settings in Control panel.

  • - Try LocalDumps registry key for Vista SP1 and Windows Server 2008 (this one I haven’t tried yet)

  • - Use live debugging techniques like attaching to a process or running a process under a debugger to monitor exceptions and saving first chance exception crash dumps.

This is very important pattern for technical support environments that rely on post-mortem analysis and I’m going to revisit it later to add more information and recommendations if necessary. 

- Dmitry Vostokov @ DumpAnalysis.org -

10,000 Visit Mark

January 30th, 2008

The traffic was slightly down in December due to Christmas and New Year Eve holidays but this month it has already got 10,000 visits for the first time. I continue analyzing the data for 2007 and soon will publish more stats, for example, the distribution of visitors among major software vendors.

- Dmitry Vostokov @ DumpAnalysis.org -

Reference Stack Traces (Volume 2)

January 29th, 2008

Based on success with Reference Stack Traces for 32-bit Vista I created the similar reference volume for Vista x64. Here is PDF file for free download:

Windows Vista™ x64 Complete Memory Dump

Printed version is available for purchase at the nominal price to cover manufacturing costs:

Large print (paperback)

The second edition will contain annotations and comments.

More volumes to come for other OS versions. I created the separate page to list all current and forthcoming volumes:

Reference Stack Traces

- Dmitry Vostokov @ DumpAnalysis.org -

Reference Stack Traces (Volume 1)

January 28th, 2008

We need to know normal thread stacks when looking at Stack Trace Collection from kernel and complete memory dumps and trying to spot anomalies. In order to fill this gap I just published the reference stack traces and other information form my Vista x86 running on Mac Mini with Apple Boot Camp. Some additional processes like explorer.exe and iexplore.exe were launched in order to include their user space stack traces commonly found in crash dumps. Here is PDF file for free download:

Windows Vista™ x86 Complete Memory Dump

The second edition will contain more information and comments. Soon I’m planning to release additional volumes for Vista x64 and other OS versions.

Printed version is available for purchase at the nominal price to cover manufacturing costs:

Large print (paperback)

This is actually my first complete book :-)

- Dmitry Vostokov @ DumpAnalysis.org -