Custom postmortem debuggers on Vista
Motivated by the previous post I decided to try better alternatives because on new Vista installation you don’t have either drwtsn32.exe or NTSD.
Any application that can attach to a process based on its PID and save its memory state in a dump will do. The first obvious candidate is userdump.exe which actually can setup itself in the registry properly. Here is the detailed instruction. If you already have the latest version of userdump.exe you can skip the first two steps:
1. Download the latest User Mode Process Dumper from Microsoft. At the time of this writing it has version 8.1
2. Run the downloaded executable file and it will prompt to unzip. By default the current version unzips to c:\kktools\userdump8.1. Do not run setup afterwards because it is not needed for our purposes.
3. Create kktools folder in system32 folder
4. Create the folder where userdump will save your dumps; I use c:\UserDumps in my example
5. Copy dbghelp.dll and userdump.exe from x86 or x64 folder depending on the version of Windows you use to system32\kktools folder you created in step 3.
6. Run the elevated command prompt and enter the following command:
C:\Windows\System32\kktools>userdump -I -d c:\UserDumps

User Mode Process Dumper (Version 8.1.2929.5)

Copyright (c) Microsoft Corp. All rights reserved.

Userdump set up Aedebug registry key.
7. Check the following registry key:
HKEY_LOCAL_MACHINE\SOFTWARE\Microsoft\Windows NT\CurrentVersion\AeDebug

Debugger=C:\Windows\system32\kktools\userdump -E %ld %ld -D c:\UserDumps\

Auto=0
You can set Auto to 1 if you want to see the following dialog every time you have a crash:
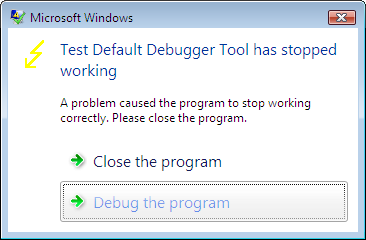
8. Test the new settings by using TestDefaultDebugger
9. When you have a crash userdump.exe will show a window on top of your screen while saving the dump file:
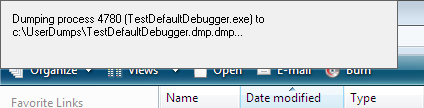
Of course, you can setup userdump.exe as the postmortem debugger on other Windows platforms. The problem with userdump.exe is that it overwrites the previous process dump because it uses the module name for the dump file name, for example, TestDefaultDebugger.dmp, so you need to rename or save the dump if you have multiple crashes for the same application.
Other programs can be setup instead of userdump.exe. One of them is WinDbg. Here is the article I wrote about WinDbg so I won’t repeat its content here, except the registry key I tested on Vista:
HKEY_LOCAL_MACHINE\SOFTWARE\Microsoft\Windows NT\CurrentVersion\AeDebug

Debugger="C:\Program Files\Debugging Tools for Windows\windbg.exe" -p %ld -e %ld -g -c '.dump /o /ma /u c:\UserDumps\new.dmp; q' -Q -QS -QY -QSY
Finally you can use command line CDB user mode debugger from Debugging Tools for Windows. Here is the registry key:
HKEY_LOCAL_MACHINE\SOFTWARE\Microsoft\Windows NT\CurrentVersion\AeDebug

Debugger="C:\Program Files\Debugging Tools for Windows\cdb.exe" -p %ld -e %ld -g -c ".dump /o /ma /u c:\UserDumps\new.dmp; q"
When you have a crash cdb.exe will be launched and the following console window will appear:
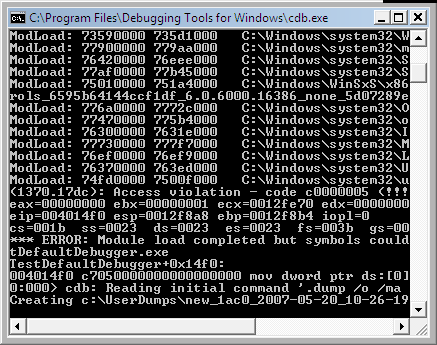
The advantage of using CDB or WinDbg is that you can omit q from the -c command line option and leave your debugger window open for further process inspection.
- Dmitry Vostokov -
July 9th, 2007 at 12:06 am
NTSD will be available on Vista after installing Debugging Tools for Windows
August 15th, 2008 at 1:25 am
[…] Here WinDbg scripts come to the rescue. Suppose that CDB is set as a postmortem debugger (see Custom postmortem debuggers on Vista) and AeDebug registry key is set […]
December 29th, 2008 at 4:29 pm
[…] can be used as a postmortem debugger specified in AeDebug registry key, for example, instead of CDB. Any argument specified to Crash2Hang.exe causes it to display a message box when […]
February 4th, 2010 at 11:56 pm
[…] Also drwtsn32.exe was set as a default postmortem debugger (but we could also use CDB, WinDbg or any other process dumper as shown in Vista example). […]
June 30th, 2010 at 1:50 am
I love the description of the Baby Turing book: This book fills the gap in children’s literature and introduces binary arithmetic to babies.
I’m not entirely sure my 6-month-old baby boy is up for this, but I will give it a shot!
February 19th, 2012 at 12:54 am
You may also want remove -g option to have better results when -g option produces dumps with only one process termination thread. Also removing -g option is equivalent to having userdump.exe as a postmortem debugger: http://www.dumpanalysis.org/blog/index.php/2007/05/20/custom-postmortem-debuggers-on-vista/