Signaled Objects
March 6th, 2008I decided to elaborate a bit on how to see whether the specific synchronization object has signaled or not. If that object has signaled (is in signaled state) then any wait on it will be satisfied immediately. All such objects like kernel events, processes and threads are structures in memory and have _OBJECT_HEADER structure followed by _DISPATCHER_HEADER structure and then by the actual object body (if it is necessary). These objects can be found in the output of !process or !thread commands where they are listed as being waited for, for example:
THREAD 88865db0  Cid 05d0.5ea8  Teb: 7ffaa000 Win32Thread: 00000000 WAIT: (Unknown) UserMode Non-Alertable

    89a65a68  SynchronizationEvent

Not impersonating

DeviceMap                 e1536358

Owning Process            8abbdd88       Image:         svchost.exe

Wait Start TickCount      5303768        Ticks: 1132797 (0:04:54:59.953)

Context Switch Count      193

UserTime                  00:00:00.015

KernelTime                00:00:00.000

Start Address kernel32!BaseThreadStartThunk (0×7c82b5f3)

Stack Init b8ca2000 Current b8ca1c60 Base b8ca2000 Limit b8c9f000 Call 0

Priority 10 BasePriority 8 PriorityDecrement 0

Kernel stack not resident.

ChildEBP RetAddr

b8ca1c78 80832f7a nt!KiSwapContext+0×26

b8ca1ca4 8082925c nt!KiSwapThread+0×284

b8ca1cec 80937e6a nt!KeWaitForSingleObject+0×346

b8ca1d50 80888c7c nt!NtWaitForSingleObject+0×9a

b8ca1d50 7c94ed54 nt!KiFastCallEntry+0xfc

00c6fea0 7c942124 ntdll!KiFastSystemCallRet

00c6fea4 7c95970f ntdll!NtWaitForSingleObject+0xc

00c6fee0 7c959620 ntdll!RtlpWaitOnCriticalSection+0×19c

00c6ff00 7c95c1e7 ntdll!RtlEnterCriticalSection+0xa8

00c6ffa8 7c8261d6 ntdll!LdrShutdownThread+0×33

00c6ffb8 7c826090 kernel32!ExitThread+0×2f

00c6ffec 00000000 kernel32!BaseThreadStart+0×39
We can see them as parameters of KeWaitForSingle(Multiple)Objects functions:
0: kd> !thread 88865db0

THREAD 88865db0  Cid 05d0.5ea8  Teb: 7ffaa000 Win32Thread: 00000000 WAIT: (Unknown) UserMode Non-Alertable

    89a65a68  SynchronizationEvent

Not impersonating

DeviceMap                 e1536358

Owning Process            8abbdd88       Image:         svchost.exe

Wait Start TickCount      5303768        Ticks: 1132797 (0:04:54:59.953)

Context Switch Count      193

UserTime                  00:00:00.015

KernelTime                00:00:00.000

Start Address kernel32!BaseThreadStartThunk (0×7c82b5f3)

Stack Init b8ca2000 Current b8ca1c60 Base b8ca2000 Limit b8c9f000 Call 0

Priority 10 BasePriority 8 PriorityDecrement 0

Kernel stack not resident.

ChildEBP RetAddr  Args to Child

b8ca1c78 80832f7a 88865e28 88865db0 88865e58 nt!KiSwapContext+0×26

b8ca1ca4 8082925c 00000000 00000000 00000000 nt!KiSwapThread+0×284

b8ca1cec 80937e6a 89a65a68 00000006 00000001 nt!KeWaitForSingleObject+0×346

b8ca1d50 80888c7c 00000470 00000000 00000000 nt!NtWaitForSingleObject+0×9a

b8ca1d50 7c94ed54 00000470 00000000 00000000 nt!KiFastCallEntry+0xfc

00c6fea0 7c942124 7c95970f 00000470 00000000 ntdll!KiFastSystemCallRet

00c6fea4 7c95970f 00000470 00000000 00000000 ntdll!NtWaitForSingleObject+0xc

00c6fee0 7c959620 00000000 00000004 009171a8 ntdll!RtlpWaitOnCriticalSection+0×19c

00c6ff00 7c95c1e7 7c9a9d94 00000000 7ffaa000 ntdll!RtlEnterCriticalSection+0xa8

00c6ffa8 7c8261d6 00000000 00000000 00c6ffec ntdll!LdrShutdownThread+0×33

00c6ffb8 7c826090 00000000 00000000 00000000 kernel32!ExitThread+0×2f

00c6ffec 00000000 77c2de6d 009171a8 00000000 kernel32!BaseThreadStart+0×39
We can also see them as part of other structures, for example:
0: kd> !irp 88f4fd28 1

Irp is active with 1 stacks 1 is current (= 0x88f4fd98)

 No Mdl: No System Buffer: Thread 8a9449a0:  Irp stack trace.

Flags = 00000800

ThreadListEntry.Flink = 8a944ba8

ThreadListEntry.Blink = 8a944ba8

IoStatus.Status = 00000000

IoStatus.Information = 00000000

RequestorMode = 00000001

Cancel = 00

CancelIrql = 0

ApcEnvironment = 00

UserIosb = 00dddf04

UserEvent = 8a033c88

Overlay.AsynchronousParameters.UserApcRoutine = 00000000

Overlay.AsynchronousParameters.UserApcContext = 00dddf04

Overlay.AllocationSize = 00000000 - 00000000

CancelRoutine = f75c815c   Npfs!NpCancelListeningQueueIrp

UserBuffer = 00000000

&Tail.Overlay.DeviceQueueEntry = 88f4fd68

Tail.Overlay.Thread = 8a9449a0

Tail.Overlay.AuxiliaryBuffer = 00000000

Tail.Overlay.ListEntry.Flink = e311f7d4

Tail.Overlay.ListEntry.Blink = e311f7d4

Tail.Overlay.CurrentStackLocation = 88f4fd98

Tail.Overlay.OriginalFileObject = 884bc8a0

Tail.Apc = 00000000

Tail.CompletionKey = 00000000

     cmd  flg cl Device   File     Completion-Context

>[  d, 0]   5  1 8a937398 884bc8a0 00000000-00000000    pending

        \FileSystem\Npfs

   Args: 00000000 00000000 00110008 00000000
0: kd> !object 8a033c88

Object: 8a033c88  Type: (8ad7a990) Event

    ObjectHeader: 8a033c70 (old version)

    HandleCount: 1  PointerCount: 3
They can also be found in process or kernel (System process) handle tables:
0: kd> !process 0 0

...

...

...

PROCESS 8a8fa8c0  SessionId: 0  Cid: 037c    Peb: 7ffd8000  ParentCid: 04ac

    DirBase: f3b10360  ObjectTable: e1c276b8  HandleCount: 500.

    Image: MyService.exe

...

...

...
0: kd> !kdexts.handle 0 3 037c

...

...

...

0510: Object: 89237d88  GrantedAccess: 001f0fff Entry: e1cafa20

Object: 89237d88  Type: (8ad84900) Process

    ObjectHeader: 89237d70 (old version)

        HandleCount: 1  PointerCount: 2

…

…

…
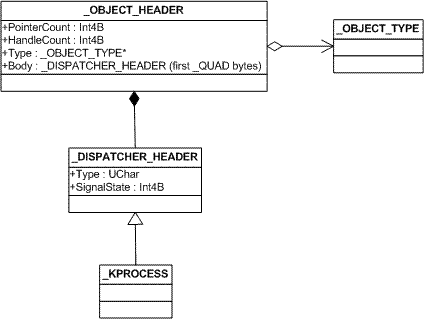
Let’s look at the last process object 89237d88. This is the start of object-specific structure whose first member is _DISPATCHER_HEADER. Every object-specific structure is preceded in memory by _OBJECT_HEADER structure and in our case its address is 89237d70. To illustrate this memory layout we can write this inheritance relationship in C++ pseudo-code where I put relevant structure members:
struct _KPROCESS : _DISPATCHER_HEADER

{

   // ... members

};
struct _DISPATCHER_HEADER

{

   UChar Type;

   // ... members

   Int4B SignalState;

   // ... members

};
struct _OBJECT_HEADER

{

   Int4B PointerCount;

   Int4B HandleCount;

   // ... members

   _OBJECT_TYPE *Type;

   // ... members

   _QUAD Body; // Int8B - first 8 bytes of _DISPATCHER_HEADER

};
HandleCount is the number of open handles and PointerCount is the number of dereferences.
I also put all this on the following simplified UML diagram:
Here is the detailed data for our process object:
0: kd> dt _OBJECT_HEADER 89237d70

ntdll!_OBJECT_HEADER

   +0x000 PointerCount     : 2

   +0x004 HandleCount      : 1

   +0x004 NextToFree       : 0x00000001

   +0x008 Type             : 0x8ad84900 _OBJECT_TYPE

   +0x00c NameInfoOffset   : 0 ''

   +0x00d HandleInfoOffset : 0 ''

   +0x00e QuotaInfoOffset  : 0 ''

   +0x00f Flags            : 0x20 ' '

   +0x010 ObjectCreateInfo : 0x808ad180 _OBJECT_CREATE_INFORMATION

   +0x010 QuotaBlockCharged : 0x808ad180

   +0x014 SecurityDescriptor : 0xe1002bd6

   +0x018 Body             : _QUAD
0: kd> dt _DISPATCHER_HEADER 89237d88

ntdll!_DISPATCHER_HEADER

   +0x000 Type             : 0x3 ''

   +0x001 Absolute         : 0 ''

   +0x001 NpxIrql          : 0 ''

   +0x002 Size             : 0x1e ''

   +0x002 Hand             : 0x1e ''

   +0x003 Inserted         : 0 ''

   +0x003 DebugActive      : 0 ''

   +0x000 Lock             : 1966083

   +0×004 SignalState      : 1

   +0×008 WaitListHead     : _LIST_ENTRY [ 0×89237d90 - 0×89237d90 ]
0: kd> dt _OBJECT_TYPE 0x8ad84900

ntdll!_OBJECT_TYPE

   +0x000 Mutex            : _ERESOURCE

   +0x038 TypeList         : _LIST_ENTRY [ 0x8ad84938 - 0x8ad84938 ]

   +0×040 Name             : _UNICODE_STRING “Process”

   +0×048 DefaultObject    : (null)

   +0×04c Index            : 5

   +0×050 TotalNumberOfObjects : 0×18d

   +0×054 TotalNumberOfHandles : 0×35d

   +0×058 HighWaterNumberOfObjects : 0×2d4

   +0×05c HighWaterNumberOfHandles : 0xd66

   +0×060 TypeInfo         : _OBJECT_TYPE_INITIALIZER

   +0×0ac Key              : 0×636f7250

   +0×0b0 ObjectLocks      : [4] _ERESOURCE
We see that SignalState is 1 and this means that the process is in signaled state (exited) and the wait on it will be satisfied immediately (WaitForSingleObject will return). If we close its handle the object will be destroyed.
If we look at other objects threads are waiting for we would see SignalState equal to 0. For example, in the following thread below event handle 4b0 corresponds to a34d9940 _KEVENT address and the latter object is inherited from _DISPATCHER_HEADER:
3: kd> !thread a34369d0

THREAD a34369d0  Cid 1fc8.1e88  Teb: 7ffae000 Win32Thread: bc6d5818 WAIT: (Unknown) UserMode Non-Alertable

    a34d9940  SynchronizationEvent

    a3436a48  NotificationTimer

Not impersonating

DeviceMap                 e12256a0

Owning Process            a3340a10       Image:         IEXPLORE.EXE

Wait Start TickCount      1450409        Ticks: 38 (0:00:00:00.593)

Context Switch Count      7091                 LargeStack

UserTime                  00:00:01.015

KernelTime                00:00:02.250

Win32 Start Address mshtml!CExecFT::StaticThreadProc (0×7fab1061)

Start Address kernel32!BaseThreadStartThunk (0×77e617ec)

Stack Init f252b000 Current f252ac60 Base f252b000 Limit f2528000 Call 0

Priority 11 BasePriority 10 PriorityDecrement 0

ChildEBP RetAddr  Args to Child

f252ac78 80833465 a34369d0 a3436a78 00000003 nt!KiSwapContext+0×26

f252aca4 80829a62 00000000 f252ad14 00000000 nt!KiSwapThread+0×2e5

f252acec 80938d0c a34d9940 00000006 f252ac01 nt!KeWaitForSingleObject+0×346

f252ad50 8088978c 000004b0 00000000 f252ad14 nt!NtWaitForSingleObject+0×9a

f252ad50 7c8285ec 000004b0 00000000 f252ad14 nt!KiFastCallEntry+0xfc (TrapFrame @ f252ad64)

030dff08 7c827d0b 77e61d1e 000004b0 00000000 ntdll!KiFastSystemCallRet

030dff0c 77e61d1e 000004b0 00000000 030dff50 ntdll!NtWaitForSingleObject+0xc

030dff7c 77e61c8d 000004b0 000927c0 00000000 kernel32!WaitForSingleObjectEx+0xac

030dff90 7fab08a3 000004b0 000927c0 00000000 kernel32!WaitForSingleObject+0×12

030dffa8 7fab109c 00000000 7fab106e 030dffec mshtml!CDwnTaskExec::ThreadExec+0xae

030dffb0 7fab106e 030dffec 77e64829 02714f30 mshtml!CExecFT::ThreadProc+0×28

030dffb8 77e64829 02714f30 00000000 00000000 mshtml!CExecFT::StaticThreadProc+0xd

030dffec 00000000 7fab1061 02714f30 00000000 kernel32!BaseThreadStart+0×34
3: kd> dt _DISPATCHER_HEADER a34d9940

cutildll!_DISPATCHER_HEADER

   +0x000 Type             : 0x1 ''

   +0x001 Absolute         : 0xda ''

   +0x002 Size             : 0x4 ''

   +0x003 Inserted         : 0xa3 ''

   +0x003 DebugActive      : 0xa3 ''

   +0x000 Lock             : -1559963135

   +0×004 SignalState      : 0

   +0×008 WaitListHead     : _LIST_ENTRY [ 0xa3436a78 - 0xa3436a78 ]
For real life example of signaled process objects please see Zombie Processes pattern case study.
- Dmitry Vostokov @ DumpAnalysis.org -