Crash Dumps for Dummies (Part 7)
In the previous part I introduced clear separation between crashes and hangs and outlined memory dump capturing methods for each category. However, looking from user point of view we need to tell them what is the best way to capture a dump based on observations they have and their failure level, system or component. The latter failure type usually happens with user applications and services.
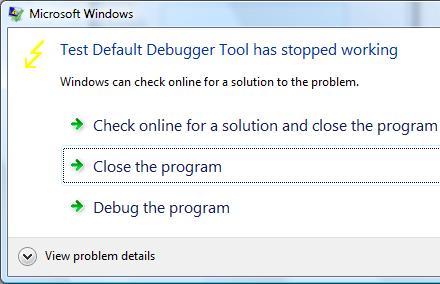
For user applications the best way is to get a memory dump proactively or put in another words, manually, and do not rely on a postmortem debugger that may not be set up correctly on a problem server in 100 server farm. If any error message box appears with a message that an application stopped working or that it has encountered an application error then you can use process dumpers like userdump.exe.
Suppose we have the following error message when TestDefaultDebugger application crashes on Vista x64 (the same technique is applicable to earlier OS too):
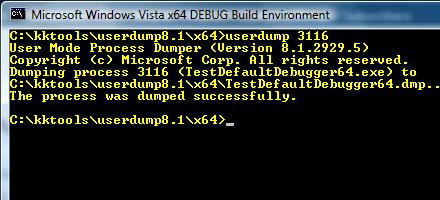
Then we can dump the process while it displays the problem if we know its process ID:
In Vista this can be done even more easily by dumping the process from Task Manager directly:
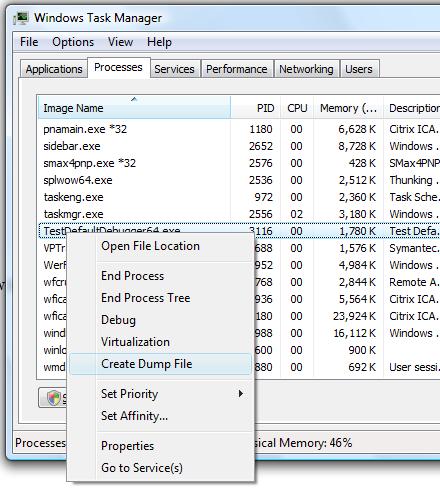
Choose Create Dump File:
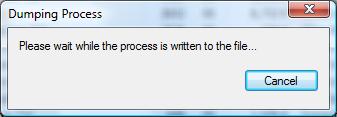
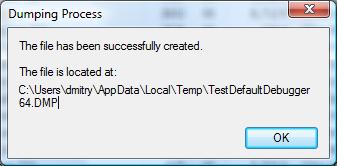
and the process dump is saved in a user location for temporary files:
Although the application above is the native Windows application the same method applies for .NET applications. For example, the forthcoming TestDefaultDebugger.NET application
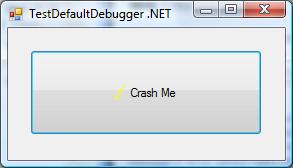
shows the following dialog:
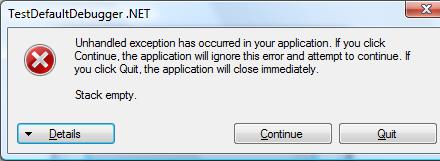
and we can dump the process manually while it displays the message.
Although both applications will disappear from Task Manager if we choose Close or Quit on their error message boxes and therefore will be considered as crashes under my terminology, at the time when they show their stop messages they are considered as application hangs and this is why we use manual process dumpers.
Other scenarios including system failures will be considered in the next part.
- Dmitry Vostokov @ DumpAnalysis.org -
July 26th, 2008 at 7:50 pm
[…] Crash Dumps for Dummies (Part 7) […]
June 4th, 2009 at 10:34 am
[…] Although the dialog points to html.iec it is good to show the basic techniques for component identification using WinDbg. I took a manual user dump of that unresponsive process while it was showing that dialog above using Task Manager: […]