Archive for the ‘Software Engineering’ Category
Sunday, March 11th, 2012
After introducing software narrative planes it is logical to expand the field of software narratology to cover the whole domain of software construction and post-construction. We therefore combine both pairs of planes to create a narratological square:
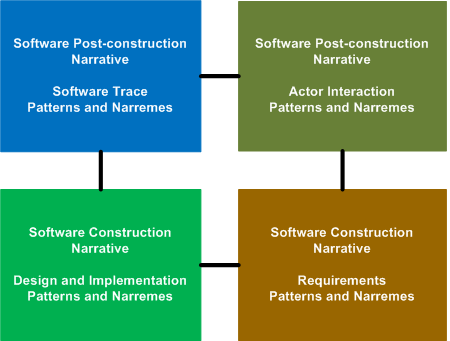
Please also register for the forthcoming free Webinar: Introduction to Software Narratology where I plan to provide a coherent overview of the recent developments in this new field.
- Dmitry Vostokov @ DumpAnalysis.org + TraceAnalysis.org -
Posted in Computer Science, Debugging, Science of Software Tracing, Software Engineering, Software Narrative Science, Software Narratology, Software Narremes, Software Problem Description Patterns, Software Problem Solving, Software Trace Analysis | No Comments »
Saturday, March 3rd, 2012

Memory Dump Analysis Services organizes a new training course:
Description: Learn how to analyze app crashes and freezes, navigate through process core memory dump space and diagnose corruption, memory leaks, CPU spikes, blocked threads, deadlocks, wait chains, and much more. We use a unique and innovative pattern-driven analysis approach to speed up the learning curve. The training consists of practical step-by-step exercises using Xcode and GDB environments highlighting various patterns diagnosed in 64-bit process core memory dumps. The training also includes an overview of relevant similarities and differences between Windows and Mac OS X user space memory dump analysis useful for engineers with Wintel background.
If you are registered you are allowed to optionally submit your app core dumps before the training. This will allow us in addition to the carefully constructed problems tailor additional examples to the needs of the attendees.
The training consists of 2 two-hour sessions. When you finish the training you additionally get:
- A full transcript in PDF format (retail price $200)
- 6 volumes of Memory Dump Analysis Anthology in PDF format (retail price $120)
- A personalized attendance certificate with unique CID (PDF format)
- Mac OS X Debugging: Practical Foundations in PDF format (retail price $15)
- Free Dump Analysis World Network membership including updates to full PDF transcript Q&A section
Prerequisites: Basic Mac OS X troubleshooting and debugging
Audience: Software technical support and escalation engineers, system administrators, software developers and quality assurance engineers.
Session 1: October 19, 2012 4:00 PM - 6:00 PM BST
Session 2: October 22, 2012 4:00 PM - 6:00 PM BST
Price: 210 USD
Space is limited.
Reserve your remote training seat now at:
https://student.gototraining.com/r/3803636572165653760
If you are mainly interested in Windows memory dump analysis there is another course available:
Accelerated Windows Memory Dump Analysis
- Dmitry Vostokov @ DumpAnalysis.org + TraceAnalysis.org -
Posted in Announcements, Assembly Language, Crash Dump Analysis, Crash Dump Patterns, Debugging, Escalation Engineering, Mac Crash Corner, Mac OS X, Memory Dump Analysis Services, Software Engineering, Software Technical Support, Testing, Training and Seminars | No Comments »
Sunday, February 19th, 2012
Memory Dump Analysis Services (DumpAnalysis.com) organizes a free Webinar about software narratology: an application of ideas from narratology to software narrative stories.

Learn about this exciting new discipline and a field of research. When software executes it gives us its stories in the form of UI events, software traces and logs. Such stories can be analyzed for their structure and patterns for troubleshooting, debugging and problem resolution purposes.
Prerequisites: basic software troubleshooting and ability to read software generated logs.
Audience: anyone can benefit from this new perspective: from software users to software engineers and managers.
Space is limited.
Reserve your Webinar seat now at:
https://www3.gotomeeting.com/register/603136294
- Dmitry Vostokov @ DumpAnalysis.org + TraceAnalysis.org -
Posted in Announcements, Computer Science, Debugging, Escalation Engineering, Intelligence Analysis Patterns, Memory Dump Analysis Services, SPDL, Science of Software Tracing, Security, Software Behavior DNA, Software Behavior Patterns, Software Behavioral Genome, Software Engineering, Software Narrative Fiction, Software Narratology, Software Problem Description Patterns, Software Problem Solving, Software Technical Support, Software Trace Analysis, Software Trace Deconstruction, Software Trace Linguistics, Software Trace Modeling, Software Trace Reading, Software Trace Visualization, Software Tracing Implementation Patterns, Software Tracing for Dummies, Software Troubleshooting Patterns, Software Victimology, Structural Trace Patterns, Testing, Tools, Trace Analysis Patterns, Troubleshooting Methodology, UI Problem Analysis Patterns, Unified Debugging Patterns, Unit Testing, Victimware, Webinars, Windows System Administration | No Comments »
Thursday, February 2nd, 2012
Forthcoming Accelerated Software Trace Analysis training requires extensive real life like software logs with multiple software behaviour patterns. The similar accelerated memory dump analysis trainings (unmanaged / native Windows and .NET) also required good memory dumps but this problem was solved by modeling patterns of abnormal software behaviour in an appropriate implementation language such as C++ and C#. Modeling software traces with hundreds of software components, processes and threads would require enormous programming efforts. Therefore, the natural approach is to describe a desired software trace in some declarative language (or minimally imperative) and get a million line software log that models a specific combination of trace analysis patterns. So, welcome to such a language called Narralog: Software Narrative Log or Narrative Logic. Please note that this language is different from Riemann programming language which is a language to describe software problems and generate software problem solving tools. Language details and whether a kind of a Metadefect Template Library will be used to implement Narralog or simple macroprogramming is suffice will be decided and announced when we further develop our training.
- Dmitry Vostokov @ DumpAnalysis.org + TraceAnalysis.org -
Posted in Metadefect Template Library, Narralog Programming Language, Riemann Programming Language, SPDL, Software Behavior DNA, Software Behavior Patterns, Software Behavioral Genome, Software Defect Construction, Software Engineering, Software Narrative Fiction, Software Narratology, Software Problem Solving, Software Trace Analysis, Software Trace Modeling, Software and Modeling, Trace Analysis Patterns | No Comments »
Saturday, January 7th, 2012
This is another tracing example of unified debugging patterns introduced previously.
- Analysis Patterns
Focus of Tracing
- Architectural Patterns
Debug Event Subscription / Notification
- Design Patterns
Shared Debug Event State
- Implementation Patterns
Shared Variable
- Usage Patterns
Saving a memory address obtained at a breakpoint event in a debugger pseudo-register for use at later breakpoint events
Debugging.tv published a case study for tracing window messages in WinDbg. There a pseudo-register is used to save a buffer address before GetMessage call and then to reuse it after the call. Please look at Event State Management slide on Frames episode 0×06 presentation. The full WinDbg log and the recording are available there too.
- Dmitry Vostokov @ DumpAnalysis.org + TraceAnalysis.org -
Posted in Debugging, Debugging TV, Software Architecture, Software Behavior Patterns, Software Engineering, Software Trace Analysis, Trace Analysis Patterns, Unified Debugging Patterns, WinDbg Scripts, WinDbg Tips and Tricks | No Comments »
Sunday, November 13th, 2011
During the previous several months some companies and individuals expressed their interest in the training (the next one is scheduled for January) but its time was not suitable due to different geographic time zones. So I have decided to publish this training in a book format (currently in PDF) and make it available in paperback on Amazon and B&N later. Book details:
- Title: Accelerated .NET Memory Dump Analysis: Training Course Transcript and WinDbg Practice Exercises with Notes
- Description: The full transcript of Memory Dump Analysis Services Training with 7 step-by-step exercises, notes, source code of specially created modeling applications and selected Q&A. Covers 20 .NET memory dump analysis patterns plus additional unmanaged patterns.
- Authors: Dmitry Vostokov, Memory Dump Analysis Services
- Publisher: OpenTask (November 2011)
- Language: English
- Product Dimensions: 28.0 x 21.6
- Paperback: 204 pages
- ISBN-13: 978-1908043320
Table of Contents
Now available for sale in PDF format from Memory Dump Analysis Services.
- Dmitry Vostokov @ DumpAnalysis.org + TraceAnalysis.org -
Posted in .NET Debugging, Announcements, Books, Crash Dump Analysis, Crash Dump Patterns, Debugging, Escalation Engineering, Medicine, Memory Dump Analysis Services, Publishing, Software Engineering, Software Technical Support, Testing, Tools, Training and Seminars, WinDbg Tips and Tricks | No Comments »
Friday, November 11th, 2011
One of the new initiatives for 2012 is the development of SPDL (Software Problem Description Language). Its purpose is automatic generation of a software troubleshooting tool(s) based on the description of a problem. Here software problem means a post-construction problem as outlined in Introduction to Pattern-Driven Software Problem Solving. The tool construction will utilize an expanded set of DebugWare and Workaround patterns together with the refind version of RADII software development process. This will also provide necessary effectiveness, efficiency and enhanced problem solving capabilities to existing TaaS (Tools as a Service) implementations that are limited in the number of tools they offer.
- Dmitry Vostokov @ DumpAnalysis.org + TraceAnalysis.org -
Posted in Announcements, Computer Science, Crash Dump Analysis, DebugWare Patterns, Debugging, Generative Debugging, New Acronyms, New Debugging School, SPDL, Software Behavior DNA, Software Behavior Patterns, Software Behavioral Genome, Software Engineering, Software Problem Solving, Software Technical Support, Software Trace Analysis, Software Troubleshooting Patterns, Software and Modeling, TaaS, Testing, Tool Objects, Tools, Troubleshooting Methodology, Unified Debugging Patterns, Windows System Administration | No Comments »
Sunday, November 6th, 2011
Posted in .NET Debugging, Crash Dump Analysis, Crash Dump Patterns, Debugging, Escalation Engineering, Memory Dump Analysis Services, Software Engineering, Software Technical Support, Testing, Training and Seminars, WinDbg Tips and Tricks | 2 Comments »
Thursday, November 3rd, 2011
The new 6th volume contains revised, edited, cross-referenced, and thematically organized selected DumpAnalysis.org blog posts about memory dump and software trace analysis, software troubleshooting and debugging written in November 2010 - October 2011 for software engineers developing and maintaining products on Windows platforms, quality assurance engineers testing software on Windows platforms, technical support and escalation engineers dealing with complex software issues, and security researchers, malware analysts and reverse engineers. The sixth volume features:
- 56 new crash dump analysis patterns including 14 new .NET memory dump analysis patterns
- 4 new pattern interaction case studies
- 11 new trace analysis patterns
- New Debugware pattern
- Introduction to UI problem analysis patterns
- Introduction to intelligence analysis patterns
- Introduction to unified debugging pattern language
- Introduction to generative debugging, metadefect template library and DNA of software behaviour
- The new school of debugging and trends
- .NET memory dump analysis checklist
- Software trace analysis checklist
- Introduction to close and deconstructive readings of a software trace
- Memory dump analysis compass
- Computical and Stack Trace Art
- The abductive reasoning of Philip Marlowe
- Orbifold memory space and cloud computing
- Memory worldview
- Interpretation of cyberspace
- Relationship of memory dumps to religion
- Fully cross-referenced with Volume 1, Volume 2, Volume 3, Volume 4, and Volume 5
Product information:
- Title: Memory Dump Analysis Anthology, Volume 6
- Author: Dmitry Vostokov
- Language: English
- Product Dimensions: 22.86 x 15.24
- Paperback: 300 pages
- Publisher: Opentask (December 2011)
- ISBN-13: 978-1-908043-19-1
- Hardcover: 300 pages
- Publisher: Opentask (January 2012)
- ISBN-13: 978-1-908043-20-7

Back cover features 3d memory space visualization image created with ParaView.
- Dmitry Vostokov @ DumpAnalysis.org + TraceAnalysis.org -
Posted in .NET Debugging, Announcements, Art, Books, Cloud Computing, Cloud Memory Dump Analysis, Common Mistakes, Complete Memory Dump Analysis, Computer Science, Computicart (Computical Art), Crash Dump Analysis, Crash Dump Patterns, Cyber Intelligence, Cyber Problems, Cyber Security, Cyber Space, Cyber Warfare, DebugWare Patterns, Debugging, Debugging Industry, Debugging Methodology, Debugging Slang, Debugging Trends, Escalation Engineering, Generative Debugging, Intelligence Analysis Patterns, Kernel Development, Memoidealism, Memoretics, Memory Visualization, Metadefect Template Library, New Debugging School, Philosophy, Physicalist Art, Publishing, Root Cause Analysis, Science of Memory Dump Analysis, Science of Software Tracing, Security, Software Behavior DNA, Software Behavior Patterns, Software Behavioral Genome, Software Engineering, Software Narratology, Software Technical Support, Software Trace Analysis, Software Trace Deconstruction, Software Trace Reading, Software Victimology, Testing, The Way of Philip Marlowe, Tools, Trace Analysis Patterns, Training and Seminars, Troubleshooting Methodology, UI Problem Analysis Patterns, Unified Debugging Patterns, Victimware, WinDbg Tips and Tricks, Windows 7, Windows Azure, Windows Data Structures, Windows Server 2008, Windows System Administration, x64 Windows | No Comments »
Wednesday, September 21st, 2011
Memoretics promotes pattern-driven memory dump and software trace analysis which has many uses but not limited to:
- Software and site reliability
- Software Debugging
- QA and Software Testing
- Computer Security
- Software Troubleshooting
- Malware Research and Analysis
- Tools as a Service (TaaS)
- Supportability
- Software Diagnostics

- Dmitry Vostokov @ DumpAnalysis.org + TraceAnalysis.org -
Posted in Cloud Memory Dump Analysis, Computer Forensics, Crash Dump Analysis, Crash Dump Patterns, DebugWare Patterns, Debugging, Debugging Trends, Escalation Engineering, Malware Analysis, Malware Patterns, Memiotics (Memory Semiotics), Memoretics, Memory Analysis Forensics and Intelligence, Metadefect Template Library, Metamalware, Pattern Models, Pattern Prediction, Reverse Engineering, Root Cause Analysis, Science of Memory Dump Analysis, Science of Software Tracing, Security, Software Behavior DNA, Software Behavior Patterns, Software Behavioral Genome, Software Defect Construction, Software Engineering, Software Generalist, Software Narratology, Software Support Patterns, Software Technical Support, Software Trace Analysis, Software Troubleshooting Patterns, Structural Memory Patterns, Structural Trace Patterns, Systems Thinking, Testing, Tools, Trace Analysis Patterns, Troubleshooting Methodology, UI Problem Analysis Patterns, Unified Debugging Patterns, Victimware, Windows System Administration, Workaround Patterns | No Comments »
Wednesday, September 21st, 2011
Memoretics as a science of memory snapshots borrows many ideas from the following disciplines (the list is not exhaustive):
- Troubleshooting and Debugging
- Intelligence Analysis
- Critical Thinking
- Forensics
- Linguistics
- Archaeology
- Psychoanalysis
- History
- Mathematics: Sets and Categories
- Literary Criticism and Narratology
It also contributes many ideas back. The following diagram depicts such an interaction:

- Dmitry Vostokov @ DumpAnalysis.org + TraceAnalysis.org -
Posted in Archaeology of Computer Memory, Categorical Debugging, Computer Forensics, Computer Science, Countefactual Debugging, Crash Dump Analysis, Crash Dump De-analysis, Crash Dump Patterns, Debugging, Debugging Methodology, Dublin School of Security, Education and Research, Escalation Engineering, General Memory Analysis, Generative Debugging, Hermeneutics of Memory Dumps and Traces, History, Intelligence Analysis Patterns, M->analysis, Malware Analysis, Malware Patterns, Mathematics of Debugging, Memiotics (Memory Semiotics), Memoretics, Memory Analysis Forensics and Intelligence, Memory Dump Analysis and History, Memory Systems Language, Memory Visualization, Metadefect Template Library, Metamalware, New Debugging School, Paleo-debugging, Pattern Models, Pattern Prediction, Psychoanalysis of Software Maintenance and Support, Psychology, Reverse Engineering, Root Cause Analysis, Science of Memory Dump Analysis, Science of Software Tracing, Security, Software Architecture, Software Behavior DNA, Software Behavior Patterns, Software Behavioral Genome, Software Chorography, Software Chorology, Software Defect Construction, Software Engineering, Software Narratology, Software Technical Support, Software Trace Analysis, Software Trace Analysis and History, Software Trace Deconstruction, Software Trace Linguistics, Software Trace Reading, Software Trace Visualization, Software Tracing Implementation Patterns, Software Troubleshooting Patterns, Software Victimology, Software and History, Structural Memory Analysis and Social Sciences, Structural Memory Patterns, Structural Trace Patterns, Systems Thinking, Testing, Tools, Trace Analysis Patterns, Troubleshooting Methodology, UI Problem Analysis Patterns, Unified Debugging Patterns, Victimware, Virtualization, Visual Dump Analysis, Workaround Patterns | No Comments »
Sunday, August 14th, 2011
Due to the need to extend existing basic and intermediate Accelerated Windows Memory Dump Analysis training Memory Dump Analysis Services organises advanced training course. Here is the description and registration information:
Learn how to navigate through memory dump space and Windows data structures to troubleshoot and debug complex software incidents. We use a unique and innovative pattern-driven analysis approach to speed up the learning curve. The training consists of practical step-by-step exercises using WinDbg to diagnose structural and behavioral patterns in 32-bit and 64-bit process, kernel and complete memory dumps.

If you are registered you are allowed to optionally submit your memory dumps before the training. This will allow us in addition to the carefully constructed problems tailor extra examples to the needs of the attendees.
The training consists of one four-hour session and additional homework exercises. When you finish the training you additionally get:
- A full transcript in PDF format (retail price $200)
- 5 volumes of Memory Dump Analysis Anthology in PDF format (retail price $100)
- A personalized attendance certificate with unique CID (PDF format)
Prerequisites: Basic and intermediate level Windows memory dump analysis: ability to list processors, processes, threads, modules, apply symbols, walk through stack traces and raw stack data, diagnose patterns such as heap corruption, CPU spike, memory and handle leaks, access violation, stack overflow, critical section and resource wait chains and deadlocks. If you don’t feel comfortable with prerequisites then Accelerated Windows Memory Dump Analysis training is recommended to take (or purchase a corresponding book) before attending this course.
Audience: Software developers, software technical support and escalation engineers.
Session: December 9, 2011 4:00 PM - 8:00 PM GMT
Price: 210 USD
Space is limited.
Reserve your remote training seat now at:
https://student.gototraining.com/24s4l/register/3788047691824598784
- Dmitry Vostokov @ DumpAnalysis.org + TraceAnalysis.org -
Posted in Announcements, Complete Memory Dump Analysis, Crash Dump Analysis, Crash Dump Patterns, Debugging, Escalation Engineering, Kernel Development, Memory Dump Analysis Services, Multithreading, Reverse Engineering, Root Cause Analysis, Software Engineering, Software Technical Support, Structural Memory Patterns, Training and Seminars, Uses of UML, Vista, WinDbg Scripts, WinDbg Tips and Tricks, Windows 7, Windows Data Structures, Windows Server 2008, x64 Windows | No Comments »
Thursday, August 11th, 2011
Due to popular demand and the need to extend existing Accelerated Windows Memory Dump Analysis training Memory Dump Analysis Services organises the new training course. Here is the description and registration information:
Learn how to analyze .NET application and service crashes and freezes, navigate through memory dump space (managed and unmanaged code) and diagnose corruption, leaks, CPU spikes, blocked threads, deadlocks, wait chains, resource contention, and much more. We use a unique and innovative pattern-driven analysis approach to speed up the learning curve. The training consists of practical step-by-step exercises using WinDbg to diagnose patterns in 32-bit and 64-bit process memory dumps.

If you are registered you are allowed to optionally submit your memory dumps before the training. This will allow us in addition to the carefully constructed problems tailor extra examples to the needs of the attendees.
The training consists of one four-hour session and additional homework exercises. When you finish the training you additionally get:
- A full transcript in PDF format (retail price $200)
- 5 volumes of Memory Dump Analysis Anthology in PDF format (retail price $100)
- A personalized attendance certificate with unique CID (PDF format)
Prerequisites: Basic .NET programming and debugging.
Audience: Software developers, software technical support and escalation engineers.
Session: October 28, 2011 4:00 PM - 8:00 PM GMT
Price: 210 USD
Space is limited.
Reserve your remote training seat now at:
https://student.gototraining.com/24s4l/register/423991811034037760
- Dmitry Vostokov @ DumpAnalysis.org + TraceAnalysis.org -
Posted in .NET Debugging, Announcements, Cloud Memory Dump Analysis, Crash Dump Analysis, Crash Dump Patterns, Debugging, Escalation Engineering, Memory Dump Analysis Services, Multithreading, Software Engineering, Software Technical Support, Training and Seminars, Windows 7, Windows Azure, Windows Server 2008, x64 Windows | No Comments »
Tuesday, August 9th, 2011
I showed this artwork to many people and they responded that they didn’t understand or hope one day they would understand. Only one guy (a professional manager) responded positively with understanding. What I think is that real art can be interpreted in many ways. So I kindly await your criticism.
PS. This Computicart (Computical Art) work was inspired by a pet parrot at home. I’ve been observing its behaviour for more than 6 months and tried to discern a few patterns. Its name is KiKi (not related to Ki* functions).
- Dmitry Vostokov @ DumpAnalysis.org + TraceAnalysis.org -
Posted in Art, Computicart (Computical Art), Crash Dump Analysis, Debugging, Escalation Engineering, Fun with Crash Dumps, Fun with Debugging, Software Engineering, Software Technical Support | No Comments »
Thursday, April 21st, 2011
Imagine a pattern-driven crash analysis report (car) when you need it: at the very moment of a crash, just in time! And the car drives you to a problem resolution. Imagine also a periodic pattern-driven just-in-time memory space analysis (JIT MSA) that provides you instant intelligent reports on what’s going on inside memory while your application, service or system is running! This is a forthcoming optional client side part of CARE (Crash Analysis Report Environment) which is being developed by Memory Dump Analysis Services engineering team under the leadership of Alexey Golikov. Combined with generative debugging techniques both client and server parts form a complete unique enterprise crash and hang analysis solution suitable for development and production environments. Stay tuned for further exciting updates.
PS. The car drives on a road to the first fault software problem solving.
- Dmitry Vostokov @ DumpAnalysis.org + TraceAnalysis.org -
Posted in Crash Analysis Report Environment (CARE), Crash Dump Analysis, Debugging, Debugging Methodology, Escalation Engineering, First Fault Problem Solving, Generative Debugging, JIT Crash Analysis, JIT Memory Space Analysis, Memory Analysis Forensics and Intelligence, Memory Dump Analysis Services, Pattern Prediction, Software Behavior Patterns, Software Engineering, Software Technical Support, Testing, Tools, Windows System Administration | No Comments »
Sunday, April 17th, 2011
I’m pleased to announce that MDAA, Volume 5 is available in PDF format:
www.dumpanalysis.org/Memory+Dump+Analysis+Anthology+Volume+5
It features:
- 25 new crash dump analysis patterns
- 11 new pattern interaction case studies (including software tracing)
- 16 new trace analysis patterns
- 7 structural memory patterns
- 4 modeling case studies for memory dump analysis patterns
- Discussion of 3 common analysis mistakes
- Malware analysis case study
- Computer independent architecture of crash analysis report service
- Expanded coverage of software narratology
- Metaphysical and theological implications of memory dump worldview
- More pictures of memory space and physicalist art
- Classification of memory visualization tools
- Memory visualization case studies
- Close reading of the stories of Sherlock Holmes: Dr. Watson’s observational patterns
- Fully cross-referenced with Volume 1, Volume 2, Volume 3, and Volume 4
Its table of contents is available here:
www.dumpanalysis.org/MDAA/MDA-Anthology-V5-TOC.pdf
Paperback and hardcover versions should be available in a week or two. I also started working on Volume 6 that should be available in November-December.
- Dmitry Vostokov @ DumpAnalysis.org + TraceAnalysis.org -
Posted in Aesthetics of Memory Dumps, Analysis Notation, Announcements, AntiPatterns, Archaeology of Computer Memory, Art, Assembly Language, Best Practices, Books, C and C++, CDF Analysis Tips and Tricks, Categorical Debugging, Citrix, Common Mistakes, Common Questions, Complete Memory Dump Analysis, Computer Forensics, Computer Science, Crash Analysis Report Environment (CARE), Crash Dump Analysis, Crash Dump De-analysis, Crash Dump Patterns, Crash Dumps for Dummies, Cyber Warfare, Debugging, Debugging Bureau, Debugging Industry, Debugging Methodology, Debugging Slang, Debugging Trends, Deep Down C++, Dr. Watson, Dublin School of Security, Education and Research, Escalation Engineering, Fun with Crash Dumps, Fun with Debugging, Fun with Software Traces, General Memory Analysis, Hermeneutics of Memory Dumps and Traces, Images of Computer Memory, Kernel Development, Malware Analysis, Mathematics of Debugging, Memiotics (Memory Semiotics), Memory Analysis Forensics and Intelligence, Memory Diagrams, Memory Dump Analysis Services, Memory Dumps in Myths, Memory Space Art, Memory Systems Language, Memory Visualization, Memory and Glitches, Metaphysics of Memory Worldview, Multithreading, Music for Debugging, New Acronyms, New Debugging School, New Words, Pattern Models, Philosophy, Physicalist Art, Publishing, Reverse Engineering, Science of Memory Dump Analysis, Science of Software Tracing, Security, Software Architecture, Software Behavior Patterns, Software Chorography, Software Chorology, Software Defect Construction, Software Engineering, Software Generalist, Software Maintenance Institute, Software Narratology, Software Technical Support, Software Trace Analysis, Software Trace Reading, Software Trace Visualization, Software Tracing for Dummies, Software Troubleshooting Patterns, Software Victimology, Structural Memory Patterns, Structural Trace Patterns, Systems Thinking, Testing, The Way of Philip Marlowe, Tools, Trace Analysis Patterns, Training and Seminars, Troubleshooting Methodology, Victimware, Vista, Webinars, WinDbg Scripting Extensions, WinDbg Scripts, WinDbg Tips and Tricks, WinDbg for GDB Users, Windows 7, Windows Server 2008, Windows System Administration, Workaround Patterns, x64 Windows | No Comments »
Tuesday, April 5th, 2011
Finally, after the numerous delays, the first Windows Debugging Notebook is almost ready for publication by the end of this month with a new cover and a foreword written by Mario Hewardt, the author of Advanced Windows Debugging and Advanced .NET Debugging books:
It is the first notebook because we have decided to split it into 3 different memory space volumes and one additional overview volume for concepts and tools:
- Windows Debugging Notebook: Essential User Space WinDbg Commands (ISBN: 978-1906717001 and 978-0955832857)
- Windows Debugging Notebook: Essential Kernel Space WinDbg Commands (ISBN: 978-1908043146)
- Windows Debugging Notebook: Essential Managed Space WinDbg .NET Commands (ISBN: 978-1908043153)
- Windows Debugging Notebook: Essential Concepts and Tools (ISBN: 978-1908043160)
On a bookshelf you would be able to distinguish between the first 3 volumes by a 3 color spine stripe with an appropriate check on it: red for kernel, blue for user, and green for managed space.
The Table of Contents has been changed too.
- Dmitry Vostokov @ DumpAnalysis.org + TraceAnalysis.org -
Posted in Announcements, Assembly Language, Books, Crash Dump Analysis, Debugging, Escalation Engineering, Publishing, Reverse Engineering, Security, Software Engineering, Software Technical Support, WinDbg Scripts, WinDbg Tips and Tricks | 2 Comments »
Saturday, March 26th, 2011
The presentation materials from the webinar (25th of March, 2011) are available for download:
http://www.dumpanalysis.com/PDSPSI-materials
Thanks to everyone who registered and attended!
- Dmitry Vostokov @ DumpAnalysis.org + TraceAnalysis.org -
Posted in Announcements, Crash Dump Analysis, Crash Dump Patterns, DebugWare Patterns, Debugging, Debugging Methodology, Escalation Engineering, Mac Crash Corner, Malware Analysis, Malware Patterns, Memory Analysis Forensics and Intelligence, Software Architecture, Software Behavior Patterns, Software Engineering, Software Technical Support, Software Trace Analysis, Software Tracing Implementation Patterns, Software Troubleshooting Patterns, Structural Memory Patterns, Structural Trace Patterns, Tools, Trace Analysis Patterns, Training and Seminars, Troubleshooting Methodology, Unified Debugging Patterns, Webinars, Workaround Patterns | No Comments »
Monday, March 14th, 2011
“… he who has not been in” support “does not know what” debugging “is.”
Attributed to Leo Tolstoy, by Adam Ulam, The Bolsheviks
- Dmitry Vostokov @ DumpAnalysis.org + TraceAnalysis.org -
Posted in Bugtations, Crash Dump Analysis, Debugging, Escalation Engineering, Fun with Crash Dumps, Fun with Debugging, Fun with Software Traces, Software Engineering, Software Technical Support, Software Trace Analysis | No Comments »
Monday, March 7th, 2011

The first Webinar to start an in-depth discussion of pattern-driven software troubleshooting, debugging and maintenance:
Date: 25th of March 2011
Time: 18:30 (GMT) 14:30 (EST) 11:30 (PST)
Duration: 60 minutes
Space is limited.
Reserve your Webinar seat now at:
https://www3.gotomeeting.com/register/448268158
Topics include:
- A Short History of DumpAnalysis.org
- Memory Dump Analysis Patterns
- Troubleshooting and Debugging Tools (Debugware) Patterns
- Software Trace Analysis Patterns
- From Software Defects to Software Behavior
- Workaround Patterns
- Structural Memory Patterns
- Memory Analysis Domain Pattern Hierarchy
- New Directions
Prerequisites: experience in software troubleshooting and/or debugging.
- Dmitry Vostokov @ DumpAnalysis.org + TraceAnalysis.org -
Posted in .NET Debugging, Analysis Notation, Announcements, AntiPatterns, Best Practices, CDA Pattern Classification, Crash Dump Analysis, Crash Dump Patterns, DebugWare Patterns, Debugging, Debugging Methodology, Debugging Trends, Escalation Engineering, Java Debugging, Linux Crash Corner, Mac Crash Corner, Malware Analysis, Malware Patterns, Memory Analysis Forensics and Intelligence, Memory Dump Analysis Services, Pattern Models, Pattern Prediction, Presentations, Software Behavior Patterns, Software Chorology, Software Engineering, Software Narratology, Software Technical Support, Software Trace Analysis, Software Trace Reading, Software Tracing Implementation Patterns, Software Troubleshooting Patterns, Structural Memory Patterns, Structural Trace Patterns, Systems Thinking, Testing, Trace Analysis Patterns, Training and Seminars, Troubleshooting Methodology, Unified Debugging Patterns, Webinars, Workaround Patterns | No Comments »