Archive for the ‘Software Engineering’ Category
Thursday, February 17th, 2011
This is the ultimate multi- and cross-platform debugging reference project dubbed internally as “Memory Dump of Debugging”. Useful for years to come, this encyclopedia would cover all aspects of debugging with articles from leading experts from both industry and academia. Preliminary product information:
- Title: Encyclopedia of Debugging
- Editor: Dmitry Vostokov
- Hardcover: 1200 pages
- Publisher: OpenTask (March 2014)
- ISBN-13: 978-1-908043-12-2
The title is a successor to both Encyclopedia of Crash Dump Analysis Patterns (ISBN: 978-1906717216) and Dictionary of Debugging (ISBN: 978-1906717353) the publisher plans to release in the mean time.
- Dmitry Vostokov @ DumpAnalysis.org + TraceAnalysis.org -
Posted in Announcements, Computer Science, Crash Dump Analysis, Debugging, Dictionary of Debugging, Encyclopedia of Debugging, Publishing, Software Engineering, Software Trace Analysis | No Comments »
Monday, January 3rd, 2011
Resolution rush - The rush of software technical support and maintenance engineers to provide the resolution to a suddenly escalated incident.
Examples: After it crashed 3 times in a row at the customer site our VP was called and we all got the resolution rush.
- Dmitry Vostokov @ DumpAnalysis.org + TraceAnalysis.org -
Posted in Crash Dump Analysis, Debugging, Debugging Slang, Escalation Engineering, Fun with Crash Dumps, Fun with Debugging, Fun with Software Traces, Software Engineering, Software Technical Support, Software Trace Analysis | No Comments »
Saturday, January 1st, 2011
With the new year starts the new initiative to integrate traditional multidisciplinary debugging approaches and methodologies with multiplatform pattern-driven software problem solving, unified debugging patterns, best practices in memory dump analysis and software tracing, computer security, economics, and the new emerging trends I’m going to write about during this year.
- Dmitry Vostokov @ DumpAnalysis.org + TraceAnalysis.org -
Posted in Announcements, Best Practices, Computer Forensics, Computer Science, Countefactual Debugging, Crash Analysis Report Environment (CARE), Crash Dump Analysis, Crash Dump Patterns, DebugWare Patterns, Debugging, Debugging Industry, Debugging Methodology, Debugging Trends, Dublin School of Security, Economics, Education and Research, Escalation Engineering, First Fault Problem Solving, Malware Analysis, Malware Patterns, Mathematics of Debugging, Memiotics (Memory Semiotics), Memoretics, Memory Analysis Forensics and Intelligence, Memory Analysis Report System, Memory Dump Analysis Services, Memory Systems Language, Memory Visualization, New Debugging School, Science of Memory Dump Analysis, Science of Software Tracing, Security, Software Behavior Patterns, Software Defect Construction, Software Engineering, Software Generalist, Software Maintenance Institute, Software Narratology, Software Trace Analysis, Software Trace Visualization, Software Tracing Implementation Patterns, Software Troubleshooting Patterns, Structural Memory Patterns, Structural Trace Patterns, Systems Thinking, Testing, Tool Objects, Tools, Trace Analysis Patterns, Training and Seminars, Troubleshooting Methodology, Unified Debugging Patterns, Victimware, Visual Dump Analysis, Webinars, Workaround Patterns | No Comments »
Wednesday, December 29th, 2010
In these post series we are going to discuss the best practices for software tracing implementation including appropriate patterns and their links to software trace analysis patterns. The first one is called Period Timestamp where the start and the end time (and the date if necessary) are recorded in the trace file. This helps in Inter-Correlation and News Value analysis between several different trace types. For example, in one scenario, we had WindowHistory and MessageHistory logs. We identified a problem in the former log as happening at this time:
Handle: 00010196 Class: "ClassA" Title: "TitleA"

   Captured at: 13:36:30:533

[…]
However, when we looked at the latter trace to search for specific window messages posted or sent before that time we saw that the recording started later than the former event:
Start time: 13:36:35:830
Period timestamps are necessary to distinguish Incomplete History from Truncated Trace where in the former case the absence of expected trace message is due to some problem.
From a unified debugging patterns perspective we have this sequence fragment:
Implementation Patterns: Period Timestamp
Usage Patterns: Trace Simultaneously
- Dmitry Vostokov @ DumpAnalysis.org + TraceAnalysis.org -
Posted in Best Practices, Debugging, Debugging Methodology, Software Architecture, Software Engineering, Software Narratology, Software Technical Support, Software Trace Analysis, Software Trace Reading, Software Tracing Implementation Patterns, Trace Analysis Patterns, Troubleshooting Methodology, Unified Debugging Patterns | No Comments »
Friday, December 17th, 2010
As the new decade is approaching (2011-2020) we would like to make a few previews and predictions:
- Increased complexity of software will bring more methods from biological, social sciences and humanities in addition to existing methods of automated debugging and computer science techniques
- Focus on first fault software problem solving (when aspect)
- Focus on pattern-driven software problem solving (how aspect)
- Fusion of debugging and malware analysis into a unified structural and behavioral pattern framework
- Visual debugging, memory and software trace visualization techniques
- Software maintenance certification
- Focus on domain-driven troubleshooting and debugging tools as a service (debugware TaaS)
- Focus on security issues related to memory dumps and software traces
- New scripting languages and programming language extensions for debugging
- The maturation of the science of memory snapshots and software traces (memoretics)
Imagining is not not limited to the above and more to come and explain in the forthcoming parts.
- Dmitry Vostokov @ DumpAnalysis.org + TraceAnalysis.org -
Posted in Announcements, Anthropology, Archaeology of Computer Memory, Biology, Certification, Computer Science, Countefactual Debugging, Crash Analysis Report Environment (CARE), Crash Dump Analysis, Crash Dump Patterns, DebugWare Patterns, Debugging, Debugging Industry, Debugging Methodology, Debugging Trends, Dublin School of Security, EasyDbg, Economics, Escalation Engineering, Evolution, First Fault Problem Solving, Futuristic Memory Dump Analysis, General Memory Analysis, General Science, Geography, Hardware, Hermeneutics of Memory Dumps and Traces, History, Humanities, Language, Laws of Troubleshooting and Debugging, Logic, Malware Analysis, Malware Patterns, Mathematics of Debugging, Memiotics (Memory Semiotics), Memoretics, Memory Analysis Forensics and Intelligence, Memory Analysis Report System, Memory Dump Analysis and History, Memory Systems Language, Memory Visualization, Paleo-debugging, Pattern Models, Pattern Prediction, Physics, Psychology, Publishing, Science of Memory Dump Analysis, Science of Software Tracing, Security, Social Media, Social Sciences, Software Architecture, Software Behavior Patterns, Software Chorography, Software Chorology, Software Defect Construction, Software Engineering, Software Generalist, Software Maintenance Institute, Software Narrative Fiction, Software Narratology, Software Technical Support, Software Trace Analysis, Software Trace Analysis and History, Software Trace Deconstruction, Software Trace Linguistics, Software Trace Visualization, Software Troubleshooting Patterns, Software Victimology, Statistics, Structural Memory Analysis and Social Sciences, Structural Memory Patterns, Structural Trace Patterns, Systems Thinking, Testing, Tools, Trace Analysis Patterns, Troubleshooting Methodology, Unified Debugging Patterns, Uses of UML, Victimware, Virtualization, Visual Dump Analysis, Windows System Administration, Workaround Patterns | No Comments »
Friday, December 3rd, 2010
We now start unifying software behavior analysis patterns with debugging architecture, design, implementation and usage. This is analogous to software construction where a problem analysis leads to various software engineering phases. The important difference here is the addition of debugging usage patterns. Let’s look at an example (we discuss suggested patterns later):
- Analysis Patterns
Shared Buffer Overwrite
- Architectural Patterns
Debug Event Subscription / Notification
- Design Patterns
Punctuated Execution
- Implementation Patterns
Breakpoint (software and hardware)
- Usage Patterns
Kernel vs. user space breakpoints
To differentiate this systematic approach from the various published ad hoc debugging patterns we call it Unified Debugging Pattern Language. ADI parts can also correspond to various DebugWare patterns where we provide a mapping later.
- Dmitry Vostokov @ DumpAnalysis.org + TraceAnalysis.org -
Posted in Crash Dump Analysis, Crash Dump Patterns, DebugWare Patterns, Debugging, Software Architecture, Software Behavior Patterns, Software Engineering, Software Trace Analysis, Trace Analysis Patterns, Unified Debugging Patterns | No Comments »
Thursday, November 25th, 2010
Posted in Announcements, Complete Memory Dump Analysis, Crash Analysis Report Environment (CARE), Crash Dump Analysis, Crash Dump De-analysis, Crash Dump Patterns, Debugging, Debugging Industry, Escalation Engineering, Kernel Development, Memory Analysis Forensics and Intelligence, Memory Dump Analysis Services, Minidump Analysis, Software Behavior Patterns, Software Engineering, Software Technical Support, Software Trace Analysis, Software Troubleshooting Patterns, Tools, Trace Analysis Patterns, Vista, Windows 7, Windows Server 2008, Windows System Administration, Workaround Patterns, x64 Windows | No Comments »
Thursday, November 25th, 2010
Our next pattern is called System Description Snapshot. The tool or component compiles the list of system properties and collections, like hardware resources, selected file names from file systems, registry and other configuration information. Two or several snapshots can be compared either visually or automatically to highlight state differences that help in troubleshooting, debugging and problem resolution.
- Dmitry Vostokov @ DumpAnalysis.org + TraceAnalysis.org -
Posted in DebugWare Patterns, Debugging, Escalation Engineering, Software Architecture, Software Engineering, Software Technical Support, Tools | No Comments »
Monday, November 22nd, 2010
Posted in Aesthetics of Memory Dumps, Announcements, Art, Baby Turing Series, Books, Bugtations, Cartoons, Crash Dump Analysis, Debugging, Fun with Crash Dumps, Fun with Debugging, Memory Space Art, Memory Visualization, Software Engineering | No Comments »
Friday, November 12th, 2010
Five volumes of cross-disciplinary Anthology (dubbed by the author “The Summa Memorianica”) lay the foundation of the scientific discipline of Memoretics (study of computer memory snapshots and their evolution in time) that is also called Memory Dump and Software Trace Analysis.ca
The 5th volume contains revised, edited, cross-referenced, and thematically organized selected DumpAnalysis.org blog posts about crash dump, software trace analysis and debugging written in February 2010 - October 2010 for software engineers developing and maintaining products on Windows platforms, quality assurance engineers testing software on Windows platforms, technical support and escalation engineers dealing with complex software issues, and security researchers, malware analysts and reverse engineers. The fifth volume features:
- 25 new crash dump analysis patterns
- 11 new pattern interaction case studies (including software tracing)
- 16 new trace analysis patterns
- 7 structural memory patterns
- 4 modeling case studies for memory dump analysis patterns
- Discussion of 3 common analysis mistakes
- Malware analysis case study
- Computer independent architecture of crash analysis report service
- Expanded coverage of software narratology
- Metaphysical and theological implications of memory dump worldview
- More pictures of memory space and physicalist art
- Classification of memory visualization tools
- Memory visualization case studies
- Close reading of the stories of Sherlock Holmes: Dr. Watson’s observational patterns
- Fully cross-referenced with Volume 1, Volume 2, Volume 3, and Volume 4
Product information:
- Title: Memory Dump Analysis Anthology, Volume 5
- Author: Dmitry Vostokov
- Language: English
- Product Dimensions: 22.86 x 15.24
- Paperback: 400 pages
- Publisher: Opentask (10 December 2010)
- ISBN-13: 978-1-906717-96-4
- Hardcover: 400 pages
- Publisher: Opentask (10 December 2010)
- ISBN-13: 978-1-906717-97-1

Back cover features memory space art image Hot Computation: Memory on Fire.
- Dmitry Vostokov @ DumpAnalysis.org + TraceAnalysis.org -
Posted in Aesthetics of Memory Dumps, Announcements, Archaeology of Computer Memory, Art, Assembly Language, Books, C and C++, CDF Analysis Tips and Tricks, Categorical Debugging, Common Mistakes, Complete Memory Dump Analysis, Computer Science, Crash Analysis Report Environment (CARE), Crash Dump Analysis, Crash Dump De-analysis, Crash Dump Patterns, Debugging, Debugging Methodology, Debugging Slang, Deep Down C++, Dr. Watson, Dublin School of Security, Education and Research, Escalation Engineering, Fun with Crash Dumps, Fun with Debugging, Fun with Software Traces, General Memory Analysis, Hermeneutics of Memory Dumps and Traces, Images of Computer Memory, Kernel Development, Malware Analysis, Malware Patterns, Mathematics of Debugging, Memiotics (Memory Semiotics), Memoidealism, Memoretics, Memory Analysis Culture, Memory Analysis Forensics and Intelligence, Memory Analysis Report System, Memory Diagrams, Memory Dreams, Memory Dump Analysis Jobs, Memory Dump Analysis Services, Memory Dump Analysis and History, Memory Dumps in Movies, Memory Dumps in Myths, Memory Religion (Memorianity), Memory Space Art, Memory Systems Language, Memory Visualization, Memory and Glitches, Memuonics, Metaphysical Society of Ireland, Minidump Analysis, Movies and Debugging, Multithreading, Museum of Debugging, Music for Debugging, Music of Computation, New Acronyms, New Words, Paleo-debugging, Pattern Models, Pattern Prediction, Philosophy, Physicalist Art, Psychoanalysis of Software Maintenance and Support, Publishing, Science of Memory Dump Analysis, Science of Software Tracing, Security, Software Architecture, Software Behavior Patterns, Software Chorography, Software Chorology, Software Defect Construction, Software Engineering, Software Generalist, Software Maintenance Institute, Software Narratology, Software Technical Support, Software Trace Analysis, Software Trace Analysis and History, Software Trace Deconstruction, Software Trace Reading, Software Trace Visualization, Software Tracing for Dummies, Software Troubleshooting Patterns, Software Victimology, Stack Trace Collection, Structural Memory Analysis and Social Sciences, Structural Memory Patterns, Structural Trace Patterns, Systems Thinking, Testing, Theology, Tool Objects, Tools, Trace Analysis Patterns, Training and Seminars, Troubleshooting Methodology, Uses of UML, Victimware, Virtualization, Vista, Visual Dump Analysis, Webinars, WinDbg Scripts, WinDbg Tips and Tricks, WinDbg for GDB Users, Windows 7, Windows Server 2008, Windows System Administration, Workaround Patterns, x64 Windows | No Comments »
Saturday, November 6th, 2010
I’m pleased to announce that MDAA, Volume 4 is available in PDF format:
www.dumpanalysis.org/Memory+Dump+Analysis+Anthology+Volume+4
It features:
- 15 new crash dump analysis patterns
- 13 new pattern interaction case studies
- 10 new trace analysis patterns
- 6 new Debugware patterns and case study
- Workaround patterns
- Updated checklist
- Fully cross-referenced with Volume 1, Volume 2 and Volume 3
- Memory visualization tutorials
- Memory space art
Its table of contents is available here:
http://www.dumpanalysis.org/MDAA/MDA-Anthology-V4-TOC.pdf
Paperback and hardcover versions should be available in a week or two. I also started working on Volume 5 that should be available in December.
- Dmitry Vostokov @ DumpAnalysis.org + TraceAnalysis.org -
Posted in .NET Debugging, Aesthetics of Memory Dumps, Announcements, AntiPatterns, Art, Assembly Language, Books, C and C++, CDF Analysis Tips and Tricks, Categorical Debugging, Common Mistakes, Complete Memory Dump Analysis, Computer Science, Countefactual Debugging, Crash Dump Analysis, Crash Dump Patterns, DebugWare Patterns, Debugging, Debugging Slang, Deep Down C++, Education and Research, Escalation Engineering, Fun with Crash Dumps, Fun with Debugging, Images of Computer Memory, Kernel Development, Memiotics (Memory Semiotics), Memoidealism, Memoretics, Memory Space Art, Memory Visualization, Memuonics, Metaphysics of Memory Worldview, Multithreading, Opcodism, Philosophy, Physicalist Art, Publishing, Science Fiction, Science of Memory Dump Analysis, Science of Software Tracing, Security, Software Architecture, Software Behavior Patterns, Software Defect Construction, Software Engineering, Software Narratology, Software Technical Support, Software Trace Analysis, Software Trace Reading, Software Victimology, Stack Trace Collection, Testing, Tools, Trace Analysis Patterns, Troubleshooting Methodology, Uses of UML, Victimware, Virtualization, Vista, Visual Dump Analysis, WinDbg Scripts, WinDbg Tips and Tricks, Windows 7, Windows Server 2008, Windows System Administration, Workaround Patterns, x64 Windows | No Comments »
Friday, October 29th, 2010
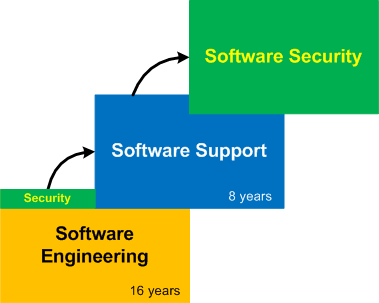
Having spent 16 years in software engineering I ventured into software support in 2003 (with 8th year started at the time of this writing). Now it is time for the next gradual shift into software security (the domain I previously had exposure to but not as a primary focus):
The title of this post is borrowed from the book I read from cover to cover long time ago and recently put on my desk again:
Journey of the Software Professional: The Sociology of Software Development

- Dmitry Vostokov @ DumpAnalysis.org + TraceAnalysis.org -
Posted in Announcements, Books, Dublin School of Security, History, Memory Analysis Forensics and Intelligence, Software Engineering, Software Technical Support | 4 Comments »
Wednesday, October 13th, 2010
I now transition to 8 similar to 7-to-8 transition from user to kernel space (new dialectical quality):
switch(years_at_citrix)

{

  case 5:

  write_blog_post(”I’ve just passed 5 year mark … “);

  wait_for_certificate();

  write_blog_post(”Shortly after celebrating 5 years … “);

  break;

  case 6:

  write_blog_post(”Threads in my process run very fast. Not long ago … “);

  break;

  case 7:

  write_blog_post(”Transition to kernel mode and space … “);

  break;

  case 8:

  // … TBD
}
I also abandoned monthly counting started earlier because in kernel space time is counted in clock cycles per quantum unit where the latter is 1/3 of a clock tick (Windows Internals, 5th edition, pp. 406 - 408) :-)
- Dmitry Vostokov @ DumpAnalysis.org + TraceAnalysis.org -
Posted in Announcements, Citrix, Crash Dump Analysis, Debugging, Escalation Engineering, History, Software Architecture, Software Engineering, Software Technical Support, Software Trace Analysis, Tools | No Comments »
Tuesday, October 5th, 2010
The choice of webinars below mostly reflects my personal preferences and long time desire to speak on topics like systems thinking, troubleshooting tool design and development. The other topic about BSOD minidump analysis was requested by participants in an ongoing survey. There will be more topics in 2011. All forthcoming webinars will be hosted by Memory Dump Analysis Services. The planning list includes:
Systems Thinking in Memory Dump and Software Trace Analysis
Software Troubleshooting and Debugging Tools: Objects, Components, Patterns and Frameworks with UML
- UML basics
- DebugWare patterns
- Unified Troubleshooting Framework
- RADII software development process
- Hands-on exercise: designing and building a tool
Blue Screen Of Death Analysis Done Right: Minidump Investigation for System Administrators
- Making sense of !analyze –v output
- Get extra troubleshooting information with additional WinDbg commands
- Guessing culprits with raw stack analysis
- Who’s responsible: hardware or software?
- Checklist and patterns
- Including hands-on exercises: send your own minidumps
More detailed information will be available soon.
- Dmitry Vostokov @ DumpAnalysis.org + TraceAnalysis.org -
Posted in Announcements, CDF Analysis Tips and Tricks, Common Mistakes, Common Questions, Crash Analysis Report Environment (CARE), Crash Dump Analysis, Crash Dump De-analysis, Crash Dump Patterns, Crash Dumps for Dummies, DebugWare Patterns, Debugging, Debugging Industry, Debugging Methodology, Escalation Engineering, General Memory Analysis, Hermeneutics of Memory Dumps and Traces, Memory Systems Language, Minidump Analysis, Software Architecture, Software Behavior Patterns, Software Engineering, Software Technical Support, Software Trace Analysis, Software Tracing for Dummies, Structural Memory Patterns, Systems Thinking, Tools, Trace Analysis Patterns, Training and Seminars, Troubleshooting Methodology, Vista, Webinars, WinDbg Tips and Tricks, Windows 7, Windows Server 2008, Windows System Administration, x64 Windows | No Comments »
Monday, October 4th, 2010
The first bugtation where the source book title and the chapter number and name were bugtated too:
The engineer who has no tincture for memory dump analysis goes through life cycle imprisoned in the prejudices derived from coding… (The Problems of Computation. Chapter 0x5: The Value of Memory Dump Analysis)
Bertrand Russell, The Problems of Philosophy, Chapter XV: The Value of Philosophy
- Dmitry Vostokov @ DumpAnalysis.org + TraceAnalysis.org -
Posted in Bugtations, Crash Dump Analysis, Fun with Crash Dumps, Philosophy, Software Engineering | No Comments »
Sunday, July 18th, 2010

Memory Dump Analysis Services (DumpAnalysis.com) organizes a free webinar
Date: 18th of August 2010
Time: 21:00 (BST) 16:00 (Eastern) 13:00 (Pacific)
Duration: 90 minutes
Topics include:
- User vs. kernel vs. physical (complete) memory space
- Challenges of complete memory dump analysis
- Common WinDbg commands
- Patterns
- Common mistakes
- Fiber bundles
- Hands-on exercise: a complete memory dump analysis
- A guide to DumpAnalysis.org case studies
Prerequisites: working knowledge of basic user process and kernel memory dump analysis or live debugging using WinDbg
The webinar link will be posted before 18th of August on DumpAnalysis.com
- Dmitry Vostokov @ DumpAnalysis.org + TraceAnalysis.org -
Posted in Announcements, Common Mistakes, Common Questions, Complete Memory Dump Analysis, Crash Dump Analysis, Crash Dump Patterns, Debugging, Escalation Engineering, Memory Dump Analysis Services, Pattern Models, Security, Software Architecture, Software Behavior Patterns, Software Defect Construction, Software Engineering, Software Technical Support, Stack Trace Collection, Testing, Tools, Training and Seminars, Troubleshooting Methodology, Virtualization, Vista, Webinars, WinDbg Scripts, WinDbg Tips and Tricks, Windows 7, Windows Server 2008, Windows System Administration, x64 Windows | 1 Comment »
Sunday, July 11th, 2010
Our future sponsor has been registered in Ireland and has its own independent website and logo: DumpAnalysis.com

More information will be available later this month.
- Dmitry Vostokov @ DumpAnalysis.org + TraceAnalysis.org -
Posted in Announcements, Crash Analysis Report Environment (CARE), Crash Dump Analysis, Crash Dump De-analysis, Debugging, Education and Research, Escalation Engineering, Hardware, Kernel Development, Linux Crash Corner, Mac Crash Corner, Memory Analysis Forensics and Intelligence, Memory Dump Analysis Services, Minidump Analysis, Security, Software Engineering, Software Technical Support, Software Trace Analysis, Testing, Tools, Training and Seminars, Vista, Windows 7, Windows Server 2008, Windows System Administration, x64 Windows | No Comments »
Saturday, July 10th, 2010
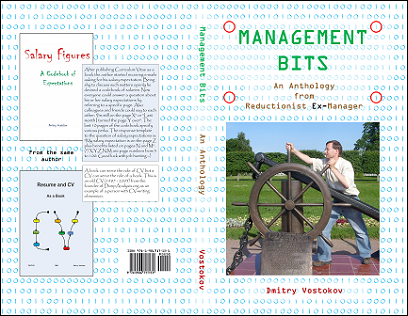
Being a software engineer, the author penetrated a software technical support department of a major software company rising to a management position. There he started collecting various management bits and tips promising everyone to write a management book. After moving back to engineering he became a director of several software research, education, publishing and software behavior analysis consultancy institutions including a museum. This book is an anthology of selected and edited blog posts from his Management Bits and Tips blog.
What this book has to do with the crash dump analysis then? Considering metaphorically an organization as a software machine, teams as processes and individuals as threads the author had applied his unique knowledge of software crashes and hangs to organizational project failures.
- Title: Management Bits: An Anthology from Reductionist Manager
- Author: Dmitry Vostokov
- Publisher: OpenTask (September 2010)
- Language: English
- Product Dimensions: 19.8 x 12.9
- Paperback: 100 pages
- ISBN-13: 978-1906717131
- Dmitry Vostokov @ DumpAnalysis.org + TraceAnalysis.org -
Posted in Announcements, Books, Crash Dump Analysis, Crash Dump Patterns, Escalation Engineering, Fun with Crash Dumps, Management Bits and Tips, Publishing, Software Engineering, Software Technical Support | No Comments »
Wednesday, July 7th, 2010
The rules of the previously announced competition have been changed. You can now also nominate someone by sending a debugging story link. Please send your story or a nomination using this page: http://www.dumpanalysis.org/contact or dmitry dot vostokov at dumpanalysis dot org (if a story is with pictures).

- Dmitry Vostokov @ DumpAnalysis.org + TraceAnalysis.org -
Posted in Announcements, Competitions and Awards, Crash Dump Analysis, Debugging, Escalation Engineering, Security, Software Engineering, Software Technical Support | No Comments »