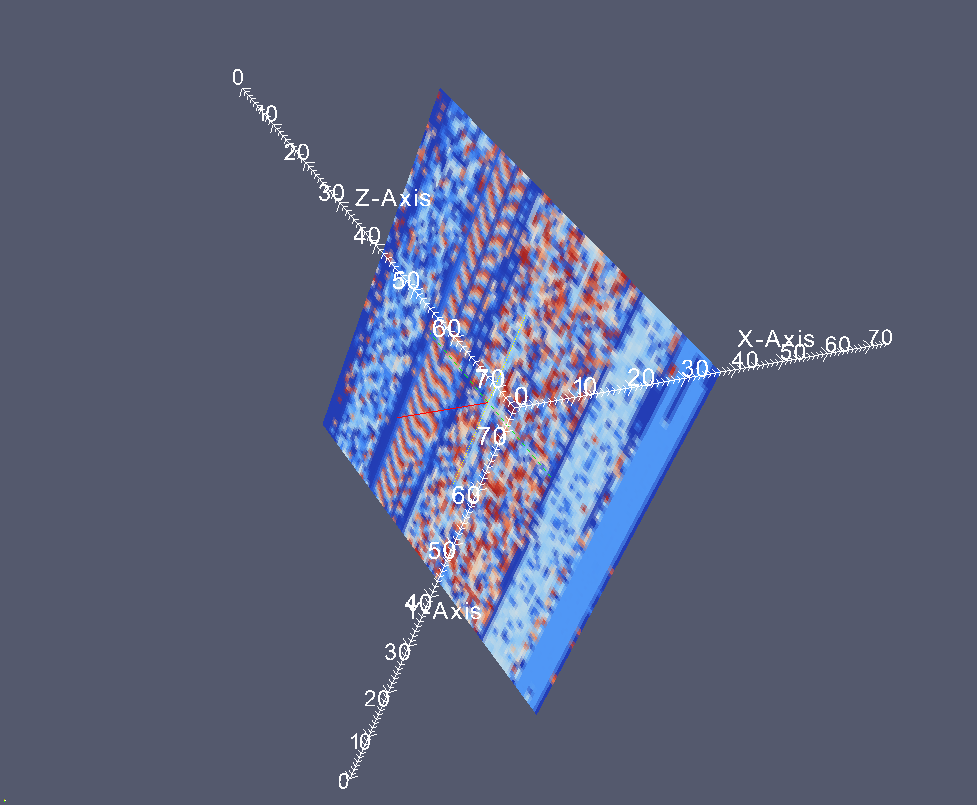
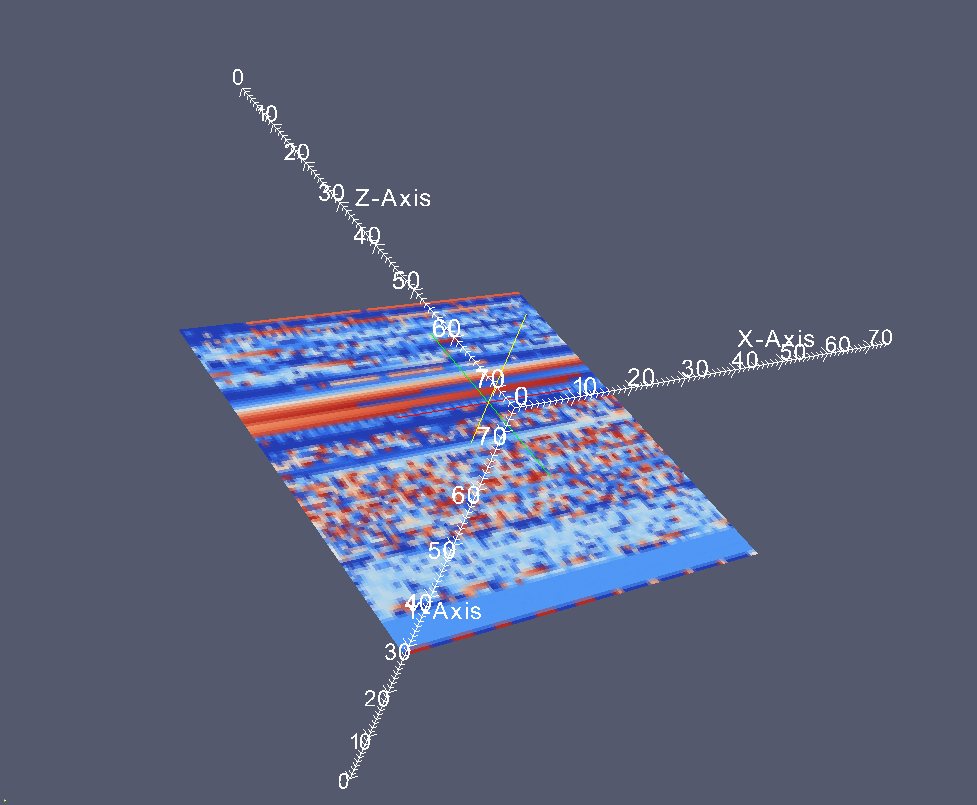
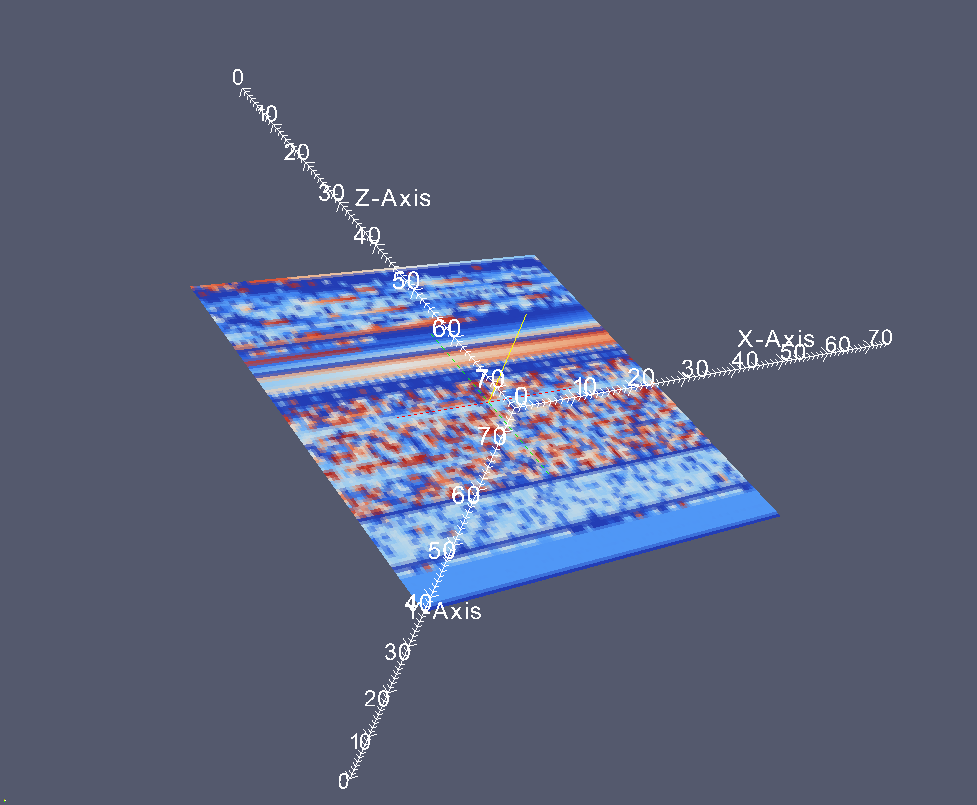
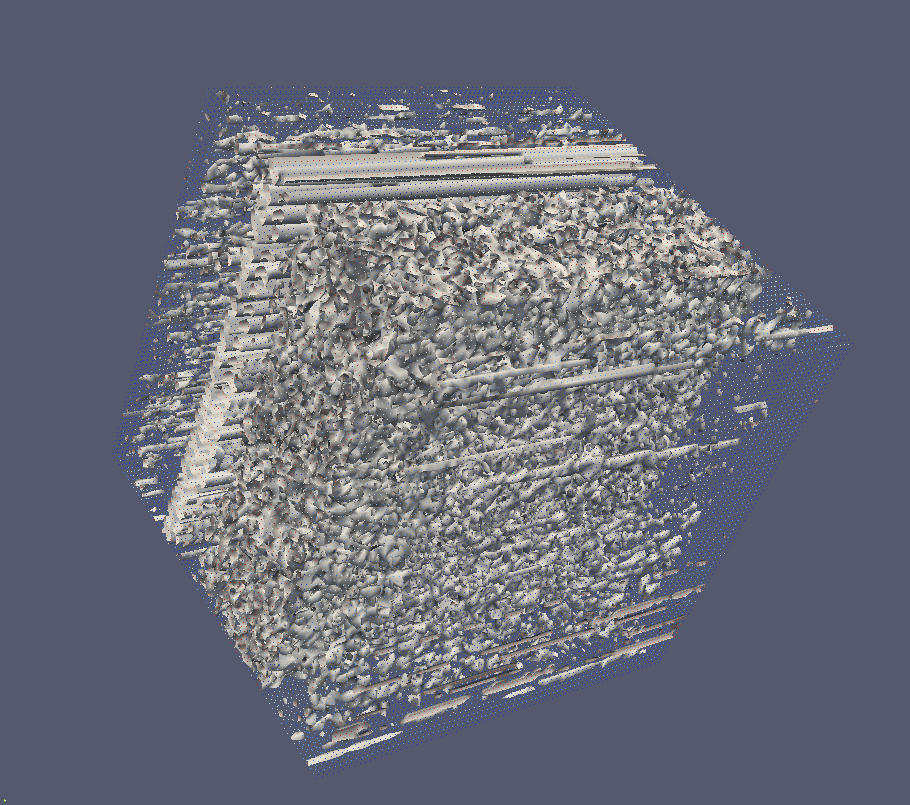
3D Memory Visualization
Finally I realized this morning that in addition to folding of a linear memory space into a 2D image in ParaView, the so called DLL List Landscape, we can also do a 3D folding too. I used the same dump file but this time the formula for coordinates is:
(file_size/4)1/3
so for 1,746,853 byte file we have a 3D map of 75×75x75 points. Here are some beautiful images (click on them for a larger view) that I got and I write next parts of advanced memory visualization tutorial later next week.
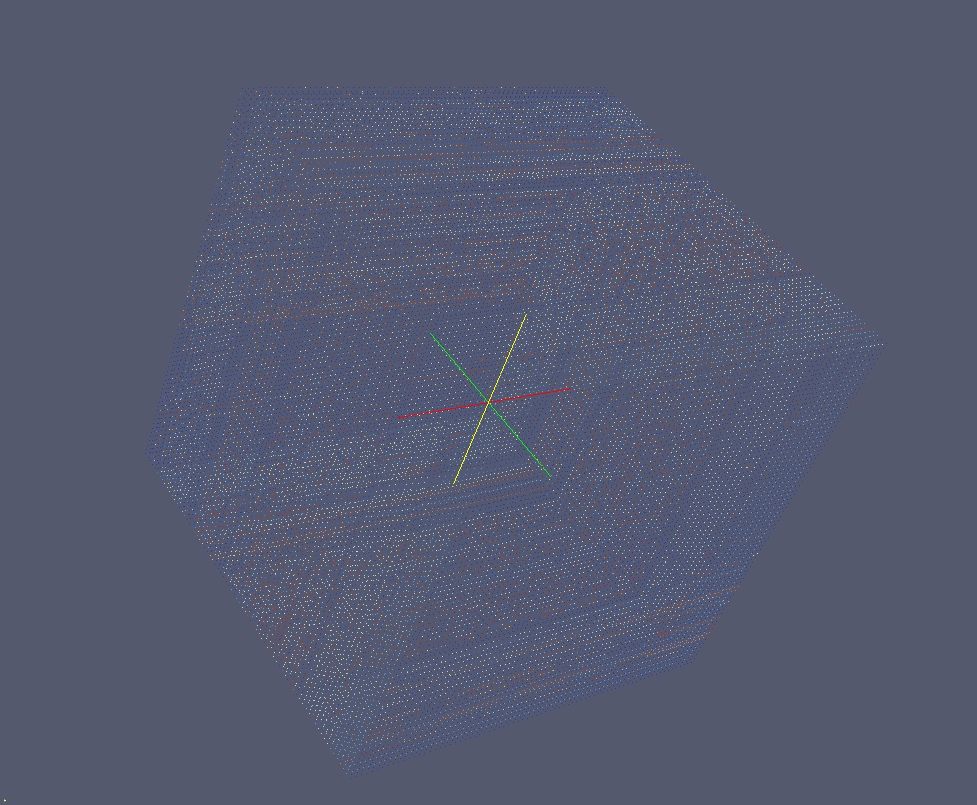
Point view
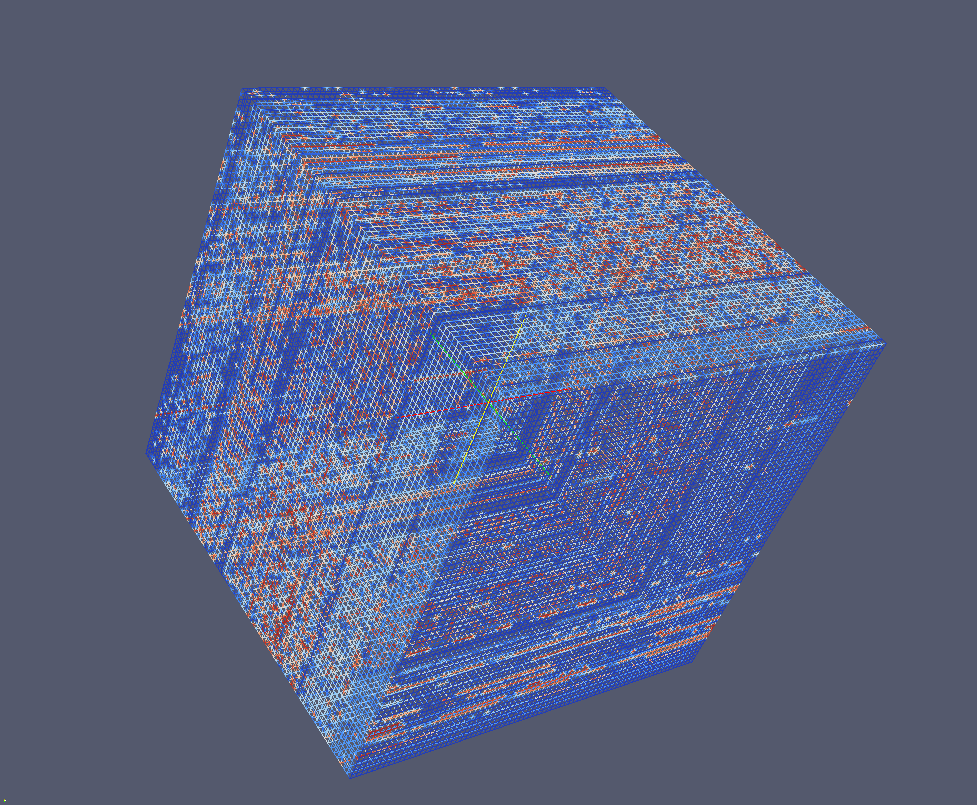
Wireframe view
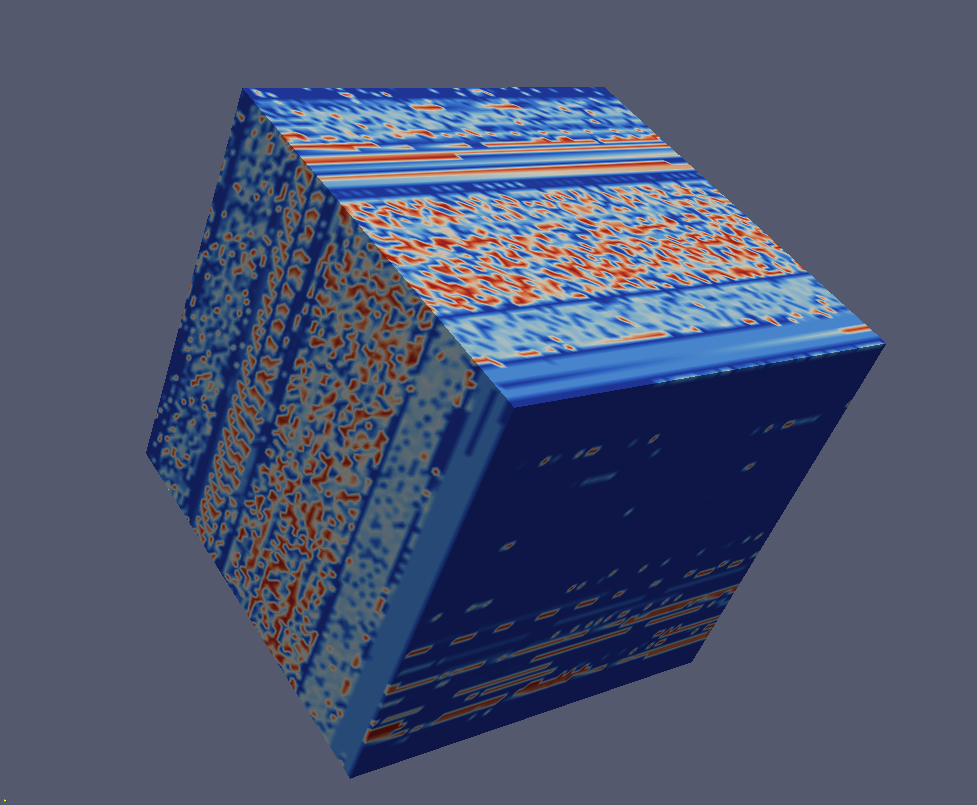
Surface view
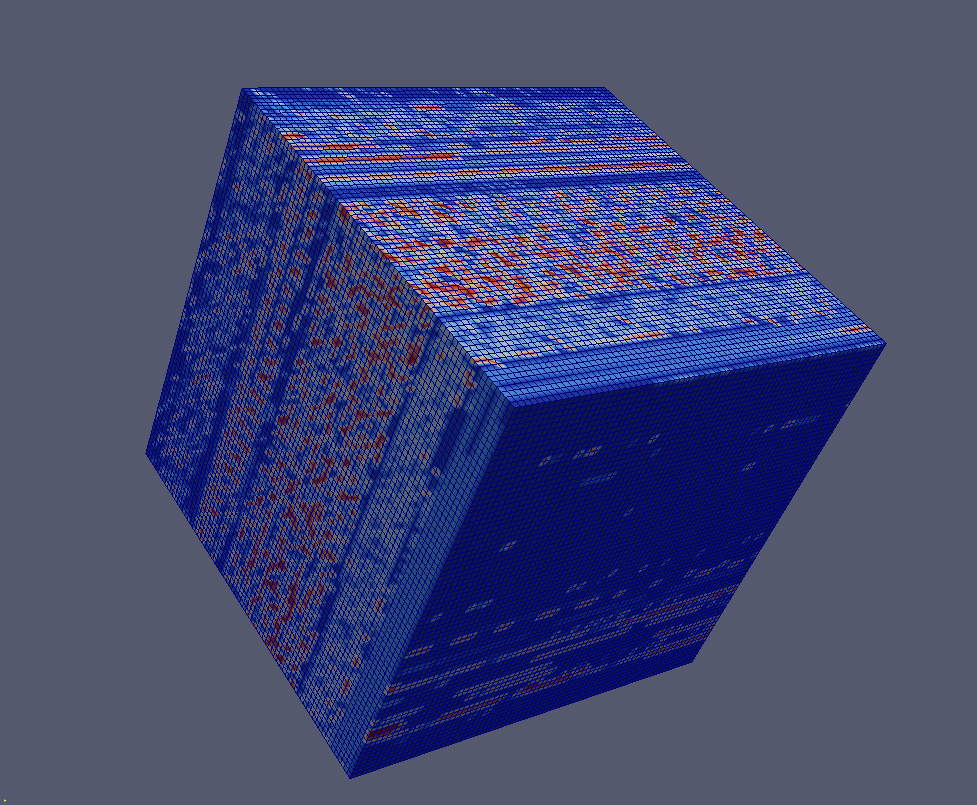
Surface + edges view
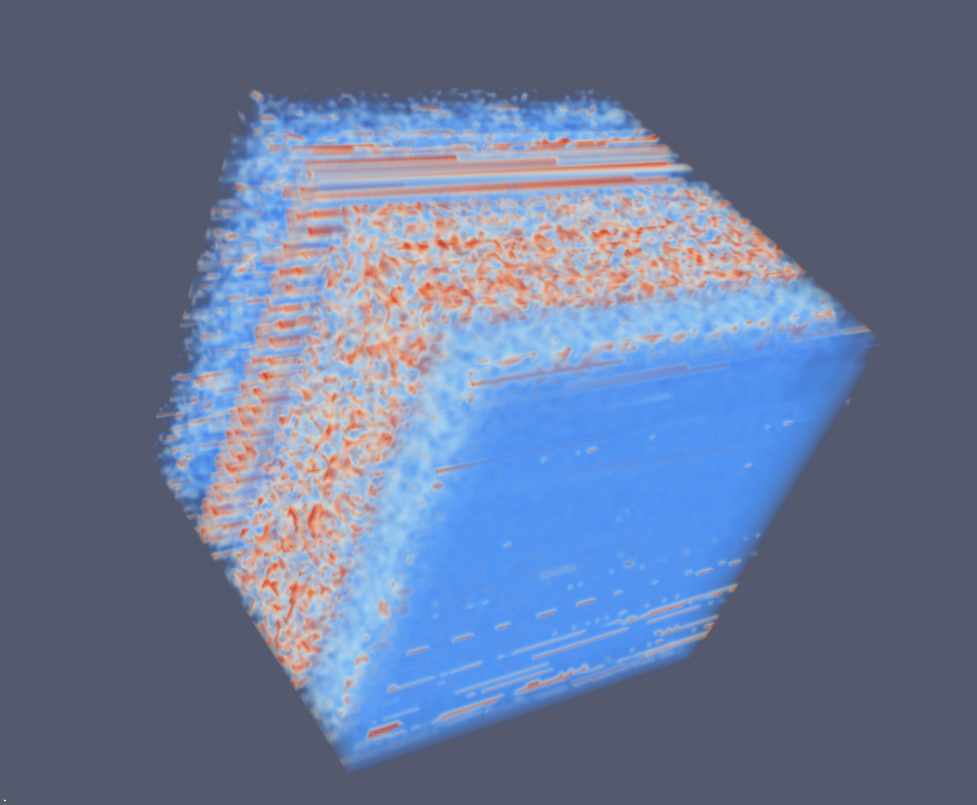
Volume view
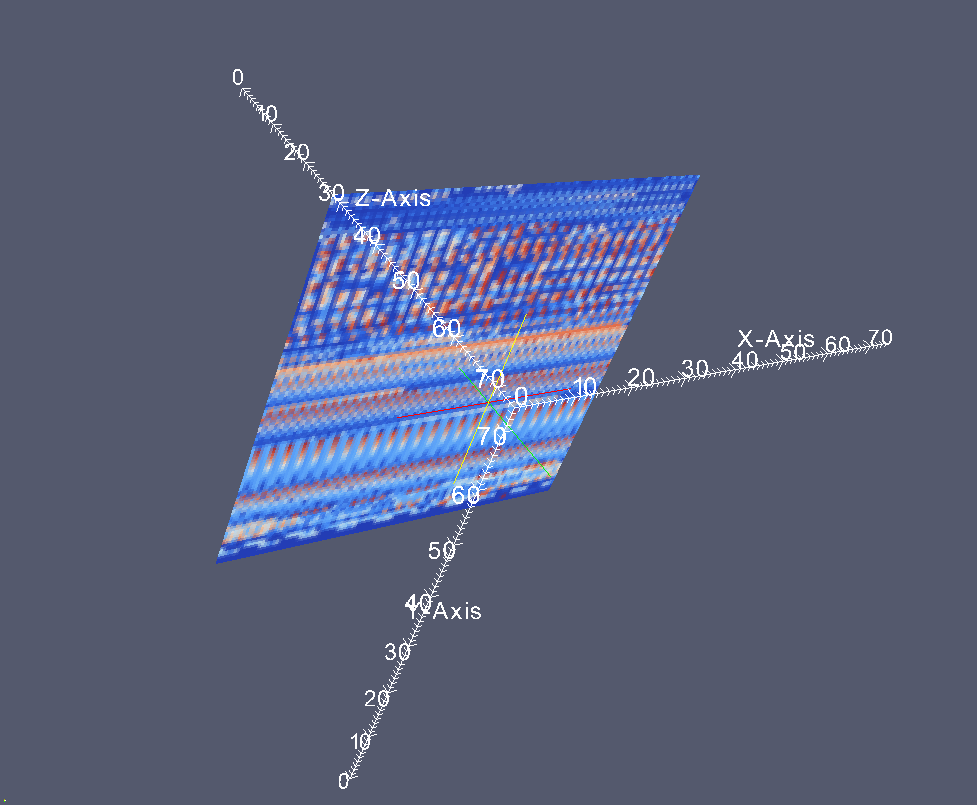
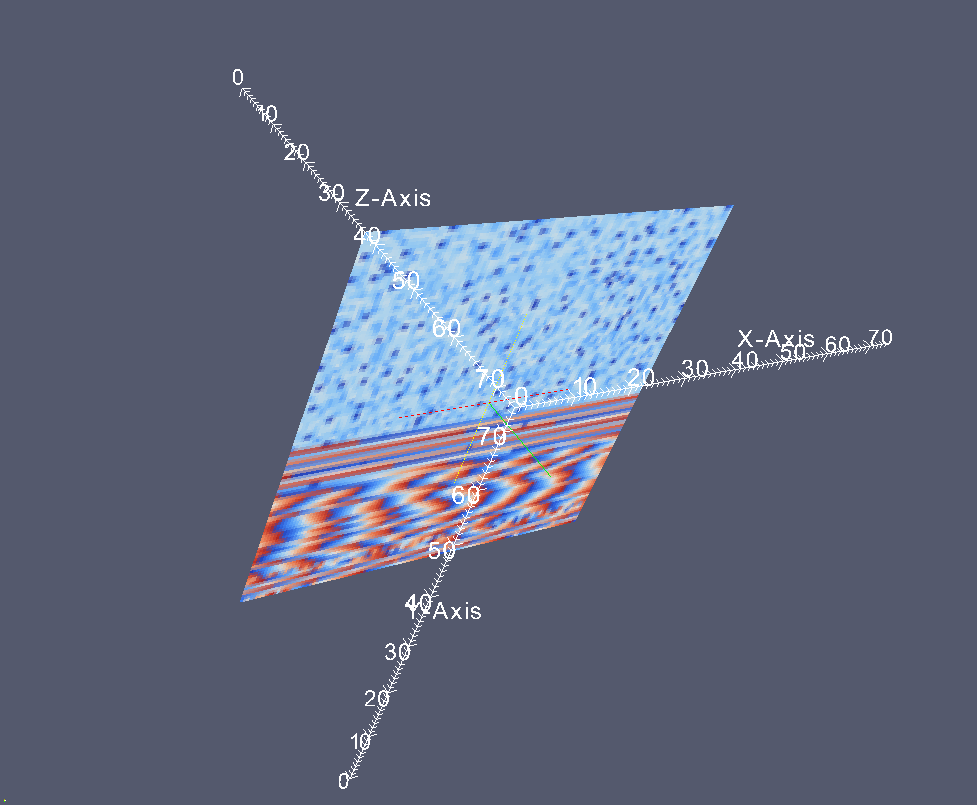
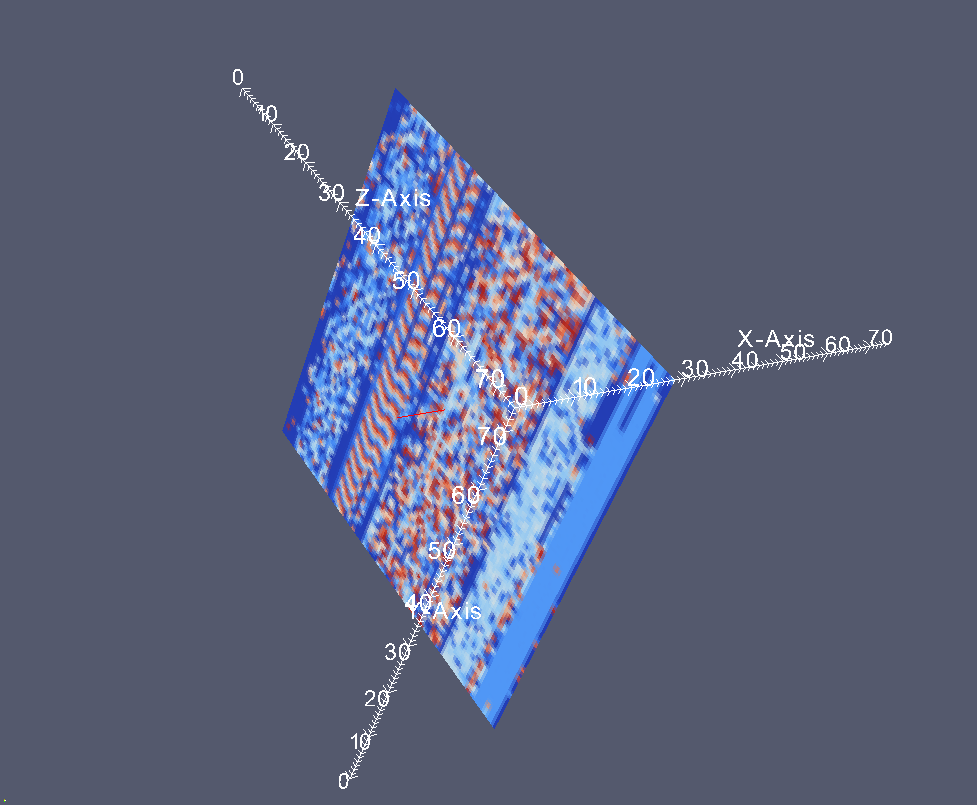
The chosen 3D folding shows varying 2D landscape in XY plane but almost constant landscape in YZ and XZ slices:
More effects.
Contour view
Process DNA view

- Dmitry Vostokov @ DumpAnalysis.org -
July 19th, 2009 at 4:04 pm
Wow - that is awesome stuff Dmitry. I will have to look that system over and see how suitable it would be for a more generalized memory (and dynamic behavior) visualizer.
I plan on having HayWire ready later today - although I am encouraged to out-do Para-View - HayWire already a bit over-due, so I will wait until later to attack memory dumping with DirectX3D hammer and tongs.
I will let you know when you are good to go.
July 19th, 2009 at 4:52 pm
July 19th, 2009 at 10:44 pm
ParaView has been around for several years, and it’s used quite extensively in the DOD & DOE spaces for large-scale data visualization thanks to its extensive support for clusters and parallel systems.
It would be nice, tho, if you could show some real applications of what you’re doing. It looks pretty and all, but I’m not seeing any real use of it.
Feel free to contact us at VizWorld.
July 20th, 2009 at 12:24 pm
My long-term goal is to do memory dump analysis, debugging and troubleshooting visually, using a tomography metaphor that inspired me almost 3 years ago:
http://www.dumpanalysis.org/blog/index.php/2006/10/22/dump-tomography/
So it might take some time until some real applications emerge, I just started learning this 3D and 2D visualization and create tutorials along my way to document my findings. A year ago I came with colouring memory areas, for example:
http://www.dumpanalysis.org/blog/index.php/2008/04/16/computer-colometric-memory-dating-part-1/
and dynamic heap visualization:
http://www.dumpanalysis.org/blog/index.php/2007/08/12/visualizing-memory-leaks/
One of ideas here that came to my mind after playing with ParaView is to combine dump images with externally collected data, I try to elaborate on this later.
Thanks,
Dmitry
July 21st, 2009 at 7:23 am
I now have a version which captures the samples produced by HayWire into a shared memory area, which are then picked up by special filters that re-inject the samples into other DirectShow graphs. This lets me bring up and down recording and playback without changing the basic data flow through the system. And I can “Glue” this into most media player programs since one of the filters pretends its a big webcam.
It should be easy to make a non-VMR rendering window for you, Dmitry, (although a big reason I did this was to be able to flow more through DirectX 3D eventually).
If nothing else, I may qualify for the Guiness Record for Most Over-engineered Novelty Program Ever.
July 22nd, 2009 at 5:45 am
Its Finally Up For Downloading
Jamie Fenton’s Real-time memory dump visualization program has been released for early Beta testing and can be downloaded from:
http://www.seductivelogic.com/index.html
Dmitry - please help let the world know about this - and thank you for providing encouragement and inspiration. — Jamie F.
July 23rd, 2009 at 9:41 am
Great! Will announce later today. Thank you, Dmitry
January 14th, 2010 at 12:49 am
[…] of 3D computer memory visualization […]
April 29th, 2010 at 9:56 pm
[…] and 3D visualization using general-purpose tools like […]