Advanced Memory Visualization (Part 1)
Forthcoming Webinar on Pattern-Driven Software Diagnostics
2012 - The Year of Software Trace Analysis
Accelerated Memory Dump Analysis Training
Sponsored link: Memory Dump Analysis Services
Debugging Experts Magazine Online
Debugging Today Daily Newspaper
In this part we see how we can load memory dumps into ParaView data analysis and visualization system. First we need to download the latest version from here. If we have a memory dump we need first to calculate its dimensions and for a square we can use this simple formula: (int)sqrt(file_size/4). For example, the dump file I use here has the size of 1,746,853 bytes, therefore we have 660×660.
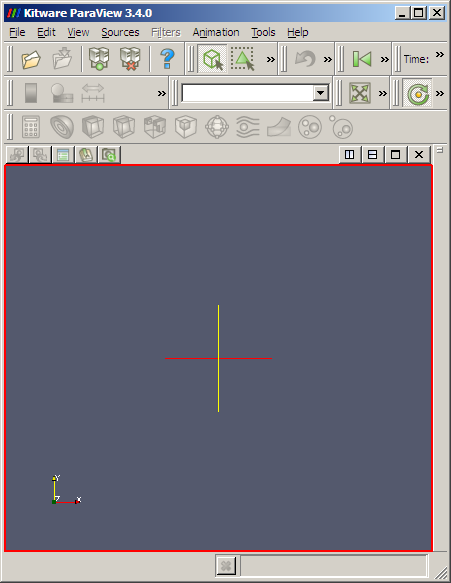
1. Launch ParaView:

2. Go to File \ Open and select All Files (*.*) and choose your .dmp file. The following dialog appears:

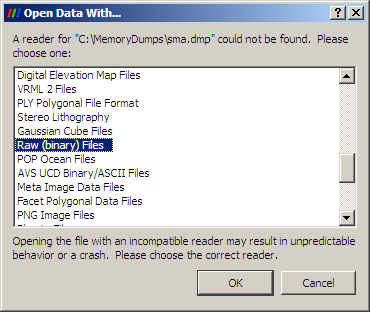
Choose Raw (binary) Files option.
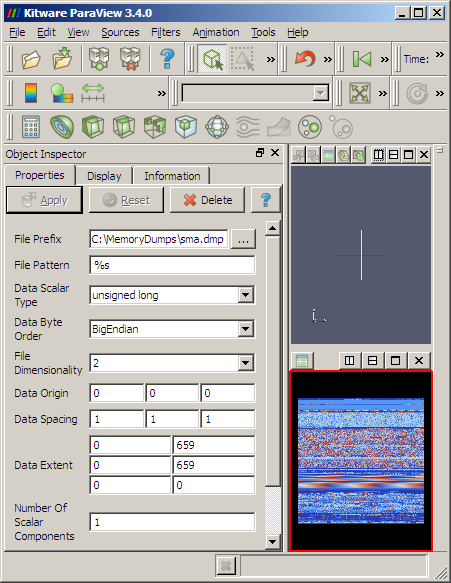
3. If nothing changes on the screen go to View menu and select Object Inspector. The following panel should appear:

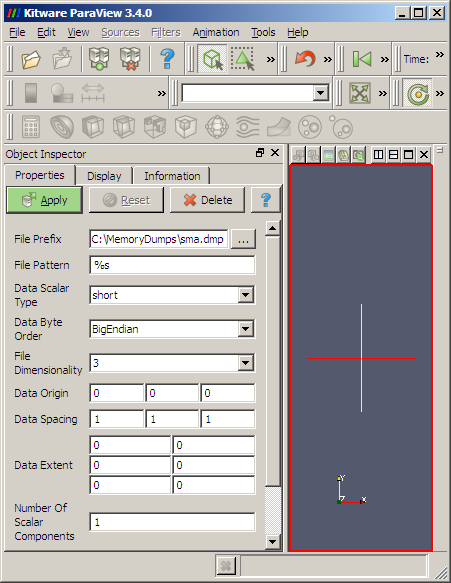
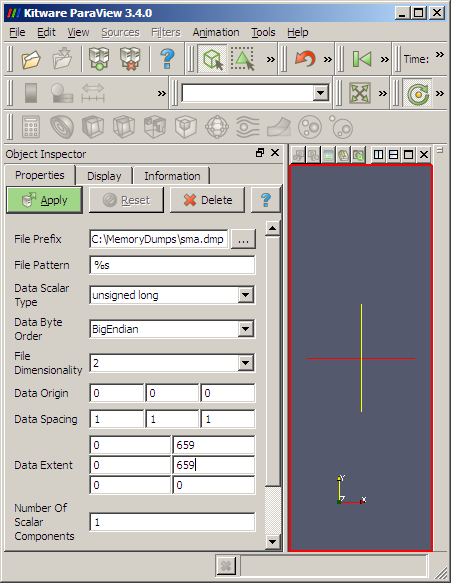
4. Here we should carefully specify parameters for our dump file:
Data Scalar Type: unsigned long
File Dimensionality: 2
Data Extent:
0 659
0 659

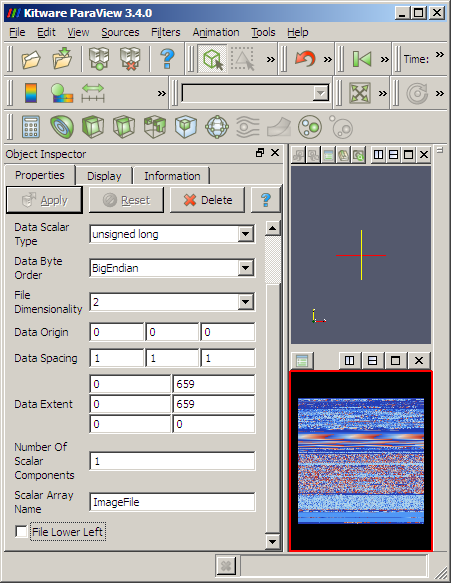
5. We then Apply and get the dump loaded:

6. We might want to uncheck File Lower Left at the bottom of the Object Inspector properties to get lower memory addresses start from the left-top corner of the image:

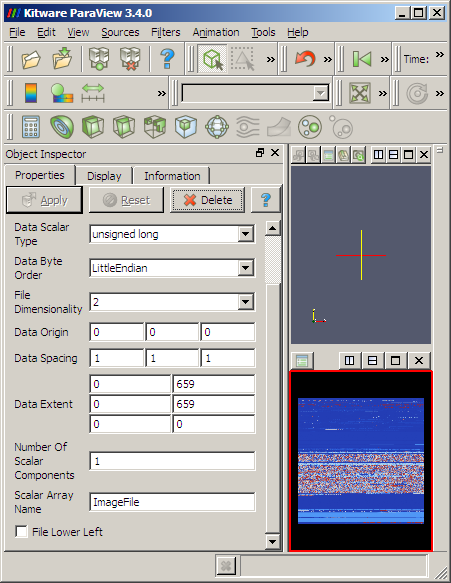
7. Also Data Byte Order LittleEndian obviously changes the color of RGB triplets or RGBA quadruplets but the large scale structure remains the same:

8. We can select View \ Show Color Legend to see how unsigned long values from the dump file are mapped continuously to colors:

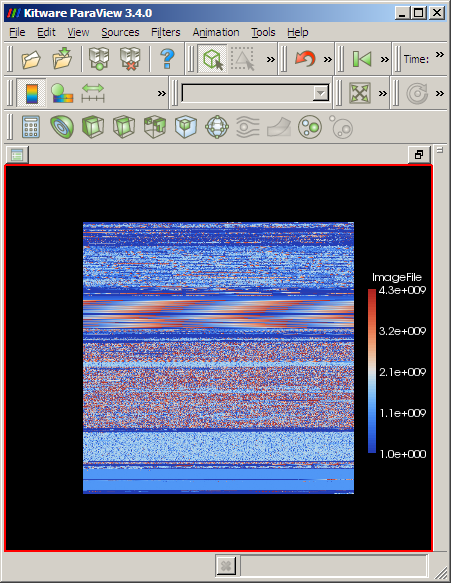
I prefer to choose BigEndian because we get similar layout as we get from ImageMagick RGBA conversion or from Dump2Picture:


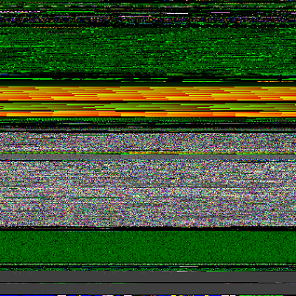
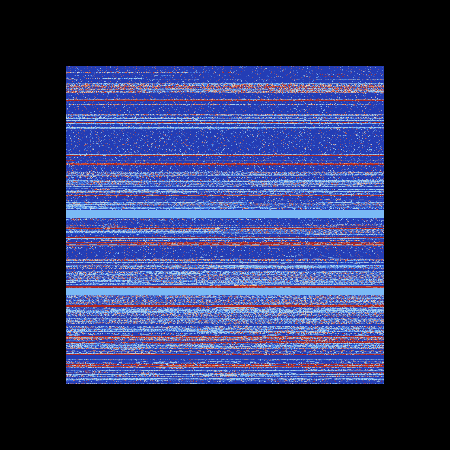
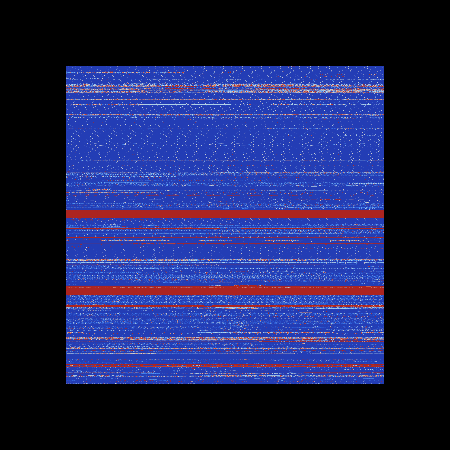
9. ParaView can even load large dumps, for example, this is a screenshot of 1.5Gb dump in big endian and little endian byte orderings respectively:


- Dmitry Vostokov @ DumpAnalysis.org -
Sponsored link: Professional Software Debugging Services
/* Malware and Software Defects -> Victimware.org */
Copyright © 2006 - 2012. This is a non-profit research and scientific project.
_1125.png)
Citrix and Microsoft Customer Forum
Museum of Debugging and Memory Dumps
7/7/2011 - 8/8/2011 Annual Competition: Tell Your Windows Debugging Story
Crash and Hang Analysis Audit Service
CARE: Crash Analysis Report Environment
Crash Dump and Software Trace Analysis Training and Seminars
Access OpenTask Titles on Safari Books Online
DATA (Dump Analysis + Trace Analysis) Facebook group
Please join the community of memory (dump) and trace analysis engineers. This group promotes scientific methods and memory dump-based worldview.
Twitter @ DumpAnalysis You can now follow portal and blog news at DumpAnalysis on Twitter
LinkedIn Group Dr. Watson Enthusiasts All about Dr. Watson errors and more. Get news, excerpts and progress reports about the forthcoming book The Science of Dr. Watson: An Illustrated History of Debugging (ISBN 978-1906717070)
2010 (0x7DA) - The Year of Dump Analysis 2011 (0x7DB) - 2020 (0x7E4) The Debugging Decade
International Memory Analysts and Debuggers Day: 07.07 and/or 08.08 starting from The Year of Dump Analysis, 2010, 7DA
AnnouncementsComing Soon:
Fundamentals of Complete Crash and Hang Memory Dump Analysis
Management Bits: An Anthology from Reductionist Manager
Crash Dump Analysis for System Administrators and Support Engineers
New Magazines:
Debugged! MZ/PE: MagaZine for/from Practicing Engineers
New Books:
Introduction to Pattern-Driven Software Problem Solving
Memory Dump Analysis Anthology: Color Supplement for Volumes 4-5
Windows Debugging Notebook: Essential User Space WinDbg Commands
Memory Dump Analysis Anthology, Volume 5
Memory Dump Analysis Anthology, Volume 4
Memory Dump Analysis Anthology: Color Supplement for Volumes 1-3
Memory Dump Analysis Anthology, Volume 3
First Fault Software Problem Solving: A Guide for Engineers, Managers and Users
x64 Windows Debugging: Practical Foundations
Also available:
Windows Debugging: Practical Foundations
DLL List Landscape: The Art from Computer Memory Space
Dumps, Bugs and Debugging Forensics: The Adventures of Dr. Debugalov
WinDbg: A Reference Poster and Learning Cards
Memory Dump Analysis Anthology, Volume 2
Memory Dump Analysis Anthology, Volume 1
New Children's Book:


July 14th, 2009 at 7:45 pm
[…] Crash Dump Analysis » Blog Archive » Advanced Memory Visualization (Part 1) […]
July 19th, 2009 at 2:48 pm
[…] I realized this morning that in addition to folding of a linear memory space into a 2D image in ParaView, the so called DLL List Landscape, we can also do a 3D folding too. I used the same dump file but […]
April 29th, 2010 at 1:38 pm
[…] 2D and 3D visualization using general-purpose tools like ParaView. […]