Icons for Memory Dump Analysis Patterns (Part 24)
Wednesday, April 14th, 2010Today we introduce an icon for Insufficient Memory (kernel pool) pattern:
B/W
![]()
Color
![]()
- Dmitry Vostokov @ DumpAnalysis.org + TraceAnalysis.org -
Today we introduce an icon for Insufficient Memory (kernel pool) pattern:
B/W
![]()
Color
![]()
- Dmitry Vostokov @ DumpAnalysis.org + TraceAnalysis.org -
Time flows fast and I have refined my code I wrote at 6 year anniversary to include finer monthly tracing:
switch (months_at_citrix)

{

  case 60:

    write_blog_post(”I’ve just passed 5 year mark … “);

    wait_for_certificate();

    write_blog_post(”Shortly after celebrating 5 years … “);

    break;

  case 72:

    write_blog_post(”Threads in my process run very fast. Not long ago … “);

    break;

  case 78:

    write_blog_post(”Time flows fast and I have refined my code …“);

    break;

case 84:

    // … TBD

}
- Dmitry Vostokov @ DumpAnalysis.org + TraceAnalysis.org -
Do you see my thread of thought? Tender ≈ easily crushed, so a tender button can easily crash or can be easily cr(a)ushed. When I saw the title of a book “Tender Buttons” I immediately recalled TestDefaultDebugger and similar programs. Apartment is from COM lexicon.
Tender buttons that crash: objects, messages, apartments.
- Dmitry Vostokov @ DumpAnalysis.org + TraceAnalysis.org -
.SYS - Sponsor YourSelf or Sponsor YourSelves.
Examples: I’m developing a fantastic project.SYS
- Dmitry Vostokov @ DumpAnalysis.org + TraceAnalysis.org -
Today we introduce an icon for Insufficient Memory (handle leak) pattern:
B/W
![]()
Color
![]()
- Dmitry Vostokov @ DumpAnalysis.org + TraceAnalysis.org -
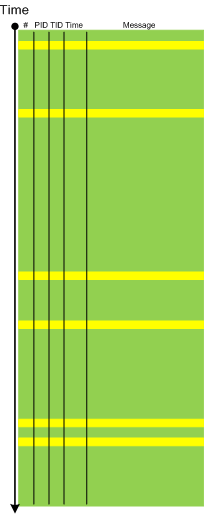
When a software trace is lengthy it is useful to partition it into several regions based on a sequence of Anchor Messages. The choice of them can be determined by a Vocabulary Index or an Adjoint Thread of Activity. For example, an ETW trace with almost 900,000 messages recorded during a desktop connection for 6 minutes can be split into 14 segments by the adjoint thread of DLL_PROCESS_ATTACH message (the message was generated by DllMain of an injected module, not shown in the trace output for formatting clarity):
#      PID  TID  Time         Message

24226  2656 3480 10:41:05.774 AppA.exe: DLL_PROCESS_ATTACH

108813 4288 4072 10:41:05.774 AppB.exe: DLL_PROCESS_ATTACH

112246 4180 3836 10:41:05.940 DllHost.exe: DLL_PROCESS_ATTACH

135473 2040 3296 10:41:12.615 AppC.exe: DLL_PROCESS_ATTACH

694723 1112 1992 10:44:23.393 AppD.exe: DLL_PROCESS_ATTACH

703962 5020 1080 10:44:42.014 DllHost.exe: DLL_PROCESS_ATTACH

705511 4680 3564 10:44:42.197 DllHost.exe: DLL_PROCESS_ATTACH

705891 1528 2592 10:44:42.307 regedit.exe: DLL_PROCESS_ATTACH

785231 2992 4912 10:45:26.516 AppE.exe: DLL_PROCESS_ATTACH

786523 3984 1156 10:45:26.605 powershell.exe: DLL_PROCESS_ATTACH

817979 4188 4336 10:45:48.707 wermgr.exe: DLL_PROCESS_ATTACH

834875 3976 1512 10:45:52.342 LogonUI.exe: DLL_PROCESS_ATTACH

835229 4116 3540 10:45:52.420 AppG.exe: DLL_PROCESS_ATTACH
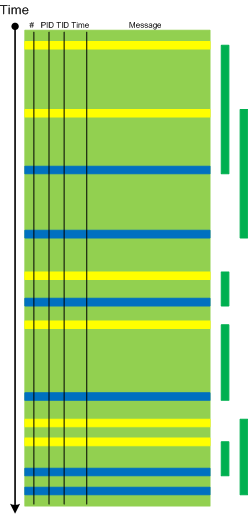
Each region can be analyzed independently for any anomalies, for example, to look for the answer to the question why wermgr.exe was launched. An example of partitioning is illustrated on the following schematic diagram:
It is also possible to make another trace segmentation by interleaving regions above with another set of anchor messages comprising of the adjoint thread of DLL_PROCESS_DETACH message:
- Dmitry Vostokov @ DumpAnalysis.org + TraceAnalysis.org -
Today we introduce an icon for Insufficient Memory (committed memory) pattern:
B/W
![]()
Color
![]()
- Dmitry Vostokov @ DumpAnalysis.org + TraceAnalysis.org -
Comments in italics are mine and express my own views, thoughts and opinions
Windows Internals by M. Russinovich, D. Solomon and A. Ionescu:
Hard CPU limits per-session, -user and -system (pp. 444-445)
Security and user-interface limits on jobs (p. 447)
job objects (pp. 447 - 450) - we can dump all processes via !process 0 1 command and look for “Job ” in the output as on my x64 W2K8 system:
1: kd> !process 0 1
PROCESS fffffa8004e28c10

SessionId: 1  Cid: 0a70    Peb: 7fffffd8000  ParentCid: 09ec

DirBase: 93cfb000  ObjectTable: fffff88008ec2a20  HandleCount: 405.

Image: MSASCui.exe

VadRoot fffffa8004de0390 Vads 106 Clone 0 Private 1932. Modified 352. Locked 0.

DeviceMap fffff88008479c90

Token                             fffff88008edb060

ElapsedTime                       00:03:15.554

UserTime                          00:00:00.000

KernelTime                        00:00:00.000

QuotaPoolUsage[PagedPool]         197440

QuotaPoolUsage[NonPagedPool]      21728

Working Set Sizes (now,min,max)  (3259, 50, 345) (13036KB, 200KB, 1380KB)

PeakWorkingSetSize                3259

VirtualSize                       96 Mb

PeakVirtualSize                   96 Mb

PageFaultCount                    5245

MemoryPriority                    BACKGROUND

BasePriority                      8

CommitCharge                      2214

    Job                               fffffa80050f8860
PROCESS fffffa800511b260

SessionId: 1  Cid: 0a78    Peb: 7fffffd3000  ParentCid: 09ec

DirBase: 93dcb000  ObjectTable: fffff880089d4ae0  HandleCount: 128.

Image: wmdSync.exe

VadRoot fffffa800511aba0 Vads 77 Clone 0 Private 436. Modified 0. Locked 0.

DeviceMap fffff88008479c90

Token                             fffff88008ee1060

ElapsedTime                       00:03:15.429

UserTime                          00:00:00.000

KernelTime                        00:00:00.000

QuotaPoolUsage[PagedPool]         150088

QuotaPoolUsage[NonPagedPool]      7296

Working Set Sizes (now,min,max)  (1554, 50, 345) (6216KB, 200KB, 1380KB)

PeakWorkingSetSize                1558

VirtualSize                       75 Mb

PeakVirtualSize                   76 Mb

PageFaultCount                    1643

MemoryPriority                    BACKGROUND

BasePriority                      8

CommitCharge                      584

    Job                               fffffa80050f8860
PROCESS fffffa8005120a30

SessionId: 1  Cid: 0a88    Peb: 7efdf000  ParentCid: 09ec

DirBase: 923cd000  ObjectTable: fffff88008e29560  HandleCount:  99.

Image: daemon.exe

VadRoot fffffa8004a8cba0 Vads 96 Clone 0 Private 843. Modified 0. Locked 0.

DeviceMap fffff88008479c90

Token                             fffff88008eed730

ElapsedTime                       00:03:14.976

UserTime                          00:00:00.000

KernelTime                        00:00:00.000

QuotaPoolUsage[PagedPool]         175272

QuotaPoolUsage[NonPagedPool]      9024

Working Set Sizes (now,min,max)  (2608, 50, 345) (10432KB, 200KB, 1380KB)

PeakWorkingSetSize                2615

VirtualSize                       92 Mb

PeakVirtualSize                   94 Mb

PageFaultCount                    3463

MemoryPriority                    BACKGROUND

BasePriority                      8

CommitCharge                      1397

    Job                               fffffa80050f8860
PROCESS fffffa80051b5640

SessionId: 1  Cid: 0b98    Peb: 7efdf000  ParentCid: 09ec

DirBase: 8e371000  ObjectTable: fffff8800910ced0  HandleCount:  59.

Image: WZQKPICK.EXE

VadRoot fffffa80051c1630 Vads 58 Clone 0 Private 215. Modified 0. Locked 0.

DeviceMap fffff88008479c90

Token                             fffff8800910c860

ElapsedTime                       00:03:00.903

UserTime                          00:00:00.000

KernelTime                        00:00:00.000

QuotaPoolUsage[PagedPool]         123744

QuotaPoolUsage[NonPagedPool]      5376

Working Set Sizes (now,min,max)  (1274, 50, 345) (5096KB, 200KB, 1380KB)

PeakWorkingSetSize                1274

VirtualSize                       62 Mb

PeakVirtualSize                   63 Mb

PageFaultCount                    1304

MemoryPriority                    BACKGROUND

BasePriority                      8

CommitCharge                      331

    Job                               fffffa80050f8860
PROCESS fffffa800530e040

SessionId: 0  Cid: 0bcc    Peb: 7fffffd6000  ParentCid: 0328

DirBase: 12c7cc000  ObjectTable: fffff880097c19e0  HandleCount: 193.

Image: WmiPrvSE.exe

VadRoot fffffa80053864c0 Vads 107 Clone 0 Private 766. Modified 0. Locked 0.

DeviceMap fffff88007fe7530

Token                             fffff8800995f060

ElapsedTime                       00:00:27.349

UserTime                          00:00:00.000

KernelTime                        00:00:00.000

QuotaPoolUsage[PagedPool]         102888

QuotaPoolUsage[NonPagedPool]      10176

Working Set Sizes (now,min,max)  (2338, 50, 345) (9352KB, 200KB, 1380KB)

PeakWorkingSetSize                2338

VirtualSize                       56 Mb

PeakVirtualSize                   56 Mb

PageFaultCount                    2724

MemoryPriority                    BACKGROUND

BasePriority                      8

CommitCharge                      1359

    Job                               fffffa8004d71560
1: kd> !job fffffa8004d71560

Job at fffffa8004d71560

TotalPageFaultCount      0

TotalProcesses           1

ActiveProcesses          1

TotalTerminatedProcesses 0

LimitFlags               2b08

MinimumWorkingSetSize    0

MaximumWorkingSetSize    0

ActiveProcessLimit       20

PriorityClass            0

UIRestrictionsClass      0

SecurityLimitFlags       0

Token                    0000000000000000
1: kd> !job fffffa80050f8860

Job at fffffa80050f8860

TotalPageFaultCount      0

TotalProcesses           4

ActiveProcesses          4

TotalTerminatedProcesses 0

LimitFlags               1000

MinimumWorkingSetSize    0

MaximumWorkingSetSize    0

ActiveProcessLimit       0

PriorityClass            0

UIRestrictionsClass      0

SecurityLimitFlags       0

Token                    0000000000000000
1: kd> dt _EJOB fffffa80050f8860

nt!_EJOB

+0x000 Event            : _KEVENT

+0x018 JobLinks         : _LIST_ENTRY [ 0xfffff800`019c2450 - 0xfffffa80`04d71578 ]

+0x028 ProcessListHead  : _LIST_ENTRY [ 0xfffffa80`04e28e58 - 0xfffffa80`051b5888 ]

+0x038 JobLock          : _ERESOURCE

+0x0a0 TotalUserTime    : _LARGE_INTEGER 0x0

+0x0a8 TotalKernelTime  : _LARGE_INTEGER 0x0

+0x0b0 ThisPeriodTotalUserTime : _LARGE_INTEGER 0x0

+0x0b8 ThisPeriodTotalKernelTime : _LARGE_INTEGER 0x0

+0x0c0 TotalPageFaultCount : 0

+0x0c4 TotalProcesses   : 4

+0x0c8 ActiveProcesses  : 4

+0x0cc TotalTerminatedProcesses : 0

+0x0d0 PerProcessUserTimeLimit : _LARGE_INTEGER 0x0

+0x0d8 PerJobUserTimeLimit : _LARGE_INTEGER 0x0

+0x0e0 LimitFlags       : 0x1000

+0x0e8 MinimumWorkingSetSize : 0

+0x0f0 MaximumWorkingSetSize : 0

+0x0f8 ActiveProcessLimit : 0

+0x100 Affinity         : 0

+0x108 PriorityClass    : 0 ''

+0x110 AccessState      : (null)

+0x118 UIRestrictionsClass : 0

+0x11c EndOfJobTimeAction : 0

+0x120 CompletionPort   : (null)

+0x128 CompletionKey    : (null)

+0x130 SessionId        : 1

+0x134 SchedulingClass  : 5

+0x138 ReadOperationCount : 0

+0x140 WriteOperationCount : 0

+0x148 OtherOperationCount : 0

+0x150 ReadTransferCount : 0

+0x158 WriteTransferCount : 0

+0x160 OtherTransferCount : 0

+0x168 ProcessMemoryLimit : 0

+0x170 JobMemoryLimit   : 0

+0x178 PeakProcessMemoryUsed : 0x912

+0x180 PeakJobMemoryUsed : 0x11b3

+0x188 CurrentJobMemoryUsed : 0x11ae

+0x190 MemoryLimitsLock : _EX_PUSH_LOCK

+0x198 JobSetLinks      : _LIST_ENTRY [ 0xfffffa80`050f89f8 - 0xfffffa80`050f89f8 ]

+0x1a8 MemberLevel      : 0

+0x1ac JobFlags         : 1
C2 reqs: SLF - DAC - SAC - ORP (p. 452) - mnemonic to remember perhaps for security exams like CISSP
B reqs: TPF - TFM (p. 453)
Security targets and protection profiles (p. 453)
Advanced .NET Debugging by M. Hewardt:
type handle as a pointer to method table (p. 53) - I liked managed heap - execution engine boundary and propose this colored space diagram (will add this to Dictionary of Debugging soon as a tripartite “virtual” memory division):
!DumpModule command (p. 57)
!U command (pp. 58 - 59)
!DumpMT command (p. 59)
!DumpMT -md to dump type method descriptors (p. 60)
!DumpMD command (p. 60)
m_CodeOrIL: 00920070 (p. 61) - the address looks like as UNICODE string but I belive this is just a coincidence, the false positive of Wild Pointer pattern: http://www.dumpanalysis.org/blog/index.php/2008/03/11/crash-dump-analysis-patterns-part-55/
Today we introduce an icon for No Component Symbols pattern:
B/W
![]()
Color
![]()
- Dmitry Vostokov @ DumpAnalysis.org + TraceAnalysis.org -
Plan to start providing training and seminars in my free time. If you are interested please answer these questions (you can either respond here in comments or use this form for private communication http://www.dumpanalysis.org/contact):
Additional topics of expertise that can be integrated into training include Source Code Reading and Analysis, Debugging, Windows Architecture, Device Drivers, Troubleshooting Tools Design and Implementation, Multithreading, Deep Down C and C++, x86 and x64 Assembly Language Reading.
Looking forward to your responses. Any suggestions are welcome.
- Dmitry Vostokov @ DumpAnalysis.org + TraceAnalysis.org -
Today we introduce an icon for OMAP Code Optimization pattern:
B/W
![]()
Color
![]()
- Dmitry Vostokov @ DumpAnalysis.org + TraceAnalysis.org -
“Capturing delicate moments, one gives birth to a poetry of traces …”
Ange Leccia, Motionless Journeys, by Fabien Danesi
More patterns from software narratology. Now we illustrate Defamiliarizing Effect where we see sudden unfamiliar trace statements across familiar landscape of characteristic blocks and activity regions:
/familar traces/
/new trace from a problem system/
- Dmitry Vostokov @ DumpAnalysis.org + TraceAnalysis.org -
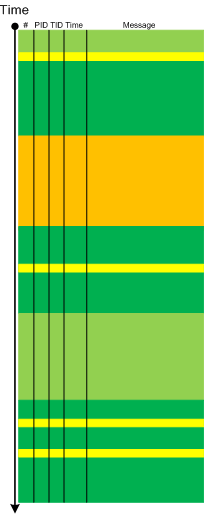
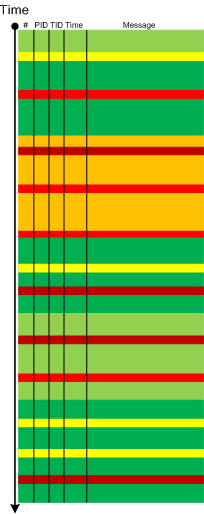
Metaphorical bijection from literary narratology to software narratology provides a pattern of Background and Foreground Components. This can be easily illustrated on pseudo-trace color diagrams. Suppose we troubleshoot a graphical issue using an ETW trace containing the output from all components of the problem system. Graphic components and their messages are foreground for a trace viewer (a person) against numerous background components (for example, database, file and registry access, shown in shades of green):
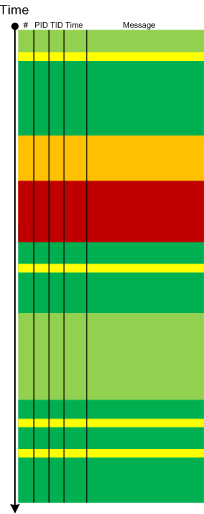
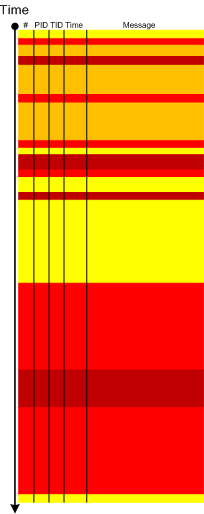
Trace viewers (for example, CDFAnalyzer) can filter out background component messages and present only foreground components (that I propose to call component foregrounding):
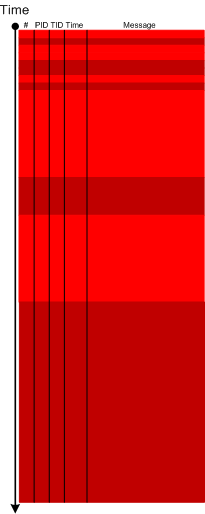
Of course, this process is iterative and parts of what once was foreground become background and candidates for further filtering:
- Dmitry Vostokov @ DumpAnalysis.org + TraceAnalysis.org -
This is a new open source tool similar to PDBFinder in functionality but with much simpler interface and internal implementation (based on the file name structure of the certain classes of TMF files for ETW). To be released this month on TraceAnalysis.org.
- Dmitry Vostokov @ DumpAnalysis.org + TraceAnalysis.org -
Today we introduce an icon for Incorrect Stack Trace pattern:
B/W
![]()
Color
![]()
- Dmitry Vostokov @ DumpAnalysis.org + TraceAnalysis.org -
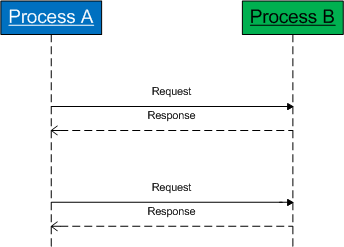
Previously introduced Coupled Processes pattern involves an active request (or an action) and an active wait for a response (or the action status):
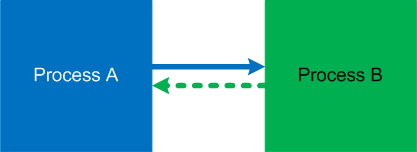
It is illustrated on this simple UML sequence diagram (process timeline represent collective request-response threads):
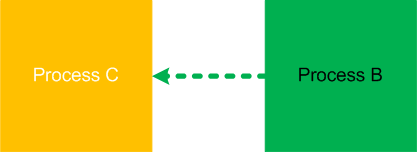
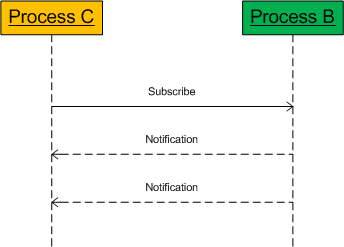
However, there is so called weak coupling when a process subscribes for notifications. Such threads most of the time are passive and processes are not blocked:
The coupling manifests itself when notifier threads start spiking CPU and bring their share of CPU consumption to the notified threads:
Here is an example of such threads from the forthcoming pattern interaction case study:
   5  Id: 61018.dbec Suspend: 1 Teb: 7ffae000 Unfrozen

ChildEBP RetAddr

01e3fa68 7c82787b ntdll!KiFastSystemCallRet

01e3fa6c 77c80a6e ntdll!NtRequestWaitReplyPort+0xc

01e3fab8 77c7fcf0 rpcrt4!LRPC_CCALL::SendReceive+0x230

01e3fac4 77c80673 rpcrt4!I_RpcSendReceive+0x24

01e3fad8 77ce315a rpcrt4!NdrSendReceive+0x2b

01e3fec0 771f4fbd rpcrt4!NdrClientCall2+0x22e

01e3fed8 771f4f60 winsta!RpcWinStationWaitSystemEvent+0x1c

01e3ff20 6582116c winsta!WinStationWaitSystemEvent+0x51

[...]

01e3ffec 00000000 kernel32!BaseThreadStart+0x34
In cases of synchronous notifications if a notified thread is blocked we have an instance of a reversed strong coupling.
- Dmitry Vostokov @ DumpAnalysis.org + TraceAnalysis.org -
Today we introduce an icon for Changed Environment pattern:
B/W
![]()
Color
![]()
- Dmitry Vostokov @ DumpAnalysis.org + TraceAnalysis.org -
Typical software narrative history consists of requests and responses, for example, function or object method calls and returns:
#     Module PID  TID  Time         File    Function Message

[...]

26060 dllA   1604 7108 10:06:21.746 fileA.c foo      Calling bar

[...]

26232 dllA   1604 7108 10:06:22.262 fileA.c foo      bar returns 0x5

[...]
The code that generates execution history is response-complete if it traces both requests and responses. For such code (except in cases where tracing is stopped before a response) the absence of expected responses could be a sign of blocked threads or quiet exception processing. The code that generates execution history is exception-complete if it also traces exception processing. Response-complete and exception-complete code is called call-complete. If we don’t see response messages for call-complete code we have Incomplete History.
In general, we can talk about the absence of certain messages in a trace as a deviation from the standard trace sequence template corresponding to a use case. The difference there is in a missing request too. This is a topic for next patterns.
- Dmitry Vostokov @ DumpAnalysis.org + TraceAnalysis.org -
I’m very pleased to announce that the Korean edition is available:

The book can be found on:
- Dmitry Vostokov @ DumpAnalysis.org + TraceAnalysis.org -
Comments in italics are mine and express my own views, thoughts and opinions
Windows Internals by M. Russinovich, D. Solomon and A. Ionescu:
per-PRCB queued, system-wide dispatcher, system-wide context swap and per-thread spinlocks (pp. 434-435)
physical over logical processor preference for scheduling (p. 435)
!smt command (p. 436) - here is the putput from x64 machine (from the output we can infer the following relationship logical processor -> core -> physical processor):
1: kd> !smt

SMT Summary:

------------

KeActiveProcessors: **-------------------------------------------------------------- (0000000000000003)

KiIdleSummary: -*-------------------------------------------------------------- (0000000000000002)

No PRCB SMT Set APIC Id

0 fffff80001991680 **-------------------------------------------------------------- (0000000000000003) 0x00000000

1 fffffa60005ec180 **-------------------------------------------------------------- (0000000000000003) 0x00000001
Maximum cores per physical processor: 2

Maximum logical processors per core: 1
NUMA (pp. 436 - 438) - I can see NUMA even on my small desktop system
1: kd> !numa

NUMA Summary:

------------

Number of NUMA nodes : 1

Number of Processors : 2

MmAvailablePages : 0x000C7CB9

KeActiveProcessors : (3)
NODE 0 (FFFFF80001995640):

ProcessorMask : (3)

Color : 0x00000000

MmShiftedColor : 0x00000000

Seed : 0x00000001

Right : 0x00000000

Left : 0x00000001

Zeroed Page Count: 0x0000000000000000

Free Page Count : 0x0000000000000000
Thread affinity (pp. 438 - 440) - see also Affine Thread crash dump analysis pattern: http://www.dumpanalysis.org/blog/index.php/2008/06/27/crash-dump-analysis-patterns-part-68/
uniprocessor flag as a workaround for multithreading defects (p. 439)
Set(Query)ProcessAffinityUpdateMode and dynamic processor changes (p. 442)
choosing a processor (idle ideal -> idle current -> idle previous -> current -> ideal running less priority thread) (pp. 433 - 444)
no guarantee to run all highest priority threads vs. always runs the highest priority thread (p. 444)
Advanced .NET Debugging by M. Hewardt:
value vs. reference types (p. 42)
sosex!bpsc (p. 46)
per frame managed stack trace: !ClrStack -a (p. 46)
d* for simple local value types, !dumpobj for references, !dumpvc for value type fields (pp. 46 - 47)
sync blocks (pp. 49 - 52) - here is the output from my x64 test program:
0:000> !ClrStack -a

OS Thread Id: 0x6e8 (0)
000000000013ed10 000007ff001ac709 System.IO.TextReader+SyncTextReader.ReadLine()

PARAMETERS:

this = 0x0000000002a2b568
0:000> !dumpobj 0x0000000002a2b568

Name: System.IO.TextReader+SyncTextReader

MethodTable: 000007feee67bea8

EEClass: 000007feedb851e0

Size: 32(0x20) bytes

(C:\Windows\assembly\GAC_64\mscorlib\2.0.0.0__b77a5c561934e089\mscorlib.dll)

Fields:

MT Field Offset Type VT Attr Value Name

000007feede86048 400018a 8 System.Object 0 instance 0000000000000000 __identity

000007feedecd198 4001c87 b18 System.IO.TextReader 0 shared static Null

>> Domain:Value 0000000000220840:0000000002a2b060 <<

000007feedecd198 4001c88 10 System.IO.TextReader 0 instance 0000000002a2af28 _in

ThinLock owner 1 (0000000000000000), Recursive 0
0:000> dq 0x0000000002a2b568-8

00000000`02a2b560 00000001`00000000 000007fe`ee67bea8

00000000`02a2b570 00000000`00000000 00000000`02a2af28

00000000`02a2b580 00000000`00000000 00000000`00000000

00000000`02a2b590 00000000`00000000 00000000`00000000

00000000`02a2b5a0 00000000`00000000 00000000`00000000

00000000`02a2b5b0 00000000`00000000 00000000`00000000

00000000`02a2b5c0 00000000`00000000 00000000`00000000

00000000`02a2b5d0 00000000`00000000 00000000`00000000
0:000> !syncblk 1

Index SyncBlock MonitorHeld Recursion Owning Thread Info SyncBlock Owner

1 0000000000259bf8 0 0 0000000000000000 none 0000000002a28030 System.EventHandler

-----------------------------

Total 1

CCW 0

RCW 0

ComClassFactory 0

Free 0
thin sync blocks (p. 52)