Icons for Memory Dump Analysis Patterns (Part 20)
Thursday, April 8th, 2010Today we introduce an icon for OMAP Code Optimization pattern:
B/W
![]()
Color
![]()
- Dmitry Vostokov @ DumpAnalysis.org + TraceAnalysis.org -
Today we introduce an icon for OMAP Code Optimization pattern:
B/W
![]()
Color
![]()
- Dmitry Vostokov @ DumpAnalysis.org + TraceAnalysis.org -
Posted in Crash Dump Analysis, Crash Dump Patterns, Debugging, Pattern Icons, Visual Dump Analysis | No Comments »
“Capturing delicate moments, one gives birth to a poetry of traces …”
Ange Leccia, Motionless Journeys, by Fabien Danesi
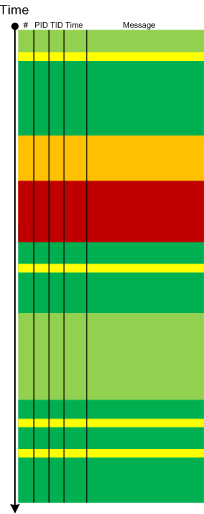
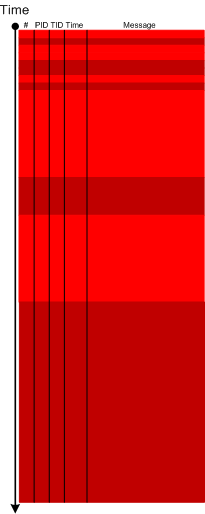
More patterns from software narratology. Now we illustrate Defamiliarizing Effect where we see sudden unfamiliar trace statements across familiar landscape of characteristic blocks and activity regions:
/familar traces/
/new trace from a problem system/
- Dmitry Vostokov @ DumpAnalysis.org + TraceAnalysis.org -
Posted in CDF Analysis Tips and Tricks, Citrix, Debugging, Software Narratology, Software Trace Analysis, Software Trace Visualization, Trace Analysis Patterns | 1 Comment »
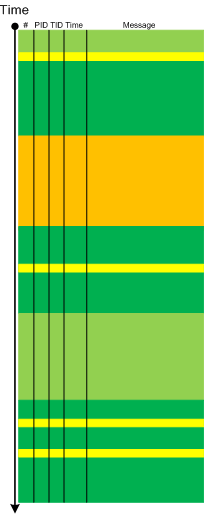
Metaphorical bijection from literary narratology to software narratology provides a pattern of Background and Foreground Components. This can be easily illustrated on pseudo-trace color diagrams. Suppose we troubleshoot a graphical issue using an ETW trace containing the output from all components of the problem system. Graphic components and their messages are foreground for a trace viewer (a person) against numerous background components (for example, database, file and registry access, shown in shades of green):
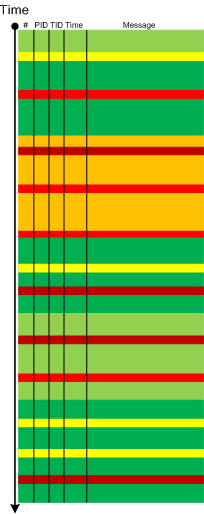
Trace viewers (for example, CDFAnalyzer) can filter out background component messages and present only foreground components (that I propose to call component foregrounding):
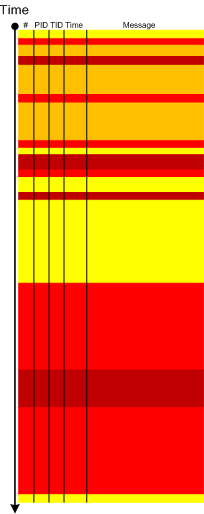
Of course, this process is iterative and parts of what once was foreground become background and candidates for further filtering:
- Dmitry Vostokov @ DumpAnalysis.org + TraceAnalysis.org -
Posted in CDF Analysis Tips and Tricks, Citrix, Debugging, Software Narratology, Software Trace Analysis, Software Trace Visualization, Tools, Trace Analysis Patterns | 2 Comments »
This is a new open source tool similar to PDBFinder in functionality but with much simpler interface and internal implementation (based on the file name structure of the certain classes of TMF files for ETW). To be released this month on TraceAnalysis.org.
- Dmitry Vostokov @ DumpAnalysis.org + TraceAnalysis.org -
Posted in CDF Analysis Tips and Tricks, Citrix, Debugging, Escalation Engineering, Software Technical Support, Software Trace Analysis, Tools | No Comments »
Software Diagnostics Library is proudly powered by
WordPress
Entries (RSS)
and Comments (RSS).