Crash Dump Analysis Patterns (Part 272)
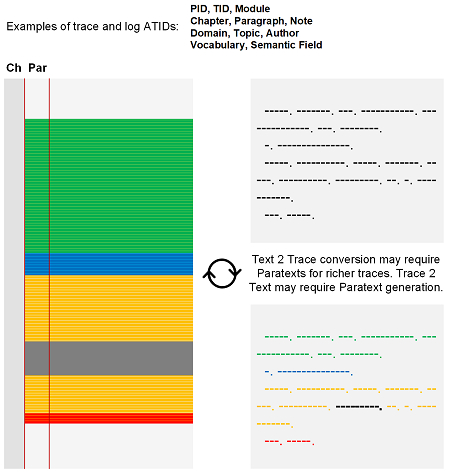
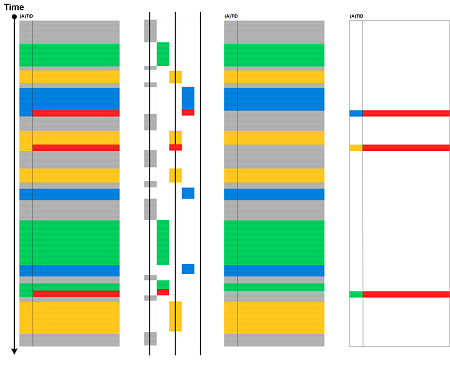
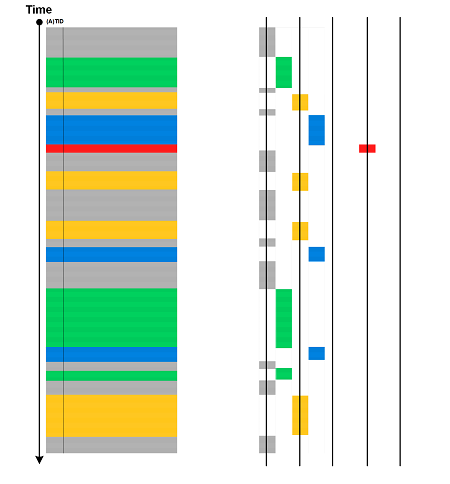
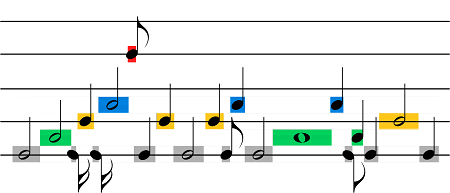
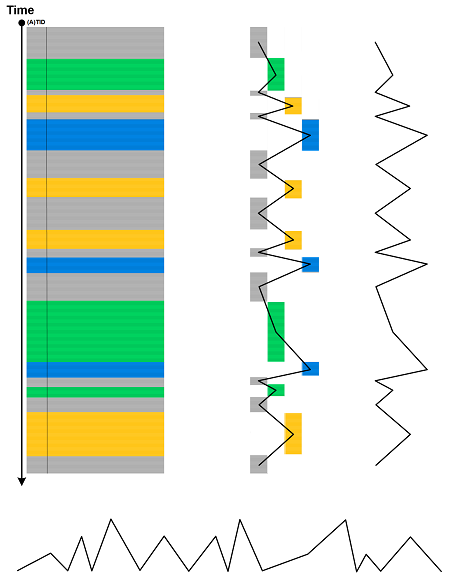
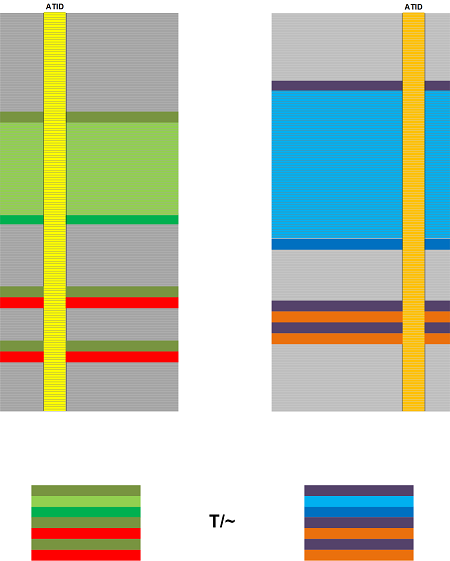
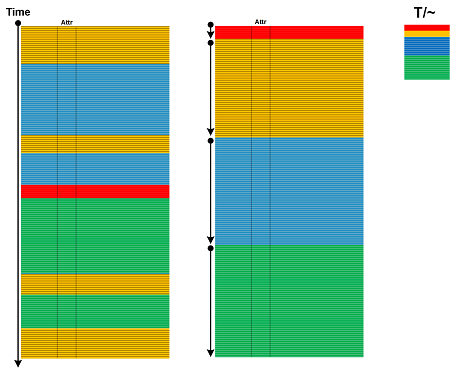
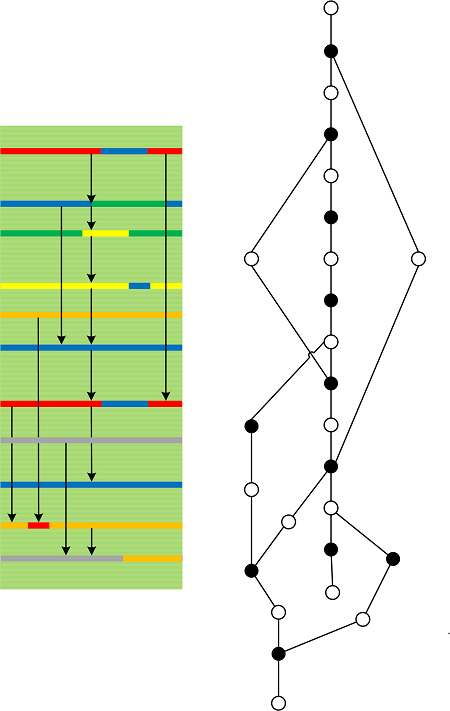
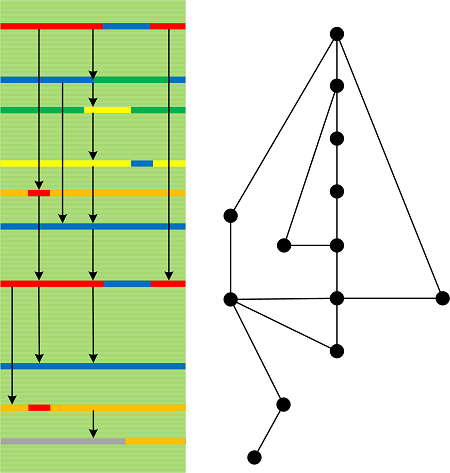
September 18th, 2020We introduced Procedure Call Chain in Stack Trace Collection and Coupled Processes analysis patterns. It is a stack trace formed by gluing stack trace fragments (for example, from LPC/ALPC and RPC Wait Chains) after removing middleware subtraces. For example, we use the following case study (32-bit for less space), follow its Wait Chain, and construct Procedure Call Chain (we use different colors to show gluing):
b88dccb8 804e1bf2 nt!KiSwapContext+0×2f

b88dccc4 804e1c3e nt!KiSwapThread+0×8a

b88dccec 8056dff6 nt!KeWaitForSingleObject+0×1c2

b88dcd50 804dd99f nt!NtWaitForSingleObject+0×9a

b88dcd50 7c90e514 nt!KiFastCallEntry+0xfc (TrapFrame @ b88dcd64)

036ef714 7c90df5a ntdll!KiFastSystemCallRet

036ef718 7c91b24b ntdll!ZwWaitForSingleObject+0xc

036ef7a0 7c901046 ntdll!RtlpWaitForCriticalSection+0×132

036ef7a8 6648a33b ntdll!RtlEnterCriticalSection+0×46

036ef7b0 6648c2ed ipnathlp!FwLock+0xa

036ef808 6648c705 ipnathlp!FwDynPortAdd+0×1d

036ef8c4 77e799f4 ipnathlp!FwOpenDynamicFwPort+0×125

00a9ef9c 662dafa9 hnetcfg!FwOpenDynamicFwPort+0×1b

00a9f048 71a55025 hnetcfg!IcfOpenDynamicFwPort+0×6a

00a9f0e4 71a590f2 mswsock!WSPBind+0×332

00a9f200 71ab2fd7 mswsock!WSPSendTo+0×230

00a9f250 76f252c0 WS2_32!sendto+0×88

00a9f280 76f251ea DNSAPI!SendMessagePrivate+0×18d

00a9f2a0 76f2517c DNSAPI!SendUsingServerInfo+0×33

00a9f2c8 76f25436 DNSAPI!SendUdpToNextDnsServers+0×80

00a9f314 76f24dec DNSAPI!Dns_SendAndRecvUdp+0×121

00a9f34c 76f24d20 DNSAPI!Dns_SendAndRecv+0×7b

00a9f37c 76f24a7d DNSAPI!Query_SingleName+0×8b

00a9f3b0 7677373a DNSAPI!Query_Main+0×11a

00a9f3c8 7677303f dnsrslvr!ResolverQuery+0×48

00a9f8bc 77e799f4 dnsrslvr!R_ResolverQuery+0×111

00a8f4c4 76f2357b DNSAPI!R_ResolverQuery+0×1b

00a8f520 71a526c6 DNSAPI!DnsQuery_W+0×14f

00a8f554 71a5266f mswsock!HostentBlob_Query+0×29

00a8f580 71a51b0a mswsock!Rnr_DoDnsLookup+0×7d

00a8f9c8 71ab32b0 mswsock!NSPLookupServiceNext+0×533

00a8f9e0 71ab3290 WS2_32!NSPROVIDER::NSPLookupServiceNext+0×17

00a8f9fc 71ab325a WS2_32!NSPROVIDERSTATE::LookupServiceNext+0×1c

00a8fa28 71ab31f8 WS2_32!NSQUERY::LookupServiceNext+0xae

00a8fa48 76f775eb WS2_32!WSALookupServiceNextW+0×78

00a8faec 76f6a9d2 WLDAP32!GetHostByNameW+0xef

00a8fb38 76f6667b WLDAP32!OpenLdapServer+0×435

00a8fb58 76f6fb05 WLDAP32!LdapConnect+0×169

00a8fef8 76f704f3 WLDAP32!LdapBind+0×34

00a8ff20 5e95651a WLDAP32!ldap_bind_sW+0×2c

00a8ff68 5e95a887 PAUTOENR!AERobustLdapBind+0xc9

00a8ffb4 7c80b729 PAUTOENR!AEMainThreadProc+0xef

00a8ffec 00000000 kernel32!BaseThreadStart+0×37
This similar to Glued Stack Trace which is produced from fragments that belong to one stack region.
- Dmitry Vostokov @ DumpAnalysis.org + TraceAnalysis.org -