When modeling Invalid Pointer (Objects) analysis pattern, we noticed that if we use MEM_RELEASE instead of MEM_DECOMMIT in VirtualFree API call, we see page memory contents despite an access violation Stored Exception pointing to that page. Moreover, the page contents were not corresponding to what should have been expected from source code. We had to do live kernel debugging in order to verify what was going on.
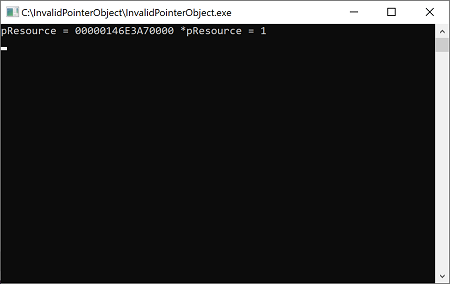
We launched InvalidPointerObject.exe that displayed the committed address allocated via VirtualAlloc API call:
The we broke into the system, found our process and inspected that address:
Microsoft (R) Windows Debugger Version 10.0.18362.1 AMD64

Copyright (c) Microsoft Corporation. All rights reserved.
Opened \\.\pipe\com2

Waiting to reconnect...

Connected to Windows 10 18362 x64 target at (Fri May  1 22:46:00.982 2020 (UTC + 1:00)), ptr64 TRUE

Kernel Debugger connection established.

Symbol search path is: srv*

Executable search path is:

Windows 10 Kernel Version 18362 MP (1 procs) Free x64

Built by: 18362.1.amd64fre.19h1_release.190318-1202

Machine Name:

Kernel base = 0xfffff800`74800000 PsLoadedModuleList = 0xfffff800`74c48190

System Uptime: 0 days 0:00:00.000

KDTARGET: Refreshing KD connection

Break instruction exception - code 80000003 (first chance)

*******************************************************************************

*                                                                             *

*   You are seeing this message because you pressed either                    *

*       CTRL+C (if you run console kernel debugger) or,                       *

*       CTRL+BREAK (if you run GUI kernel debugger),                          *

*   on your debugger machine's keyboard.                                      *

*                                                                             *

*                   THIS IS NOT A BUG OR A SYSTEM CRASH                       *

*                                                                             *

* If you did not intend to break into the debugger, press the "g" key, then   *

* press the "Enter" key now.  This message might immediately reappear.  If it *

* does, press "g" and "Enter" again.                                          *

*                                                                             *

*******************************************************************************

nt!DbgBreakPointWithStatus:

fffff800`749c93a0 cc              int     3
1: kd> !process 0 0

**** NT ACTIVE PROCESS DUMP ****

PROCESS ffffe00314e89300

SessionId: none  Cid: 0004    Peb: 00000000  ParentCid: 0000

DirBase: 001ad002  ObjectTable: ffffc90314806d40  HandleCount: 3136.

Image: System
[...]
PROCESS ffffe00318d60080

SessionId: 1  Cid: 1a90    Peb: 161ab73000  ParentCid: 1474

DirBase: af7ee002  ObjectTable: ffffc9031c02a0c0  HandleCount:  33.

Image: InvalidPointerObject.exe
[...]
1: kd> !process ffffe00318d60080 3f

PROCESS ffffe00318d60080

SessionId: 1  Cid: 1a90    Peb: 161ab73000  ParentCid: 1474

DirBase: af7ee002  ObjectTable: ffffc9031c02a0c0  HandleCount:  33.

Image: InvalidPointerObject.exe

VadRoot ffffe0031a78d1c0 Vads 22 Clone 0 Private 94. Modified 0. Locked 2.

DeviceMap ffffc903193e9bf0

Token                             ffffc9031c692060

ElapsedTime                       00:01:13.571

UserTime                          00:00:00.000

KernelTime                        00:00:00.000

QuotaPoolUsage[PagedPool]         20344

QuotaPoolUsage[NonPagedPool]      3256

Working Set Sizes (now,min,max)  (497, 50, 345) (1988KB, 200KB, 1380KB)

PeakWorkingSetSize                465

VirtualSize                       4139 Mb

PeakVirtualSize                   4139 Mb

PageFaultCount                    499

MemoryPriority                    BACKGROUND

BasePriority                      8

CommitCharge                      107

Job                               ffffe00317be8060
[...]
        THREAD ffffe003198ba0c0  Cid 1a90.18bc  Teb: 000000161ab74000 Win32Thread: 0000000000000000 WAIT: (Executive) KernelMode Alertable

ffffe0031a7b0238  NotificationEvent

IRP List:

ffffe00318a49510: (0006,0238) Flags: 00060900  Mdl: ffffe00319319470

Not impersonating

DeviceMap                 ffffc903193e9bf0

Owning Process            ffffe00318d60080       Image:         InvalidPointerObject.exe

Attached Process          N/A            Image:         N/A

Wait Start TickCount      6673           Ticks: 4692 (0:00:01:13.312)

Context Switch Count      118            IdealProcessor: 1

UserTime                  00:00:00.000

KernelTime                00:00:00.015

*** WARNING: Unable to verify checksum for InvalidPointerObject.exe

Win32 Start Address InvalidPointerObject!wmainCRTStartup (0x00007ff66357e044)

Stack Init ffff848c00a22c90 Current ffff848c00a22560

Base ffff848c00a23000 Limit ffff848c00a1d000 Call 0000000000000000

Priority 8 BasePriority 8 PriorityDecrement 0 IoPriority 2 PagePriority 5

Child-SP          RetAddr           Call Site

ffff848c`00a225a0 fffff800`7483c7bd nt!KiSwapContext+0x76

ffff848c`00a226e0 fffff800`7483b644 nt!KiSwapThread+0xbfd

ffff848c`00a22780 fffff800`7483ade5 nt!KiCommitThreadWait+0x144

ffff848c`00a22820 fffff800`74de982a nt!KeWaitForSingleObject+0x255

ffff848c`00a22900 fffff800`74de595f nt!IopSynchronousServiceTail+0x24a

ffff848c`00a229a0 fffff800`749d2e15 nt!NtReadFile+0x59f

ffff848c`00a22a90 00007ffb`0ed3c184 nt!KiSystemServiceCopyEnd+0x25 (TrapFrame @ ffff848c`00a22b00)

00000016`1a96f338 00007ffb`0c405227 ntdll!NtReadFile+0x14

00000016`1a96f340 00007ff6`6359b3b9 KERNELBASE!ReadFile+0x77

00000016`1a96f3c0 00000000`00000001 InvalidPointerObject!_read_nolock+0x2f5 [minkernel\crts\ucrt\src\appcrt\lowio\read.cpp @ 566]

00000016`1a96f3c8 00000000`00000000 0x1
1: kd> .thread /r /p ffffe003198ba0c0

Implicit thread is now ffffe003`198ba0c0

Implicit process is now ffffe003`18d60080

.cache forcedecodeuser done

Loading User Symbols

....
1: kd> kL

*** Stack trace for last set context - .thread/.cxr resets it

# Child-SP          RetAddr           Call Site

00 ffff848c`00a225a0 fffff800`7483c7bd nt!KiSwapContext+0x76

01 ffff848c`00a226e0 fffff800`7483b644 nt!KiSwapThread+0xbfd

02 ffff848c`00a22780 fffff800`7483ade5 nt!KiCommitThreadWait+0x144

03 ffff848c`00a22820 fffff800`74de982a nt!KeWaitForSingleObject+0x255

04 ffff848c`00a22900 fffff800`74de595f nt!IopSynchronousServiceTail+0x24a

05 ffff848c`00a229a0 fffff800`749d2e15 nt!NtReadFile+0x59f

06 ffff848c`00a22a90 00007ffb`0ed3c184 nt!KiSystemServiceCopyEnd+0x25

07 00000016`1a96f338 00007ffb`0c405227 ntdll!NtReadFile+0x14

*** WARNING: Unable to verify checksum for InvalidPointerObject.exe

08 00000016`1a96f340 00007ff6`6359b3b9 KERNELBASE!ReadFile+0x77

09 00000016`1a96f3c0 00000000`00000001 InvalidPointerObject!_read_nolock+0x2f5

0a 00000016`1a96f3c8 00000000`00000000 0x1
1: kd> !vad 146e3a70000 1
VAD @ ffffe0031a78eb10

Start VPN             146e3a70  End VPN         146e3a70  Control Area  0000000000000000

FirstProtoPte 0000000000000000  LastPte 0000000000000000  Commit Charge                1 (0n1)

Secured.Flink                0  Blink                  0  Banked/Extend                0

File Offset                  0

ViewUnmap MemCommit PrivateMemory READWRITE
1: kd> dc 146e3a70000

00000146`e3a70000  00000001 00000000 00000000 00000000  …………….

00000146`e3a70010  00000000 00000000 00000000 00000000  …………….

00000146`e3a70020  00000000 00000000 00000000 00000000  …………….

00000146`e3a70030  00000000 00000000 00000000 00000000  …………….

00000146`e3a70040  00000000 00000000 00000000 00000000  …………….

00000146`e3a70050  00000000 00000000 00000000 00000000  …………….

00000146`e3a70060  00000000 00000000 00000000 00000000  …………….

00000146`e3a70070  00000000 00000000 00000000 00000000  …………….
We see the page memory contents show the correct counter value (1):
struct Resource
{
    void DoSomething()
    {
        ++m_usageCounter;
    }
    std::size_t m_usageCounter{};
};
We resume system execution and hit a key. The program crashes in the second DoSomething call after releasing memory that contained Resource object:
::VirtualFree(pMem, 0, MEM_RELEASE);
pResource->DoSomething();
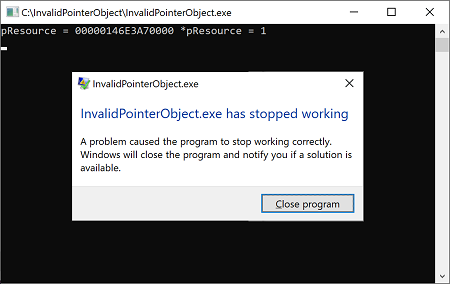
We wait until WER dialog appears (we had to add DWORD DontShowUI (0) to \HKEY_LOCAL_MACHINE\SOFTWARE\Microsoft\Windows\Windows Error Reporting):
We then break in the system again and inspect the same address:
1: kd> g

Break instruction exception - code 80000003 (first chance)

*******************************************************************************

*                                                                             *

*   You are seeing this message because you pressed either                    *

*       CTRL+C (if you run console kernel debugger) or,                       *

*       CTRL+BREAK (if you run GUI kernel debugger),                          *

*   on your debugger machine's keyboard.                                      *

*                                                                             *

*                   THIS IS NOT A BUG OR A SYSTEM CRASH                       *

*                                                                             *

* If you did not intend to break into the debugger, press the "g" key, then   *

* press the "Enter" key now.  This message might immediately reappear.  If it *

* does, press "g" and "Enter" again.                                          *

*                                                                             *

*******************************************************************************

nt!DbgBreakPointWithStatus:

fffff800`749c93a0 cc              int     3
0: kd> .thread /r /p ffffe003198ba0c0

Implicit thread is now ffffe003`198ba0c0

Implicit process is now ffffe003`18d60080

.cache forcedecodeuser done

Loading User Symbols

....
0: kd> kL

*** Stack trace for last set context - .thread/.cxr resets it

# Child-SP          RetAddr           Call Site

00 ffff848c`00a21f70 fffff800`7483c7bd nt!KiSwapContext+0x76

01 ffff848c`00a220b0 fffff800`7483b644 nt!KiSwapThread+0xbfd

02 ffff848c`00a22150 fffff800`748884e7 nt!KiCommitThreadWait+0x144

03 ffff848c`00a221f0 fffff800`74e1ffe9 nt!KeWaitForMultipleObjects+0x287

04 ffff848c`00a22300 fffff800`74e1fd05 nt!ObWaitForMultipleObjects+0x2a9

05 ffff848c`00a22800 fffff800`749d2e15 nt!NtWaitForMultipleObjects+0x105

06 ffff848c`00a22a90 00007ffb`0ed3cc14 nt!KiSystemServiceCopyEnd+0x25

07 00000016`1a96e208 00007ffb`0c438027 ntdll!NtWaitForMultipleObjects+0x14

08 00000016`1a96e210 00007ffb`0c437f0e KERNELBASE!WaitForMultipleObjectsEx+0x107

09 00000016`1a96e510 00007ffb`0e0071fb KERNELBASE!WaitForMultipleObjects+0xe

0a 00000016`1a96e550 00007ffb`0e006ca8 KERNEL32!WerpReportFaultInternal+0x51b

0b 00000016`1a96e670 00007ffb`0c4df868 KERNEL32!WerpReportFault+0xac

0c 00000016`1a96e6b0 00007ffb`0ed44b32 KERNELBASE!UnhandledExceptionFilter+0x3b8

0d 00000016`1a96e7d0 00007ffb`0ed2c6d6 ntdll!RtlUserThreadStart$filt$0+0xa2

0e 00000016`1a96e810 00007ffb`0ed4121f ntdll!_C_specific_handler+0x96

0f 00000016`1a96e880 00007ffb`0ed0a289 ntdll!RtlpExecuteHandlerForException+0xf

10 00000016`1a96e8b0 00007ffb`0ed3fe8e ntdll!RtlDispatchException+0x219

11 00000016`1a96efc0 00007ff6`6357378a ntdll!KiUserExceptionDispatch+0×2e

*** WARNING: Unable to verify checksum for InvalidPointerObject.exe

12 00000016`1a96f6d8 00007ff6`63573875 InvalidPointerObject!Resource::DoSomething+0xa

13 00000016`1a96f6e0 00007ff6`6357dfd4 InvalidPointerObject!wmain+0xd5

14 (Inline Function) ——–`——– InvalidPointerObject!invoke_main+0×22

15 00000016`1a96f730 00007ffb`0dfb7bd4 InvalidPointerObject!__scrt_common_main_seh+0×10c

16 00000016`1a96f770 00007ffb`0ed0ced1 KERNEL32!BaseThreadInitThunk+0×14

17 00000016`1a96f7a0 00000000`00000000 ntdll!RtlUserThreadStart+0×21
0: kd> .frame 0n18;dv /t /v

12 00000016`1a96f6d8 00007ff6`63573875 InvalidPointerObject!Resource::DoSomething+0xa [C:\NewWork\InvalidPointerObject\InvalidPointerObject.cpp @ 10]

00000016`1a96f6e0 struct Resource * this = 0×00000146`e3a70000
0: kd> !vad 146e3a70000 1
VAD @ ffffe0031ab91080

Start VPN             146e3a70  End VPN         146e3a70  Control Area  ffffe0031a66f780

FirstProtoPte ffffc9031b8fdf50  LastPte ffffc9031b8fdf50  Commit Charge                0 (0n0)

Secured.Flink                0  Blink                  0  Banked/Extend                0

File Offset                  0

ViewShare READWRITE
ControlArea  @ ffffe0031a66f780

Segment      ffffc9031c7d55d0  Flink      ffffe0031ab91f40  Blink        ffffe0031ab910e0

Section Ref                 1  Pfn Ref                   0  Mapped Views                3

User Ref                    4  WaitForDel                0  Flush Count                 1

File Object  0000000000000000  ModWriteCount             0  System Views                0

WritableRefs                0  PartitionId                0

Flags (2000) Commit
Pagefile-backed section
Segment @ ffffc9031c7d55d0

ControlArea       ffffe0031a66f780  ExtendInfo    0000000000000000

Total Ptes                       1

Segment Size                  1000  Committed                    1

CreatingProcessId             1a90  FirstMappedVa      146e3a70000

ProtoPtes         ffffc9031b8fdf50

Flags (80000) ProtectionMask
0: kd> !ca ffffe0031a66f780 4
ControlArea  @ ffffe0031a66f780

Segment      ffffc9031c7d55d0  Flink      ffffe0031ab91f40  Blink        ffffe0031ab910e0

Section Ref                 1  Pfn Ref                   0  Mapped Views                3

User Ref                    4  WaitForDel                0  Flush Count                 1

File Object  0000000000000000  ModWriteCount             0  System Views                0

WritableRefs                0  PartitionId                0

Flags (2000) Commit
Pagefile-backed section
3 mapped view(s):
ffffe0031ab91f40 - VAD ffffe0031ab91ee0, process ffffe0031a8d3080  WerFault.exe

ffffe0031ab93ca0 - VAD ffffe0031ab93c40, process ffffe0031acd3080  InvalidPointer

ffffe0031ab910e0 - VAD ffffe0031ab91080, process ffffe00318d60080  InvalidPointer
0: kd> dc 146e3a70000

00000146`e3a70000  000000f0 00001a90 000018bc 00000000  …………….

00000146`e3a70010  00000000 00000000 00000000 00000000  …………….

00000146`e3a70020  00000000 00000000 00000000 00000000  …………….

00000146`e3a70030  00000000 00000000 00000000 00000000  …………….

00000146`e3a70040  00000000 00000000 00000000 00000000  …………….

00000146`e3a70050  00000000 00000000 00000000 00000000  …………….

00000146`e3a70060  00000000 00000000 00000000 00000000  …………….

00000146`e3a70070  00000000 00000000 00000000 00000000  …………….
We see the page contents changed (it now contains PID and TID) and also its pagefile-backed section lists 3 mapped views including 2 new processes, one is Zombie Process duplicate of the original InvalidPointerObject.exe process and another is WerFault.exe:
0: kd> !process ffffe0031acd3080

PROCESS ffffe0031acd3080

SessionId: 1  Cid: 06cc    Peb: 161ab73000  ParentCid: 1a90

DirBase: 9d002002  ObjectTable: ffffc9031c03e5c0  HandleCount:   0.

Image: InvalidPointerObject.exe

VadRoot ffffe0031a789d90 Vads 21 Clone ffffe00318770810 Private 41. Modified 0. Locked 0.

DeviceMap 0000000000000000

Token                             ffffc9031d32a770

ElapsedTime                       00:00:26.741

UserTime                          00:00:00.000

KernelTime                        00:00:00.000

QuotaPoolUsage[PagedPool]         17776

QuotaPoolUsage[NonPagedPool]      6024

Working Set Sizes (now,min,max)  (28, 50, 345) (112KB, 200KB, 1380KB)

PeakWorkingSetSize                10

VirtualSize                       4138 Mb

PeakVirtualSize                   4138 Mb

PageFaultCount                    28

MemoryPriority                    BACKGROUND

BasePriority                      8

CommitCharge                      51
No active threads
0: kd> !process 1a90

Searching for Process with Cid == 1a90

PROCESS ffffe00318d60080

SessionId: 1  Cid: 1a90    Peb: 161ab73000  ParentCid: 1474

DirBase: af7ee002  ObjectTable: ffffc9031c02a0c0  HandleCount:  39.

Image: InvalidPointerObject.exe

VadRoot ffffe0031a78d1c0 Vads 22 Clone ffffe00318770590 Private 43. Modified 18. Locked 0.

DeviceMap ffffc903193e9bf0

Token                             ffffc9031c692060

ElapsedTime                       00:38:20.130

UserTime                          00:00:00.000

KernelTime                        00:00:00.000

QuotaPoolUsage[PagedPool]         20352

QuotaPoolUsage[NonPagedPool]      6328

Working Set Sizes (now,min,max)  (547, 50, 345) (2188KB, 200KB, 1380KB)

PeakWorkingSetSize                515

VirtualSize                       4139 Mb

PeakVirtualSize                   4139 Mb

PageFaultCount                    552

MemoryPriority                    BACKGROUND

BasePriority                      8

CommitCharge                      106

Job                               ffffe00317be8060
[...]
We resume system execution and collect the process crash dump. When we look at the crash address we see the same unexpected False Memory contents:
This dump file has an exception of interest stored in it.

The stored exception information can be accessed via .ecxr.

(1a90.18bc): Access violation - code c0000005 (first/second chance not available)

For analysis of this file, run !analyze -v

ntdll!NtWaitForMultipleObjects+0x14:

00007ffb`0ed3cc14 c3              ret
0:000> kL

# Child-SP          RetAddr           Call Site

00 00000016`1a96e208 00007ffb`0c438027 ntdll!NtWaitForMultipleObjects+0x14

01 00000016`1a96e210 00007ffb`0c437f0e KERNELBASE!WaitForMultipleObjectsEx+0x107

02 00000016`1a96e510 00007ffb`0e0071fb KERNELBASE!WaitForMultipleObjects+0xe

03 00000016`1a96e550 00007ffb`0e006ca8 kernel32!WerpReportFaultInternal+0x51b

04 00000016`1a96e670 00007ffb`0c4df868 kernel32!WerpReportFault+0xac

05 00000016`1a96e6b0 00007ffb`0ed44b32 KERNELBASE!UnhandledExceptionFilter+0x3b8

06 00000016`1a96e7d0 00007ffb`0ed2c6d6 ntdll!RtlUserThreadStart$filt$0+0xa2

07 00000016`1a96e810 00007ffb`0ed4121f ntdll!_C_specific_handler+0x96

08 00000016`1a96e880 00007ffb`0ed0a289 ntdll!RtlpExecuteHandlerForException+0xf

09 00000016`1a96e8b0 00007ffb`0ed3fe8e ntdll!RtlDispatchException+0x219

0a 00000016`1a96efc0 00007ff6`6357378a ntdll!KiUserExceptionDispatch+0×2e

*** WARNING: Unable to verify checksum for InvalidPointerObject.exe

0b 00000016`1a96f6d8 00007ff6`63573875 InvalidPointerObject!Resource::DoSomething+0xa

0c 00000016`1a96f6e0 00007ff6`6357dfd4 InvalidPointerObject!wmain+0xd5

0d (Inline Function) ——–`——– InvalidPointerObject!invoke_main+0×22

0e 00000016`1a96f730 00007ffb`0dfb7bd4 InvalidPointerObject!__scrt_common_main_seh+0×10c

0f 00000016`1a96f770 00007ffb`0ed0ced1 kernel32!BaseThreadInitThunk+0×14

10 00000016`1a96f7a0 00000000`00000000 ntdll!RtlUserThreadStart+0×21
0:000> dx Debugger.Sessions[0].Processes[6800].Threads[6332].Stack.Frames[11].SwitchTo();dv /t /v

Debugger.Sessions[0].Processes[6800].Threads[6332].Stack.Frames[11].SwitchTo()

00000016`1a96f6e0 struct Resource * this = 0×00000146`e3a70000
0:000> !address 0×00000146`e3a70000
Usage:                  <unknown>

Base Address:           00000146`e3a70000

End Address:            00000146`e3a71000

Region Size:            00000000`00001000 (   4.000 kB)

State:                  00001000          MEM_COMMIT

Protect:                00000004          PAGE_READWRITE

Type:                   00040000          MEM_MAPPED

Allocation Base:        00000146`e3a70000

Allocation Protect:     00000004          PAGE_READWRITE
Content source: 1 (target), length: 1000
0:000> dc 0×00000146`e3a70000

00000146`e3a70000  000000f0 00001a90 000018bc 00000000  …………….

00000146`e3a70010  00000000 00000000 00000000 00000000  …………….

00000146`e3a70020  00000000 00000000 00000000 00000000  …………….

00000146`e3a70030  00000000 00000000 00000000 00000000  …………….

00000146`e3a70040  00000000 00000000 00000000 00000000  …………….

00000146`e3a70050  00000000 00000000 00000000 00000000  …………….

00000146`e3a70060  00000000 00000000 00000000 00000000  …………….

00000146`e3a70070  00000000 00000000 00000000 00000000  …………….
0:000> ~

.  0  Id: 1a90.18bc Suspend: 0 Teb: 00000016`1ab74000 Unfrozen
0:000> dx -r1 ((InvalidPointerObject!Resource *)0x146e3a70000)

((InvalidPointerObject!Resource *)0x146e3a70000)                 : 0×146e3a70000 [Type: Resource *]

[+0×000] m_usageCounter   : 0×1a90000000f0 [Type: unsigned __int64]
0:000> .ecxr

rax=00000146e3a70000 rbx=00000146e3aa5bf0 rcx=00000146e3a70000

rdx=0000000000000000 rsi=0000000000000000 rdi=00000146e3aa5c70

rip=00007ff66357378a rsp=000000161a96f6d8 rbp=0000000000000000

r8=000000161a96f6a8  r9=0000000000000000 r10=0000000000000000

r11=0000000000000246 r12=0000000000000000 r13=0000000000000000

r14=0000000000000000 r15=0000000000000000

iopl=0         nv up ei pl nz na pe nc

cs=0033  ss=002b  ds=002b  es=002b  fs=0053  gs=002b             efl=00010202

InvalidPointerObject!Resource::DoSomething+0xa:

00007ff6`6357378a 488b00          mov     rax,qword ptr [rax] ds:00000146`e3a70000=00001a90000000f0
Such False Memory may complicate the analysis of process crash dumps when we want to examine memory contents prior to exception.
The example memory dump, the application PDB file, and source code can be downloaded from here.
- Dmitry Vostokov @ DumpAnalysis.org + TraceAnalysis.org -