Icons for Memory Dump Analysis Patterns (Part 90)
February 14th, 2011Today we introduce an icon for Zombie Processes pattern:
B/W

Color

- Dmitry Vostokov @ DumpAnalysis.org + TraceAnalysis.org -
Today we introduce an icon for Zombie Processes pattern:
B/W
Color
- Dmitry Vostokov @ DumpAnalysis.org + TraceAnalysis.org -

- Dmitry Vostokov @ DumpAnalysis.org + TraceAnalysis.org -
Sometimes added instrumentation via gflags, application and driver verifier options affect system, service or application performance and resources. I call this pattern Instrumentation Side Effect. For example, after enabling full page heap, one process on an x64 machine was growing up to 24GB and its user memory dump shows that every heap allocation was recorded in a stack trace database:
0:055> !gflag

Current NtGlobalFlag contents: 0x02000000

    hpa - Place heap allocations at ends of pages
0:055> ~*kc
[...]
  48  Id: 117fc.c164 Suspend: 1 Teb: 000007ff`fff52000 Unfrozen

Call Site

ntdll!ZwWaitForSingleObject

ntdll!RtlpWaitOnCriticalSection

ntdll!RtlEnterCriticalSection

verifier!AVrfpDphEnterCriticalSection

verifier!AVrfpDphPreProcessing

verifier!AVrfDebugPageHeapAllocate

ntdll!RtlDebugAllocateHeap

ntdll! ?? ::FNODOBFM::`string’

ntdll!RtlAllocateHeap

msvcrt!malloc

ModuleA!foo1

[…]
  49  Id: 117fc.de80 Suspend: 1 Teb: 000007ff`fff54000 Unfrozen

Call Site

ntdll!RtlCompareMemory

ntdll!RtlpLogCapturedStackTrace

ntdll!RtlLogStackTrace

verifier!AVrfpDphPlaceOnFreeList

verifier!AVrfDebugPageHeapFree

ntdll!RtlDebugFreeHeap

ntdll! ?? ::FNODOBFM::`string’

ntdll!RtlFreeHeap

kernel32!HeapFree

msvcrt!free

ModuleB!foo2

[…]
  50  Id: 117fc.3700 Suspend: 1 Teb: 000007ff`fff4e000 Unfrozen

Call Site

ntdll!ZwWaitForSingleObject

ntdll!RtlpWaitOnCriticalSection

ntdll!RtlEnterCriticalSection

verifier!AVrfpDphEnterCriticalSection

verifier!AVrfpDphPreProcessing

verifier!AVrfDebugPageHeapFree

ntdll!RtlDebugFreeHeap

ntdll! ?? ::FNODOBFM::`string’

ntdll!RtlFreeHeap

kernel32!HeapFree

msvcrt!free

ModuleC!foo3

[…]
0:055> !runaway

 User Mode Time

  Thread       Time

  38:d090      0 days 0:02:28.793

  44:ca48      0 days 0:01:04.459

  48:c164      0 days 0:00:56.909

  43:4458      0 days 0:00:54.475

  50:3700      0 days 0:00:43.992

  45:6f98      0 days 0:00:38.953

  49:de80      0 days 0:00:24.211

   1:391c      0 days 0:00:00.639

   0:7e90      0 days 0:00:00.109

  55:a300      0 days 0:00:00.046

  34:10c9c      0 days 0:00:00.015

  21:d054      0 days 0:00:00.015

  56:b0a0      0 days 0:00:00.000

  54:8b78      0 days 0:00:00.000

  53:155b8      0 days 0:00:00.000

  52:b444      0 days 0:00:00.000
Top modules ModuleA(B, C) from the spiking and heap intensive threads are from the same vendor.
I was able to get a 200×27349 slice from that dump using ImageMagick and it shows almost all virtual memory space filled with traces of this pictorial form (magnified by x8):


- Dmitry Vostokov @ DumpAnalysis.org + TraceAnalysis.org -
Today we introduce an icon for Blocked Thread (hardware) pattern:
B/W

Color

- Dmitry Vostokov @ DumpAnalysis.org + TraceAnalysis.org -
This pattern has a funny name Gossip. I thought originally to call it Duplicated Message but gave it the new name allowing for the possibility of semantics of the same message to be distorted in subsequent trace messages from different adjoint threads. Typical ETW / CDF trace example (distortion free) of the same message content seen in different modules (some columns like Date and Time are omitted):
#     Module  PID  TID  Message[...]26875 ModuleA

2172 5284 LoadImageEvent: ImageName(\Device\HarddiskVolume2\Windows\System32\notepad.exe) ProcessId(0x000000000000087C)26876 ModuleB

2172 5284 LoadImageEvent: ImageName(\Device\HarddiskVolume2\Windows\System32\notepad.exe), ProcessId(2172)26877 ModuleC

2172 5284 ImageLoad: fileName=notepad.exe, pid: 000000000000087C[...]
In such cases, when constructing event sequence order it is recommended to choose messages from the one source instead of mixing events from different sources, for example:
#     Module  PID  TID  Message[...]26875 ModuleA

2172 5284 LoadImageEvent: ImageName(\Device\HarddiskVolume2\Windows\System32\notepad.exe) ProcessId(0×000000000000087C)[…]33132 ModuleA

4180 2130 LoadImageEvent: ImageName(\Device\HarddiskVolume2\Windows\System32\calc.exe) ProcessId(0×0000000000001054)[…]
- Dmitry Vostokov @ DumpAnalysis.org + TraceAnalysis.org -
Got an insider information from Memory Dump Analysis Services that they are developing a Prolog extension for memory dump analysis. Indeed, after asking their development team, I got a proof of concept extension DLL that works on my computer after installing x64 version of SWI-Prolog and copying wdes.dll to pl \ bin installation folder:
0: kd> .load C:\Program Files\pl\bin\wdes.dll
0: kd> !help

Help for Windows Debugging Expert System wdes.dll

   help               - Shows this help

   pload              - Loads Prolog interpretor
0: kd> !pload

SWI-Prolog has been loaded
So far so good. Waiting for more extension commands. Perhaps, one day, this extension realizes my dream reminisced while testing a Python extension.
- Dmitry Vostokov @ DumpAnalysis.org + TraceAnalysis.org -
Finally had time today to test python WinDbg extension. I installed python 2.6.6 and used Debugging Tools for Windows x64. The script I used was from the extension web site blog slightly modified and called processes.py:
from pykd import *

nt = loadModule( "nt" )

processList = typedVarList( nt.PsActiveProcessHead, "nt", "_EPROCESS", "ActiveProcessLinks" )

for process in processList:

    dprintln( "".join( [ chr(i) for i in process.ImageFileName.values() ] ) )

    dprintln( "\r" )
I loaded x64 version of pykd.pyd extension and executed the script:
0: kd> !py c:\PyScripts\processes.py

System

smss.exe

csrss.exe

csrss.exe

psxss.exe

winlogon.exe

wininit.exe

services.exe

lsass.exe

lsm.exe

svchost.exe

svchost.exe

svchost.exe

svchost.exe

svchost.exe

svchost.exe

svchost.exe

svchost.exe

spoolsv.exe

mdm.exe

svchost.exe

svchost.exe

svchost.exe

taskhost.exe

dwm.exe

explorer.exe

DTLite.exe

mmc.exe

WZQKPICK.EXE

concentr.exe

pnamain.exe

jusched.exe

wfcrun32.exe

msdtc.exe

iexplore.exe

iexplore.exe

iexplore.exe

splwow64.exe

iexplore.exe

jucheck.exe

iexplore.exe

notepad.exe

notepad.exe

iexplore.exe

notepad.exe

iexplore.exe

notepad.exe

notepad.exe

iexplore.exe

audiodg.exe

CDViewer.exe

wfica32.exe

iexplore.exe

notepad.exe

cmd.exe

conhost.exe

wuauclt.exe

wfica32.exe

wlrmdr.exe

TrustedInstall

wfica32.exe

notepad.exe

iexplore.exe

wmplayer.exe

VISIO.EXE

mspaint.exe

svchost.exe

sppsvc.exe

windbg.exe

mmc.exe

LogonUI.exe

taskeng.exe

NotMyfault.exe
Very good so far. I’m learning now Python language to write more interesting scripts for crash dump analysis pattern diagnostics, mining statistics, formatting and visualization. After browsing Amazon for some time I chose this book for study:
A Primer on Scientific Programming with Python

About 5 or 6 years ago I was thinking about using a Prolog interpreter to write an expert system for crash dump analysis. I even wrote a simple Prolog program to match product hotfixes and was contemplating writing a WinDbg extension especially after I learnt that SWI-Prolog system I used had an interpreter DLL that could be dynamically loaded into a Win32 API application.
- Dmitry Vostokov @ DumpAnalysis.org + TraceAnalysis.org -
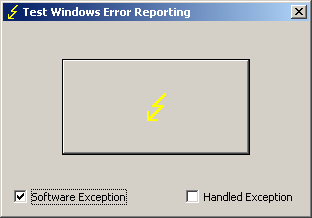
TestDefaultDebugger has been updated to version 2.0 with the following new features:
- Renamed to TestWER to reflect the shift from default debuggers to WER and LocalDumps (W2K8, Vista and Windows 7)
- The ability to generate software exceptions (by default TestWER generates hardware NULL pointer access violation exception)
- An option to handle generated exceptions (hardware and software) to test such scenarios
- Symbol PDB files are included in the package
Here’s an example stack trace when we select a software exception option and push the big button:
0:000> !analyze -v
[...]
EXCEPTION_RECORD:  0012f4a4 -- (.exr 0x12f4a4)

ExceptionAddress: 7742fbae (kernel32!RaiseException+0x00000058)

   ExceptionCode: e06d7363 (C++ EH exception)

  ExceptionFlags: 00000001

NumberParameters: 3

   Parameter[0]: 19930520

   Parameter[1]: 0012f83c

   Parameter[2]: 00428ef8

  pExceptionObject: 0012f83c

  _s_ThrowInfo    : 00428ef8

  Type            : int
[...]
0:000> k

ChildEBP RetAddr

0012edb4 775c5610 ntdll!KiFastSystemCallRet

0012edb8 7743a5d7 ntdll!NtWaitForMultipleObjects+0xc

0012ee54 7743a6f0 kernel32!WaitForMultipleObjectsEx+0x11d

0012ee70 774ae2a5 kernel32!WaitForMultipleObjects+0x18

0012eedc 774ae4d1 kernel32!WerpReportFaultInternal+0x16d

0012eef0 7748ff4d kernel32!WerpReportFault+0x70

0012ef7c 004187ee kernel32!UnhandledExceptionFilter+0x1b5

0012f2b4 004161e8 TestWER!abort+0x10f

0012f2e4 004130cb TestWER!terminate+0x33

0012f2ec 7748febe TestWER!__CxxUnhandledExceptionFilter+0x3c

0012f374 775d7fc1 kernel32!UnhandledExceptionFilter+0x127

0012f37c 77569bdc ntdll!__RtlUserThreadStart+0x6f

0012f390 77564067 ntdll!_EH4_CallFilterFunc+0x12

0012f3b8 775c5f79 ntdll!_except_handler4+0x8e

0012f3dc 775c5f4b ntdll!ExecuteHandler2+0x26

0012f48c 775c5dd7 ntdll!ExecuteHandler+0x24

0012f48c 7742fbae ntdll!KiUserExceptionDispatcher+0xf

0012f7e0 00412ac2 kernel32!RaiseException+0×58

0012f818 0041ff1f TestWER!_CxxThrowException+0×48

0012f85c 00403620 TestWER!CTestDefaultDebuggerDlg::OnBnClickedButton1+0xaf

0012f86c 0040382f TestWER!_AfxDispatchCmdMsg+0×45

0012f89c 00402df6 TestWER!CCmdTarget::OnCmdMsg+0×11c

0012f8c0 00409ef8 TestWER!CDialog::OnCmdMsg+0×1d

0012f910 0040a792 TestWER!CWnd::OnCommand+0×92

0012f9ac 00406dea TestWER!CWnd::OnWndMsg+0×36

0012f9cc 00409713 TestWER!CWnd::WindowProc+0×24

0012fa34 004097a2 TestWER!AfxCallWndProc+0×9a

0012fa54 7716fd72 TestWER!AfxWndProc+0×36

0012fa80 7716fe4a user32!InternalCallWinProc+0×23

0012faf8 77170943 user32!UserCallWinProcCheckWow+0×14b

0012fb38 77170b36 user32!SendMessageWorker+0×4b7

0012fb58 747eb4ba user32!SendMessageW+0×7c

0012fb78 747eb51c comctl32!Button_NotifyParent+0×3d

0012fb94 747eb627 comctl32!Button_ReleaseCapture+0×112

0012fbf4 7716fd72 comctl32!Button_WndProc+0xa98

0012fc20 7716fe4a user32!InternalCallWinProc+0×23

0012fc98 7717018d user32!UserCallWinProcCheckWow+0×14b

0012fcfc 7717022b user32!DispatchMessageWorker+0×322

0012fd0c 771651f5 user32!DispatchMessageW+0xf

0012fd30 0040618c user32!IsDialogMessageW+0×586

0012fd44 004071e2 TestWER!CWnd::IsDialogMessageW+0×32

0012fd50 00402dd3 TestWER!CWnd::PreTranslateInput+0×2d

0012fd64 00408dc1 TestWER!CDialog::PreTranslateMessage+0×9a

0012fd78 00403f35 TestWER!CWnd::WalkPreTranslateTree+0×23

0012fd90 00404090 TestWER!AfxInternalPreTranslateMessage+0×41

0012fd9c 00403f80 TestWER!CWinThread::PreTranslateMessage+0xd

0012fda8 004040dd TestWER!AfxPreTranslateMessage+0×19

0012fdb8 00408598 TestWER!AfxInternalPumpMessage+0×2d

0012fde0 00403440 TestWER!CWnd::RunModalLoop+0xc5

0012fe2c 004204ee TestWER!CDialog::DoModal+0×12d

0012fee4 0041fdf5 TestWER!CTestDefaultDebuggerApp::InitInstance+0xce

0012fef8 0040fc3e TestWER!AfxWinMain+0×48

0012ff88 7743d0e9 TestWER!__tmainCRTStartup+0×112

0012ff94 775a19bb kernel32!BaseThreadInitThunk+0xe

0012ffd4 775a198e ntdll!__RtlUserThreadStart+0×23

0012ffec 00000000 ntdll!_RtlUserThreadStart+0×1b
Here’s WinDbg output when we choose to handle exceptions:
0:001> g

(628.a90): Access violation - code c0000005 (first chance)

First chance exceptions are reported before any exception handling.

This exception may be expected and handled.

TestWER64!CTestDefaultDebuggerDlg::OnBnClickedButton1+0×44:

00000001`40024774 c704250000000000000000 mov dword ptr [0],0 ds:00000000`00000000=????????
0:000> g

(628.a90): C++ EH exception - code e06d7363 (first chance)
You can download TestWER package from Citrix support web site:
- Dmitry Vostokov @ DumpAnalysis.org + TraceAnalysis.org -
When reading and analyzing software traces we always compare them to Master Trace. Another name for this pattern borrowed from narrative theory is Archetype. When looking at the software trace from a system we either know the correct sequence of Activity Regions, expect certain Background and Foreground Components, Event Sequence Order or mentally construct a model based on our experience and Implementation Discourse. For the latter example software engineers internalize software master narratives when they construct code and write tracing code for supportability. For the former example it is important to have a repository of traces corresponding to master traces. This helps in finding deviations after Bifurcation Point. Consider such comparisons similar to regression testing when we check the computation output against the expected prerecorded sequence.
- Dmitry Vostokov @ DumpAnalysis.org + TraceAnalysis.org -
Our sponsor, Memory Dump Analysis Services has published common questions and answers regarding their operation and competitive advantage over traditional software support organizations:
http://www.dumpanalysis.com/common-qa
I like their bold statement that they don’t have any competitors because they are one step further by providing an audit. This reminds me the statement I learnt from school: Marxism is all powerful because it is true.
- Dmitry Vostokov @ DumpAnalysis.org + TraceAnalysis.org -
Similar to Message Box and String Parameter patterns we also have Dialog Box pattern (I’m grateful to Etienne Jeanneau for this suggestion) where we can see dialog window caption and contents when we examine function parameters (I guess this information comes from dialog box template). Although in the examples below we know the dialog purpose from friendly call stack function names for many 3rd-party applications we either don’t have symbols or no such helper functions but we want to know what was on the screen when screenshots were not collected.
The first 2 examples are from notepad and the 3rd is from IE:
0:000> kv

ChildEBP RetAddr  Args to Child

0017f5c4 777b073f 777c3c9f 000d023c 00000001 ntdll!KiFastSystemCallRet

0017f5c8 777c3c9f 000d023c 00000001 00000000 user32!NtUserWaitMessage+0xc

0017f5fc 777c2dc0 00310778 000d023c 00000001 user32!DialogBox2+0x202

0017f624 777c2eec 76460000 02a6bc60 000d023c user32!InternalDialogBox+0xd0

0017f644 76489a65 76460000 02a6bc60 000d023c user32!DialogBoxIndirectParamAorW+0×37

0017f680 76489ccf 0017f68c 00000001 0017f6d4 comdlg32!ChooseFontX+0×1ba

0017f6bc 006741c7 0017f6d4 00000111 00000000 comdlg32!ChooseFontW+0×2e

0017f734 0067164a 000d023c 00000021 00000000 notepad!NPCommand+0×4c7

0017f758 777afd72 000d023c 00000111 00000021 notepad!NPWndProc+0×4cf

0017f784 777afe4a 0067146c 000d023c 00000111 user32!InternalCallWinProc+0×23

0017f7fc 777b018d 00000000 0067146c 000d023c user32!UserCallWinProcCheckWow+0×14b

0017f860 777b022b 0067146c 00000000 0017f8a4 user32!DispatchMessageWorker+0×322

0017f870 00671465 0017f888 00000000 0067a21c user32!DispatchMessageW+0xf

0017f8a4 0067195d 00670000 00000000 00231cfa notepad!WinMain+0xe3

0017f934 7652d0e9 7ffd9000 0017f980 77b019bb notepad!_initterm_e+0×1a1

0017f940 77b019bb 7ffd9000 78f7b908 00000000 kernel32!BaseThreadInitThunk+0xe

0017f980 77b0198e 006731ed 7ffd9000 00000000 ntdll!__RtlUserThreadStart+0×23

0017f998 00000000 006731ed 7ffd9000 00000000 ntdll!_RtlUserThreadStart+0×1b
0:000> dc 02a6bc60 l50

02a6bc60  80c800c4 00000000 000d0014 011f0036  ............6...

02a6bc70  000000c4 00460000 006e006f 00000074  ......F.o.n.t…

02a6bc80  004d0008 00200053 00680053 006c0065  ..M.S. .S.h.e.l.

02a6bc90  0020006c 006c0044 00000067 50020000  l. .D.l.g……P

02a6bca0  00000000 00070007 00090028 ffff0440  ……..(…@…

02a6bcb0  00260082 006f0046 0074006e 0000003a  ..&.F.o.n.t.:…

02a6bcc0  00000000 50210b51 00000000 00100007  ….Q.!P……..

02a6bcd0  004c0062 ffff0470 00000085 00000000  b.L.p………..

02a6bce0  50020000 00000000 0007006e 0009002c  …P….n…,…

02a6bcf0  ffff0441 00460082 006e006f 00200074  A…..F.o.n.t. .

02a6bd00  00740073 00790026 0065006c 0000003a  s.t.&.y.l.e.:…

02a6bd10  00000000 50210041 00000000 0010006e  ….A.!P….n…

02a6bd20  004c004a ffff0471 00000085 00000000  J.L.q………..

02a6bd30  50020000 00000000 000700bd 0009001e  …P…………

02a6bd40  ffff0442 00260082 00690053 0065007a  B…..&.S.i.z.e.

02a6bd50  0000003a 00000000 50210b51 00000000  :…….Q.!P….

02a6bd60  001000be 004c0024 ffff0472 00000085  ….$.L.r…….

02a6bd70  00000000 50020007 00000000 00610007  …….P……a.

02a6bd80  00480062 ffff0430 00450080 00660066  b.H.0…..E.f.f.

02a6bd90  00630065 00730074 00000000 50010003  e.c.t.s……..P
0:000> kv

ChildEBP RetAddr  Args to Child

0017f5a8 777b073f 777c3c9f 000d023c 00000001 ntdll!KiFastSystemCallRet

0017f5ac 777c3c9f 000d023c 00000001 00000000 user32!NtUserWaitMessage+0xc

0017f5e0 777c2dc0 0044034a 000d023c 00000001 user32!DialogBox2+0x202

0017f608 777c2eec 768a0000 029030bc000d023c user32!InternalDialogBox+0xd0

0017f628 777c10ef 768a0000 029030bc 000d023c user32!DialogBoxIndirectParamAorW+0×37

0017f64c 7695d877 768a0000 00003810 000d023c user32!DialogBoxParamW+0×3f

0017f670 76a744dc 768a0000 00003810 000d023c shell32!SHFusionDialogBoxParam+0×32

0017f6b0 00674416 000d023c 002530dc 00672fc4 shell32!ShellAboutW+0×4d

0017f734 0067164a 000d023c 00000041 00000000 notepad!NPCommand+0×718

0017f758 777afd72 000d023c 00000111 00000041 notepad!NPWndProc+0×4cf

0017f784 777afe4a 0067146c 000d023c 00000111 user32!InternalCallWinProc+0×23

0017f7fc 777b018d 00000000 0067146c 000d023c user32!UserCallWinProcCheckWow+0×14b

0017f860 777b022b 0067146c 00000000 0017f8a4 user32!DispatchMessageWorker+0×322

0017f870 00671465 0017f888 00000000 0067a21c user32!DispatchMessageW+0xf

0017f8a4 0067195d 00670000 00000000 00231cfa notepad!WinMain+0xe3

0017f934 7652d0e9 7ffd9000 0017f980 77b019bb notepad!_initterm_e+0×1a1

0017f940 77b019bb 7ffd9000 78f7b908 00000000 kernel32!BaseThreadInitThunk+0xe

0017f980 77b0198e 006731ed 7ffd9000 00000000 ntdll!__RtlUserThreadStart+0×23

0017f998 00000000 006731ed 7ffd9000 00000000 ntdll!_RtlUserThreadStart+0×1b
0:000> dc 029030bc l50

029030bc  ffff0001 00000000 00000000 80c800cc  ................

029030cc  0014000c 01130014 000000ee 00410000  ..............A.

029030dc  006f0062 00740075 00250020 00000073  b.o.u.t. .%.s…

029030ec  00000008 004d0000 00200053 00680053  ……M.S. .S.h.

029030fc  006c0065 0020006c 006c0044 00000067  e.l.l. .D.l.g…

0290310c  00000000 00000000 50000043 00370007  ……..C..P..7.

0290311c  00140015 00003009 0082ffff 0000ffff  …..0……….

0290312c  00000000 00000000 00000000 5000008c  ……………P

0290313c  00370023 000a00c8 00003500 0082ffff  #.7……5……

0290314c  00000000 00000000 00000000 5000008c  ……………P

0290315c  00410023 000a00eb 0000350b 0082ffff  #.A……5……

0290316c  00000000 00000000 00000000 50000080  ……………P

0290317c  004b0023 000a00d2 0000350a 0082ffff  #.K……5……

0290318c  00000000 00000000 00000000 50000080  ……………P

0290319c  00550023 002800d2 00003513 0082ffff  #.U…(..5……

029031ac  00680054 00200065 00570025 004e0049  T.h.e. .%.W.I.N.

029031bc  004f0044 00530057 004c005f 004e004f  D.O.W.S._.L.O.N.

029031cc  00250047 006f0020 00650070 00610072  G.%. .o.p.e.r.a.

029031dc  00690074 0067006e 00730020 00730079  t.i.n.g. .s.y.s.

029031ec  00650074 0020006d 006e0061 00200064  t.e.m. .a.n.d. .
  16  Id: 10fc.124c Suspend: 0 Teb: 7ffd7000 Unfrozen

ChildEBP RetAddr  Args to Child

053f8098 777b073f 777c3c9f 003d0650 00000001 ntdll!KiFastSystemCallRet

053f809c 777c3c9f 003d0650 00000001 00000000 user32!NtUserWaitMessage+0xc

053f80d0 777c2dc0 002e0378 003d0650 00000001 user32!DialogBox2+0x202

053f80f8 777c2eec 6f270000 03387bd4 003d0650 user32!InternalDialogBox+0xd0

053f8118 777c10ef 6f270000 03387bd4 003d0650 user32!DialogBoxIndirectParamAorW+0×37

053f813c 6f2c5548 6f270000 00005398 003d0650 user32!DialogBoxParamW+0×3f

053f8164 6f2c5743 6f270000 00005398 003d0650 ieframe!Detour_DialogBoxParamW+0×47

053f8188 6f2c56f5 6f270000 00005398 001905ea ieframe!SHFusionDialogBoxParam+0×32

053f9228 6f2c5378 001905ea 053fb540 00000104 ieframe!DoAddToFavDlgEx+0xcf

053fbb5c 6f2c58f9 001905ea 0e69a0c0 053fbff0 ieframe!AddToFavoritesEx+0×349

053fbdb8 6f2c57ee 00000000 053fbff0 00000000 ieframe!CBaseBrowser2::_AddToFavorites+0xe9

053fc0f4 6f2c3e5e 00000000 00000000 00000001 ieframe!CBaseBrowser2::_ExecAddToFavorites+0×123

053fc124 6f39ca4e 6f39c524 00000008 00000001 ieframe!CBaseBrowser2::_ExecExplorer+0xbe

053fc14c 6f39cee8 114ea39c 6f39c524 00000008 ieframe!CBaseBrowser2::Exec+0×12d

053fc17c 6f39cf17 6f39c524 00000008 00000001 ieframe!CShellBrowser2::_Exec_CCommonBrowser+0×80

053fc414 6f498284 114ea39c 6f39c524 00000008 ieframe!CShellBrowser2::Exec+0×626

053fc43c 6f49e5cd 0000a173 00000000 ffffff71 ieframe!CShellBrowser2::_FavoriteOnCommand+0×75

053fc458 6f3c5ea8 0000a173 00000000 00000111 ieframe!CShellBrowser2::_OnDefault+0×3e

053fd6f0 6f394194 0000a173 00000000 0000031a ieframe!CShellBrowser2::v_OnCommand+0xa7b

053fd70c 6f39898d 001905ea 00000111 0000a173 ieframe!CBaseBrowser2::v_WndProc+0×247

053fd770 6f3988db 001905ea 00000111 0000a173 ieframe!CShellBrowser2::v_WndProc+0×3fe

053fd794 777afd72 001905ea 00000111 0000a173 ieframe!CShellBrowser2::s_WndProc+0xfb

053fd7c0 777afe4a 6f39887a 001905ea 00000111 user32!InternalCallWinProc+0×23

053fd838 777b0943 00000000 6f39887a 001905ea user32!UserCallWinProcCheckWow+0×14b

053fd878 777b0b36 00252838 01223dc0 0000a173 user32!SendMessageWorker+0×4b7

053fd898 6f3cf032 001905ea 00000111 0000a173 user32!SendMessageW+0×7c

053fd8d0 6f396ead 0056049c 00000111 0000a173 ieframe!CInternetToolbarHost::v_WndProc+0xf8

053fd8f4 777afd72 0056049c 00000111 0000a173 ieframe!CImpWndProc::s_WndProc+0×65

053fd920 777afe4a 6f396e6e 0056049c 00000111 user32!InternalCallWinProc+0×23

053fd998 777b018d 00000000 6f396e6e 0056049c user32!UserCallWinProcCheckWow+0×14b

053fd9fc 777b022b 6f396e6e 00000000 053ffb14 user32!DispatchMessageWorker+0×322

053fda0c 6f39c1f5 053fda30 00000000 10eec4c0 user32!DispatchMessageW+0xf

053ffb14 6f34337f 0e7c3708 00000000 11bd8dc8 ieframe!CTabWindow::_TabWindowThreadProc+0×54c

053ffbcc 77525179 10eec4c0 00000000 053ffbe8 ieframe!LCIETab_ThreadProc+0×2c1

053ffbdc 7652d0e9 11bd8dc8 053ffc28 77b019bb iertutil!CIsoScope::RegisterThread+0xab

053ffbe8 77b019bb 11bd8dc8 7dd62326 00000000 kernel32!BaseThreadInitThunk+0xe

053ffc28 77b0198e 7752516b 11bd8dc8 00000000 ntdll!__RtlUserThreadStart+0×23

053ffc40 00000000 7752516b 11bd8dc8 00000000 ntdll!_RtlUserThreadStart+0×1b
0:000> dc 03387bd4 l50

03387bd4  ffff0001 00000000 00000000 80c808c0  ................

03387be4  0000000a 011f0000 00000064 00410000  ........d.....A.

03387bf4  00640064 00610020 00460020 00760061  d.d. .a. .F.a.v.

03387c04  0072006f 00740069 00000065 00000008  o.r.i.t.e…….

03387c14  004d0000 00200053 00680053 006c0065  ..M.S. .S.h.e.l.

03387c24  0020006c 006c0044 00000067 00000000  l. .D.l.g…….

03387c34  00000000 50000003 0007000f 00140015  …….P……..

03387c44  00009760 0082ffff 00bfffff 00000000  `……………

03387c54  00000000 00000000 50020000 00070035  ………..P5…

03387c64  000800db 000003f4 0082ffff 00640041  …………A.d.

03387c74  00200064 00200061 00610046 006f0076  d. .a. .F.a.v.o.

03387c84  00690072 00650074 00000000 00000000  r.i.t.e………

03387c94  00000000 50020000 00110035 001000db  …….P5…….

03387ca4  000003f5 0082ffff 00640041 00200064  ……..A.d.d. .

03387cb4  00680074 00730069 00770020 00620065  t.h.i.s. .w.e.b.

03387cc4  00610070 00650067 00610020 00200073  p.a.g.e. .a.s. .

03387cd4  00200061 00610066 006f0076 00690072  a. .f.a.v.o.r.i.

03387ce4  00650074 0020002e 006f0054 00610020  t.e… .T.o. .a.

03387cf4  00630063 00730065 00200073 006f0079  c.c.e.s.s. .y.o.

03387d04  00720075 00660020 00760061 0072006f  u.r. .f.a.v.o.r.
Stack traces with DialogBoxIndirectParam call and x64 complicates the picture a bit and are subject of another post. Please also note that a user might not see the dialog box you see on a stack trace due to many reasons like terminal session problems or a process running in a non-interactive session.
- Dmitry Vostokov @ DumpAnalysis.org + TraceAnalysis.org -
This is the 3rd revision of memory map visualization tools list where I include IDA Pro and a visualizer from Debug Analyzer.NET (every category is presented in chronological order of my encounter with links):
1. Synthetic
2. Natural
a. Static
b. Semi-dynamic
c. Dynamic
Please let me know any other approaches or links you know.
- Dmitry Vostokov @ DumpAnalysis.org + TraceAnalysis.org -
Today we introduce an icon for Blocked Thread (software) pattern:
B/W

Color

- Dmitry Vostokov @ DumpAnalysis.org + TraceAnalysis.org -
The Window of Opportunity - WYSIWYG. Requires scrolling or search to get most of it.
Examples: He opened a log file in notepad and was staring at it with disbelief. There was no error. After some time he closed the window of opportunity.
- Dmitry Vostokov @ DumpAnalysis.org + TraceAnalysis.org -
Dump - The last hope.
Examples: He was so desperate on site to ask whether a complete dump will do.
- Dmitry Vostokov @ DumpAnalysis.org + TraceAnalysis.org -
Pre-analysis - Avoiding crash dump analysis anti-patterns like wrong dump or zippocricy. Sometimes it goes with wild explanation no one asked for. Checking whether a software trace is empty before sending it.
Examples: He is always doing !locks pre-analysis before sending any dump.
- Dmitry Vostokov @ DumpAnalysis.org + TraceAnalysis.org -
Software trace analysis is difficult and it is very common to hear “couldn’t see anything …”. One of advantages of software trace analysis patterns is that we can use that pattern language to write analysis reports. Here I provide an example for an analysis of a CDF trace from Citrix XenApp server. Instead of replying “didn’t find anything suspicious …” an engineer identified the following patterns:
Seeing the list of patterns it was much easier to ask questions to aid in further troubleshooting.
- Dmitry Vostokov @ DumpAnalysis.org + TraceAnalysis.org -
Debugging is defaulting.
Dmitry Vostokov, “It’s time to stop faulting!” programme from the independent Irish political candidate for the next general election who was writing programs in the past
- Dmitry Vostokov @ DumpAnalysis.org + TraceAnalysis.org -
A memory dump “analysis is never finished, it is only abandoned”
- Dmitry Vostokov @ DumpAnalysis.org + TraceAnalysis.org -
Memory Dump Analysis Services announces the launch of CollaborativeA3System for its new and existing customers:
“… is a way to report and discuss memory dump analysis using using well-known and time-proven iterative and incremental processes. Several corporate users can view, comment on and learn various aspects of an analysis report gradually improving initial preliminary analysis to its final deliverable form.”
Source: http://www.dumpanalysis.com/collaborative-analysis-audit-access-system
- Dmitry Vostokov @ DumpAnalysis.org + TraceAnalysis.org -
