CDF Traces: Using Performance Analyzer

April 12th, 2008

Because Citrix CDF traces are ETW based it should be possible to process and analyze them using XPrerf and XPerfView from the latest Microsoft Windows Performance Tools:

Windows Performance Tools Kit, v.4.1.1

- Dmitry Vostokov @ DumpAnalysis.org -

Crash Dump Analysis Patterns (Part 58a)

April 9th, 2008

Among various memory leaks leading to Insufficient Memory pattern there is so called session pool leak briefly touched in the previous kernel pool leaks post. I decided to factor it out separately because it also involves GDI handles and structures allocated per user session that has the limit on how many of them can be created and this case should rather be called Handle Limit. Such leaks can result in poor visual application behavior after some time when drawing requests are not satisfied anymore. In severe cases, when the same bugs are present in a display driver, it can result in bugchecks like

BugCheck AB: SESSION_HAS_VALID_POOL_ON_EXIT

or, if a handle allocation request was not satisfied, it may result in a NULL pointer stored somewhere with the subsequent Invalid Pointer access:

SYSTEM_THREAD_EXCEPTION_NOT_HANDLED (7e)

CONTEXT:  b791e010 -- (.cxr 0xffffffffb791e010)
eax=00000000 ebx=bc43d004 ecx=a233add8 edx=00000000 esi=bc430fff edi=00000000
eip=bfe7d380 esp=b791e3dc ebp=b791e480 iopl=0 nv up ei pl zr na pe nc
cs=0008 ss=0010 ds=0023 es=0023 fs=0030 gs=0000 efl=00010246
DisplayDriver+0×3e380:
bfe7d380 8a4702          mov     al,byte ptr [edi+2]        ds:0023:00000002=??

Rather than providing examples from specific kernel dump files I created 3 Win32 applications in Visual C++ that simulate GDI leaks. All of them create GDI objects in a loop and select them into their current graphics device context (DC) on Windows Server 2003 x64 SP2. Before running them I got the following session paged pool statistics:

lkd> !poolused c

   Sorting by Session Paged Pool Consumed

  Pool Used:
            NonPaged            Paged
 Tag    Allocs     Used    Allocs     Used
 NV_x        0        0         5 14024704 UNKNOWN pooltag 'NV_x', please update pooltag.txt
 BIG         0        0       257  3629056 Large session pool allocations (ntos\ex\pool.c) , Binary: nt!mm
 NV          0        0       203  1347648 nVidia video driver
 Ttfd        0        0       233  1053152 TrueType Font driver
 Gh05        0        0       391  1050400 Gdi Handle manager specific object types: defined in w32\ntgdi\inc\ntgdistr.h , Binary: win32k.sys
 Gla1        0        0       348   785088 Gdi handle manager specific object types allocated from lookaside memory: defined in w32\ntgdi\inc\ntgdistr.h , Binary: win32k.sys
 Gcac        0        0        25   640880 Gdi glyph cache
 Gla5        0        0       631   323072 Gdi handle manager specific object types allocated from lookaside memory: defined in w32\ntgdi\inc\ntgdistr.h , Binary: win32k.sys
 Gdrs        0        0        33   172288 Gdi GDITAG_DRVSUP
 Gla:        0        0       212   139072 Gdi handle manager specific object types allocated from lookaside memory: defined in w32\ntgdi\inc\ntgdistr.h , Binary: win32k.sys
 Gla4        0        0       487   116880 Gdi handle manager specific object types allocated from lookaside memory: defined in w32\ntgdi\inc\ntgdistr.h , Binary: win32k.sys
 Usti        0        0       148    97088 THREADINFO , Binary: win32k!AllocateW32Thread
 Gla8        0        0       383    91920 Gdi handle manager specific object types allocated from lookaside memory: defined in w32\ntgdi\inc\ntgdistr.h , Binary: win32k.sys
 Gla@        0        0       339    70512 Gdi handle manager specific object types allocated from lookaside memory: defined in w32\ntgdi\inc\ntgdistr.h , Binary: win32k.sys
 Gbaf        0        0        48    67584 UNKNOWN pooltag ‘Gbaf’, please update pooltag.txt
 knlf        0        0        20    66496 UNKNOWN pooltag ‘knlf’, please update pooltag.txt
 GDev        0        0         7    57344 Gdi pdev
 Usqu        0        0       152    53504 Q , Binary: win32k!InitQEntryLookaside
 Uscu        0        0       334    53440 CURSOR , Binary: win32k!_CreateEmptyCursorObject
 Bmfd        0        0        21    50224 Font related stuff
 Uspi        0        0       153    40000 PROCESSINFO , Binary: win32k!MapDesktop
 Gfnt        0        0        47    39856 UNKNOWN pooltag ‘Gfnt’, please update pooltag.txt
 Ggb         0        0        34    39088 Gdi glyph bits
 Gh08        0        0        33    38656 Gdi Handle manager specific object types: defined in w32\ntgdi\inc\ntgdistr.h , Binary: win32k.sys
 Ghab        0        0       228    32832 Gdi Handle manager specific object types: defined in w32\ntgdi\inc\ntgdistr.h , Binary: win32k.sys
 Ovfl        0        0         1    32768 The internal pool tag table has overflowed - usually this is a result of nontagged allocations being made
 Gpff        0        0        88    27712 Gdi physical font file
 Gpfe        0        0        88    27600 UNKNOWN pooltag ‘Gpfe’, please update pooltag.txt
 thdd        0        0         1    20480 DirectDraw/3D handle manager table
 Gebr        0        0        17    19776 Gdi ENGBRUSH
 Gh0@        0        0        86    19264 Gdi Handle manager specific object types: defined in w32\ntgdi\inc\ntgdistr.h , Binary: win32k.sys
 Gsp         0        0        79    18960 Gdi sprite
 HT40        0        0         2    16384 UNKNOWN pooltag ‘HT40′, please update pooltag.txt
 Gpat        0        0         4    16192 UNKNOWN pooltag ‘Gpat’, please update pooltag.txt
 Ggls        0        0       169    12944 Gdi glyphset
 Glnk        0        0       371    11872 Gdi PFELINK
 Gldv        0        0         9    11248 Gdi Ldev
 Gffv        0        0        84     9408 Gdi FONTFILEVIEW
 Gfsb        0        0         1     8192 Gdi font sustitution list
 Uskt        0        0         2     7824 KBDTABLE , Binary: win32k!ReadLayoutFile
 Gh04        0        0         7     5856 Gdi Handle manager specific object types: defined in w32\ntgdi\inc\ntgdistr.h , Binary: win32k.sys
 Gdcf        0        0        51     5712 UNKNOWN pooltag ‘Gdcf’, please update pooltag.txt
 Gh0<        0        0        88     5632 Gdi Handle manager specific object types: defined in w32\ntgdi\inc\ntgdistr.h , Binary: win32k.sys
 Gglb        0        0         1     4096 Gdi temp buffer
 Ustm        0        0        30     3360 TIMER , Binary: win32k!InternalSetTimer
 Gspm        0        0        39     3120 UNKNOWN pooltag ‘Gspm’, please update pooltag.txt
 Usac        0        0        16     3056 ACCEL , Binary: win32k!_CreateAcceleratorTable
 Usqm        0        0        25     2800 QMSG , Binary: win32k!InitQEntryLookaside
 Ghas        0        0         3     2592 Gdi Handle manager specific object types: defined in w32\ntgdi\inc\ntgdistr.h , Binary: win32k.sys
 Uscl        0        0        20     2128 CLASS , Binary: win32k!ClassAlloc
 Uswl        0        0         1     2032 WINDOWLIST , Binary: win32k!BuildHwndList
 Gmul        0        0        19     1520 UNKNOWN pooltag ‘Gmul’, please update pooltag.txt
 Dddp        0        0         8     1472 UNKNOWN pooltag ‘Dddp’, please update pooltag.txt
 Ggdv        0        0         8     1472 Gdi GDITAG_GDEVICE
 UsDI        0        0         4     1408 DEVICEINFO , Binary: win32k!CreateDeviceInfo
 Vtfd        0        0         4     1312 Font file/context
 Ushk        0        0        20     1280 HOTKEY , Binary: win32k!_RegisterHotKey
 Gspr        0        0         3     1264 Gdi sprite grow range
 Gtmw        0        0        13     1248 Gdi TMW_INTERNAL
 Gxlt        0        0         8     1152 Gdi Xlate
 Gpft        0        0         2      944 Gdi font table
 Uspp        0        0         5      944 PNP , Binary: win32k!AllocateAndLinkHidTLCInf
 Ussm        0        0         7      896 SMS , Binary: win32k!InitSMSLookaside
 Gdbr        0        0        10      800 Gdi driver brush realization
 Usdc        0        0         8      768 DCE , Binary: win32k!CreateCacheDC
 Usct        0        0        12      768 CHECKPT , Binary: win32k!CkptRestore
 Usim        0        0         2      736 IME , Binary: win32k!CreateInputContext
 Usci        0        0         3      720 CLIENTTHREADINFO , Binary: win32k!InitSystemThread
 Gh09        0        0         1      640 Gdi Handle manager specific object types: defined in w32\ntgdi\inc\ntgdistr.h , Binary: win32k.sys
 Ussy        1       80         4      608 SYSTEM , Binary: win32k!xxxDesktopThread
 Urdr        0        0         9      576 REDIRECT , Binary: win32k!SetRedirectionBitmap
 Uswd        0        0         2      576 WINDOW , Binary: win32k!xxxCreateWindowEx
 Uscb        0        0         3      544 CLIPBOARD , Binary: win32k!_ConvertMemHandle
 Gcsl        0        0         1      496 Gdi string resource script names
 Ustx        0        0        10      496 TEXT , Binary: win32k!NtUserDrawCaptionTemp
 Ussw        0        0         1      496 SWP , Binary: win32k!_BeginDeferWindowPos
 Gdev        0        0         2      480 Gdi GDITAG_DEVMODE
 Usih        0        0        10      480 IMEHOTKEY , Binary: win32k!SetImeHotKey
 Gdrv        0        0         1      368 UNKNOWN pooltag ‘Gdrv’, please update pooltag.txt
 GVdv        0        0         1      320 UNKNOWN pooltag ‘GVdv’, please update pooltag.txt
 Gmap        0        0         1      320 Gdi font map signature table
 Uskb        0        0         2      288 KBDLAYOUT , Binary: win32k!xxxLoadKeyboardLayoutEx
 Uskf        0        0         2      288 KBDFILE , Binary: win32k!LoadKeyboardLayoutFile
 Uswe        0        0         2      224 WINEVENT , Binary: win32k!_SetWinEventHook
 Gddf        0        0         2      224 Gdi ddraw driver heaps
 Gddv        0        0         2      192 Gdi ddraw driver video memory list
 GFil        0        0         2      192 Gdi engine descriptor list
 Gdwd        0        0         2       96 Gdi watchdog support objects , Binary: win32k.sys
 Usd9        0        0         1       80 DDE9 , Binary: win32k!xxxCsDdeInitialize
 Gvds        0        0         1       64 UNKNOWN pooltag ‘Gvds’, please update pooltag.txt
 GreA        0        0         1       64 UNKNOWN pooltag ‘GreA’, please update pooltag.txt
 Usse        0        0         1       48 SECURITY , Binary: win32k!SetDisconnectDesktopSecu
 Usvl        0        0         1       48 VWPL , Binary: win32k!VWPLAdd
 Mdxg        1      112         0        0 UNKNOWN pooltag ‘Mdxg’, please update pooltag.txt
 Gini        3      128         0        0 Gdi fast mutex
 Usev        1       64         0        0 EVENT , Binary: win32k!xxxPollAndWaitForSingleO
 Gdde        3      240         0        0 Gdi ddraw event
 TOTAL           9      624      6256 24408704

The first application leaks fonts:

LRESULT CALLBACK WndProc(HWND hWnd, UINT message, WPARAM wParam, LPARAM lParam)
{
 int wmId, wmEvent;
 PAINTSTRUCT ps;
 HDC hdc;

 switch (message)
 {
   case WM_PAINT:
     hdc = BeginPaint(hWnd, &ps);
     while (true)
     {
        HFONT hf = CreateFont(10, 10, 0, 0, 0, 0, 0, 0, 0, 0, 0, 0, 0, L"Arial");
        SelectObject(ps.hdc, hf);
     }
     EndPaint(hWnd, &ps);
     break;

We clearly see the leak as the greatly increased number of allocations for ”Gla:” pool tag:

  Pool Used:
            NonPaged            Paged
 Tag    Allocs     Used    Allocs     Used
 NV_x        0        0         5 14024704 UNKNOWN pooltag 'NV_x', please update pooltag.txt
 Gla:        0        0     10194  6687264 Gdi handle manager specific object types allocated from lookaside memory: defined in w32\ntgdi\inc\ntgdistr.h , Binary: win32k.sys
 BIG         0        0       248  3690496 Large session pool allocations (ntos\ex\pool.c) , Binary: nt!mm
 NV          0        0       203  1347648 nVidia video driver
 Gh05        0        0       396  1057888 Gdi Handle manager specific object types: defined in w32\ntgdi\inc\ntgdistr.h , Binary: win32k.sys
 Ttfd        0        0       226  1043264 TrueType Font driver

The second application leaks fonts and pens:

LRESULT CALLBACK WndProc(HWND hWnd, UINT message, WPARAM wParam, LPARAM lParam)
{
 int wmId, wmEvent;
 PAINTSTRUCT ps;
 HDC hdc;

 switch (message)
 {
   case WM_PAINT:
     hdc = BeginPaint(hWnd, &ps);
     while (true)
     {
       HFONT hf = CreateFont(10, 10, 0, 0, 0, 0, 0, 0, 0, 0, 0, 0, 0, L"Arial");
       HPEN hp = CreatePen(0, 10, RGB(10, 20, 30));
       SelectObject(ps.hdc, hf);
       SelectObject(ps.hdc, hp);
     }
     EndPaint(hWnd, &ps);
     break;

We see that the roughly the same number of allocations is split between ”Gla:” and “Gh0@” pool tags:

  Pool Used:
            NonPaged            Paged
 Tag    Allocs     Used    Allocs     Used
 NV_x        0        0         5 14024704 UNKNOWN pooltag 'NV_x', please update pooltag.txt
 BIG         0        0       262  3874816 Large session pool allocations (ntos\ex\pool.c) , Binary: nt!mm
 Gla:        0        0      5203  3413168 Gdi handle manager specific object types allocated from lookaside memory: defined in w32\ntgdi\inc\ntgdistr.h , Binary: win32k.sys
 NV          0        0       203  1347648 nVidia video driver
 Gh0@        0        0      5077  1137248 Gdi Handle manager specific object types: defined in w32\ntgdi\inc\ntgdistr.h , Binary: win32k.sys
 Ttfd        0        0       233  1053152 TrueType Font driver

The third program leaks fonts, pens and brushes:

LRESULT CALLBACK WndProc(HWND hWnd, UINT message, WPARAM wParam, LPARAM lParam)
{
 int wmId, wmEvent;
 PAINTSTRUCT ps;
 HDC hdc;

 switch (message)
 {
   case WM_PAINT:
   hdc = BeginPaint(hWnd, &ps);
   while (true)
   {
     HFONT hf = CreateFont(10, 10, 0, 0, 0, 0, 0, 0, 0, 0, 0, 0, 0, L"Arial");
     HPEN hp = CreatePen(0, 10, RGB(10, 20, 30));
     HBRUSH hb = CreateSolidBrush(RGB(10, 20, 30));
     SelectObject(ps.hdc, hf);
     SelectObject(ps.hdc, hp);
     SelectObject(ps.hdc, hb);
   }
   EndPaint(hWnd, &ps);
   break;

Now we see that the same number of allocations is almost equally split between ”Gla:”, “Gh0@” and “Gla@” pool tags:

  Pool Used:
            NonPaged            Paged
 Tag    Allocs     Used    Allocs     Used
 NV_x        0        0         5 14024704 UNKNOWN pooltag 'NV_x', please update pooltag.txt
 BIG         0        0       262  3874816 Large session pool allocations (ntos\ex\pool.c) , Binary: nt!mm
 Gla:        0        0      3539  2321584 Gdi handle manager specific object types allocated from lookaside memory: defined in w32\ntgdi\inc\ntgdistr.h , Binary: win32k.sys
 NV          0        0       203  1347648 nVidia video driver
 Ttfd        0        0       233  1053152 TrueType Font driver
 Gh05        0        0       392  1052768 Gdi Handle manager specific object types: defined in w32\ntgdi\inc\ntgdistr.h , Binary: win32k.sys
 Gla1        0        0       353   796368 Gdi handle manager specific object types allocated from lookaside memory: defined in w32\ntgdi\inc\ntgdistr.h , Binary: win32k.sys
 Gh0@        0        0      3414   764736 Gdi Handle manager specific object types: defined in w32\ntgdi\inc\ntgdistr.h , Binary: win32k.sys
 Gla@        0        0      3665   762320 Gdi handle manager specific object types allocated from lookaside memory: defined in w32\ntgdi\inc\ntgdistr.h , Binary: win32k.sys
 Gcac        0        0        25   640880 Gdi glyph cache

When the certain amount of handles is reached all subsequent GDI Create calls fail and other applications start showing various visual defects. Print screen operation also fails with insufficient memory message.
                                                                                                                                                                                                        
- Dmitry Vostokov @ DumpAnalysis.org -

Jobs: Citrix Global Escalation Engineer

April 5th, 2008

I posted a job ad on the portal:

Citrix Escalation Engineer (Dublin, Ireland)

- Dmitry Vostokov @ DumpAnalysis.org -

Crash Dump Analysis Patterns (Part 57)

April 3rd, 2008

Another pattern that occurs frequently is Hardware Error. This can be internal CPU malfunction due to overheating, RAM or hard disk I/O problem. It usually results in the appropriate bugcheck and the most frequent one is the 6th from the top of Bug Check Frequency Table:

  • BugCheck 9C: MACHINE_CHECK_EXCEPTION

Other relevant bugchecks include:

  • BugCheck 7B: INACCESSIBLE_BOOT_DEVICE

  • BugCheck 77: KERNEL_STACK_INPAGE_ERROR

  • BugCheck 7A: KERNEL_DATA_INPAGE_ERROR

Another bugcheck from this category can also be triggered on purpose to get a crash dump of a hanging or slow system:

Please also note that other popular bugchecks like  

  • BugCheck 7F: UNEXPECTED_KERNEL_MODE_TRAP

  • BugCheck 50: PAGE_FAULT_IN_NONPAGED_AREA

can result from RAM problems but we should try to find a software cause first.

Sometimes the following bugchecks like

  • BugCheck 7E: SYSTEM_THREAD_EXCEPTION_NOT_HANDLED

report EXCEPTION_DOESNOT_MATCH_CODE where read or write address doesn’t correspond to faulted instruction at EIP:

SYSTEM_THREAD_EXCEPTION_NOT_HANDLED (7e)
This is a very common bugcheck. Usually the exception address pinpoints
the driver/function that caused the problem. Always note this address
as well as the link date of the driver/image that contains this address.
Arguments:
Arg1: c0000005, The exception code that was not handled
Arg2: bf802671, The address that the exception occurred at
Arg3: f10b8c74, Exception Record Address
Arg4: f10b88c4, Context Record Address

FAULTING_IP:
driver!AcquireSemaphoreShared+4
bf802671 90 nop

EXCEPTION_RECORD: f10b8c74 -- (.exr fffffffff10b8c74)
ExceptionAddress: bf802671 (driver!AcquireSemaphoreShared+0x00000004)
ExceptionCode: c0000005 (Access violation)
ExceptionFlags: 00000000
NumberParameters: 2
Parameter[0]: 00000001
Parameter[1]: 0000000c
Attempt to write to address 0000000c

CONTEXT: f10b88c4 -- (.cxr fffffffff10b88c4)
eax=884d2d01 ebx=0000000c ecx=00000000 edx=80010031 esi=8851ef60 edi=bc3846d4
eip=bf802671 esp=f10b8d3c ebp=f10b8d70 iopl=0 nv up ei pl nz na po nc
cs=0008 ss=0010 ds=0023 es=0023 fs=0030 gs=0000 efl=00010206
driver!AcquireSemaphoreShared+0x4:
bf802671 90 nop
Resetting default scope

WRITE_ADDRESS: 0000000c

EXCEPTION_DOESNOT_MATCH_CODE: This indicates a hardware error.
Instruction at bf802671 does not read/write to 0000000c

Code mismatch can also happen in user mode but from my experience it usually results from improper Hooked Function or similar corruption: 

EXCEPTION_RECORD: ffffffff -- (.exr 0xffffffffffffffff)
ExceptionAddress: 7c848768 (ntdll!_LdrpInitialize+0x00000184)
ExceptionCode: c0000005 (Access violation)
ExceptionFlags: 00000001
NumberParameters: 0

DEFAULT_BUCKET_ID: CODE_ADDRESS_MISMATCH

WRITE_ADDRESS: f774f120

FAULTING_IP:
ntdll!_LdrpInitialize+184
7c848768 cc int 3

EXCEPTION_DOESNOT_MATCH_CODE: This indicates a hardware error.
Instruction at 7c848768 does not read/write to f774f120

STACK_TEXT:
0012fd14 7c8284c5 0012fd28 7c800000 00000000 ntdll!_LdrpInitialize+0x184
00000000 00000000 00000000 00000000 00000000 ntdll!KiUserApcDispatcher+0x25

In such cases EIP might point to the middle of the expected instruction (Wild Code):

FAULTING_IP:
+59c3659
059c3659 86990508f09b xchg bl,byte ptr [ecx-640FF7FBh]

Here is an example of the real hardware error (note the concatenated error code for bugcheck 0×9C):

MACHINE_CHECK_EXCEPTION (9c)
A fatal Machine Check Exception has occurred.
KeBugCheckEx parameters;
    x86 Processors
        If the processor has ONLY MCE feature available (For example Intel
        Pentium), the parameters are:
        1 - Low  32 bits of P5_MC_TYPE MSR
        2 - Address of MCA_EXCEPTION structure
        3 - High 32 bits of P5_MC_ADDR MSR
        4 - Low  32 bits of P5_MC_ADDR MSR
        If the processor also has MCA feature available (For example Intel
        Pentium Pro), the parameters are:
        1 - Bank number
        2 - Address of MCA_EXCEPTION structure
        3 - High 32 bits of MCi_STATUS MSR for the MCA bank that had the error
        4 - Low  32 bits of MCi_STATUS MSR for the MCA bank that had the error
    IA64 Processors
        1 - Bugcheck Type
            1 - MCA_ASSERT
            2 - MCA_GET_STATEINFO
                SAL returned an error for SAL_GET_STATEINFO while processing MCA.
            3 - MCA_CLEAR_STATEINFO
                SAL returned an error for SAL_CLEAR_STATEINFO while processing MCA.
            4 - MCA_FATAL
                FW reported a fatal MCA.
            5 - MCA_NONFATAL
                SAL reported a recoverable MCA and we don't support currently
                support recovery or SAL generated an MCA and then couldn't
                produce an error record.
            0xB - INIT_ASSERT
            0xC - INIT_GET_STATEINFO
                  SAL returned an error for SAL_GET_STATEINFO while processing INIT event.
            0xD - INIT_CLEAR_STATEINFO
                  SAL returned an error for SAL_CLEAR_STATEINFO while processing INIT event.
            0xE - INIT_FATAL
                  Not used.
        2 - Address of log
        3 - Size of log
        4 - Error code in the case of x_GET_STATEINFO or x_CLEAR_STATEINFO
    AMD64 Processors
        1 - Bank number
        2 - Address of MCA_EXCEPTION structure
        3 - High 32 bits of MCi_STATUS MSR for the MCA bank that had the error
        4 - Low  32 bits of MCi_STATUS MSR for the MCA bank that had the error
Arguments:
Arg1: 00000000
Arg2: 808a07a0
Arg3: be000300
Arg4: 1008081f

Debugging Details:
------------------

   NOTE:  This is a hardware error.  This error was reported by the CPU
   via Interrupt 18.  This analysis will provide more information about
   the specific error.  Please contact the manufacturer for additional
   information about this error and troubleshooting assistance.

   This error is documented in the following publication:

      - IA-32 Intel(r) Architecture Software Developer's Manual
        Volume 3: System Programming Guide

   Bit Mask:

    MA                           Model Specific       MCA
 O  ID      Other Information      Error Code     Error Code
VV  SDP ___________|____________ _______|_______ _______|______
AEUECRC|                        |               |             
LRCNVVC|                        |               |             
^^^^^^^|                        |               |              
   6         5         4         3         2         1
3210987654321098765432109876543210987654321098765432109876543210
----------------------------------------------------------------
1011111000000000000000110000000000010000000010000000100000011111 

VAL   - MCi_STATUS register is valid
        Indicates that the information contained within the IA32_MCi_STATUS
        register is valid.  When this flag is set, the processor follows the
        rules given for the OVER flag in the IA32_MCi_STATUS register when
        overwriting previously valid entries.  The processor sets the VAL
        flag and software is responsible for clearing it.

UC    - Error Uncorrected
        Indicates that the processor did not or was not able to correct the
        error condition.  When clear, this flag indicates that the processor
        was able to correct the error condition.

EN    - Error Enabled
        Indicates that the error was enabled by the associated EEj bit of the
        IA32_MCi_CTL register.

MISCV - IA32_MCi_MISC Register Valid
        Indicates that the IA32_MCi_MISC register contains additional
        information regarding the error.  When clear, this flag indicates
        that the IA32_MCi_MISC register is either not implemented or does
        not contain additional information regarding the error.

ADDRV - IA32_MCi_ADDR register valid
        Indicates that the IA32_MCi_ADDR register contains the address where
        the error occurred.

PCC   - Processor Context Corrupt
        Indicates that the state of the processor might have been corrupted
        by the error condition detected and that reliable restarting of the
        processor may not be possible.

BUSCONNERR - Bus and Interconnect Error   BUS{LL}_{PP}_{RRRR}_{II}_{T}_err
        These errors match the format 0000 1PPT RRRR IILL

   Concatenated Error Code:
   --------------------------
   _VAL_UC_EN_MISCV_ADDRV_PCC_BUSCONNERR_1F

   This error code can be reported back to the manufacturer.
   They may be able to provide additional information based upon
   this error.  All questions regarding STOP 0x9C should be
   directed to the hardware manufacturer.

BUGCHECK_STR:  0x9C_IA32_GenuineIntel

DEFAULT_BUCKET_ID:  DRIVER_FAULT

PROCESS_NAME:  Idle

CURRENT_IRQL:  2

LAST_CONTROL_TRANSFER:  from 80a7fbd8 to 8087b6be

STACK_TEXT: 
f773d280 80a7fbd8 0000009c 00000000 f773d2b0 nt!KeBugCheckEx+0x1b
f773d3b4 80a7786f f7737fe0 00000000 00000000 hal!HalpMcaExceptionHandler+0x11e
f773d3b4 f75a9ca2 f7737fe0 00000000 00000000 hal!HalpMcaExceptionHandlerWrapper+0x77
f78c6d50 8083abf2 00000000 0000000e 00000000 intelppm!AcpiC1Idle+0x12
f78c6d54 00000000 0000000e 00000000 00000000 nt!KiIdleLoop+0xa

- Dmitry Vostokov @ DumpAnalysis.org -

Updated: Selected Citrix Tools

April 2nd, 2008

The last year presentation has been updated and now available in both HTML and PDF formats:

Selected Citrix Troubleshooting and Debugging Tools (HTML)

Selected Citrix Troubleshooting and Debugging Tools (PDF)

- Dmitry Vostokov @ DumpAnalysis.org -

The Inception of Debugging Studio

April 2nd, 2008

Born out of 2008 April Fool’s joke (although I was thinking about it long before) the idea is to have a general framework and associated IDE for analysis activities for various tools that produce logs. Similar to planned GUI Monitor integrating WindowHistory, MesageHistory and ScreenHistory tools but also including Debugger Log Analyzer, Debugging Notebooks, various memory and trace log visualization subsystems. It also has the working title UTF (Unified Tools Framework).

Seems I’m very easy on inceptions :-) All this will be covered in great detail in the forthcoming book which I tirelessly advertise:

DebugWare: The Art and Craft of Writing Troubleshooting Tools

- Dmitry Vostokov @ DumpAnalysis.org -

Microsoft gives sneak preview of Debugging Studio

April 1st, 2008

This looks really cool:

http://www.microsoft.com/whdc/devstudio/default.mspx 

- Dmitry Vostokov @ DumpAnalysis.org -

CDF Traces: Analyzing Process Launch Sequence

March 31st, 2008

Citrix CDF traces are based on ETW (Event Tracing for Windows) and therefore Citrix customers, their support personnel and developers can use MS TraceView tool for troubleshooting Citrix terminal service environments:

Viewing Common Diagnostics Facility (CDF) Traces Using TraceView

In cases with slow logon or slow process startup we can analyze process launch sequence to determine delays. In the output trace we can filter tzhook module messages which also contain session id (this is quite handy to differentiate between different sessions), for example: 

PID      TID      TIME          MESSAGE     
21864    21912    06:34:53.598  tzhook: Attach on process - cmd.exe session=51         
21620    20372    06:34:59.754  tzhook: Attach on process - acregl.exe session=51         
18668    21240    06:35:02.704  tzhook: Attach on process - cmstart.exe session=51         
18560    18832    06:35:02.735  tzhook: Attach on process - wfshell.exe session=51         
18204    20060    06:35:06.575  tzhook: Attach on process - icast.exe session=51         
20640    21104    06:35:07.717  tzhook: Attach on process - LOGON.EXE session=51         
21188    21032    06:35:07.938  tzhook: Attach on process - cscript.exe session=51         
21888    19592    06:35:11.157  tzhook: Attach on process - WScript.exe session=51         
20600    20732    06:35:11.780  tzhook: Attach on process - admin.exe session=51         
17976    20456    06:35:18.752  tzhook: Attach on process - winlogon.exe session=53         
21332    13156    06:35:51.625  tzhook: Attach on process - mpnotify.exe session=53         
10988    10732    06:35:57.043  tzhook: Attach on process - rundll32.exe session=53

Here is another process launch sequence for published Notepad application:

PID     TID     TIME            MESSAGE
15828   18720   15:34:02.637    tzhook: Attach on process - winlogon.exe session=2 
5300    18508   15:34:03.043    tzhook: Attach on process - mpnotify.exe session=2 
17948   19300   15:34:03.356    tzhook: Attach on process - userinit.exe session=2 
17956   19316   15:34:03.415    tzhook: Attach on process - cmd.exe session=2 
5384    5324    15:34:03.443    tzhook: Attach on process - cmd.exe session=2 
19432   19264   15:34:03.461    tzhook: Attach on process - SSONSVR.EXE session=2 
12480   7472    15:34:03.466    tzhook: Attach on process - cmd.exe session=2 
19448   19364   15:34:03.474    tzhook: Attach on process - net.exe session=2 
19416   19656   15:34:03.489    tzhook: Attach on process - acregl.exe session=2 
19480   19596   15:34:03.544    tzhook: Attach on process - cmstart.exe session=2 
664     19512   15:34:03.559    tzhook: Attach on process - wfshell.exe session=2 
19904   13140   15:34:03.610    tzhook: Attach on process - net.exe session=2 
6864    20036   15:34:03.746    tzhook: Attach on process - icast.exe session=2 
19540   20016   15:34:03.749    tzhook: Attach on process - ctfmon.exe session=2 
19944   19032   15:34:03.757    tzhook: Attach on process - net.exe session=2 
10232   18356   15:34:03.787    tzhook: Attach on process - notepad.exe session=2

Such sequences are also useful to determine a process upon which the session initialization or startup sequence hangs. In this case a user dump of that process might be useful.

Of course we can do all this with Process Monitor and other similar tools but here we get other Citrix related trace messages as well. All in one.

- Dmitry Vostokov @ DumpAnalysis.org -

LiterateScientist and ManagementBits update (March, 2008)

March 31st, 2008

I was very busy this month with the forthcoming Memory Dump Analysis Anthology Volume 1 plus I had a business trip to Redmond and therefore I really didn’t have enough time to contribute well to other my blogs. Nevertheless I finished reading Incompleteness book during my transatlantic flights, started reading two others and here is the small update:

LiterateScientist Blog:

Incompleteness: The Proof and Paradox of Kurt Godel

The Philosophers Toolkit

ManagementBits Blog:

The Science of Career Promotions

Management Bit and Tip 0×200

- Dmitry Vostokov @ DumpAnalysis.org -

Crash Dump Analysis Forum has been reopened!

March 30th, 2008

This is an attempt to revive the forum closed a year ago due to the lack of interest during that time. Now the number of visitors has increased by an order of magnitude and I get more and more requests to help with crash dump analysis but I cannot guarantee immediate response. Therefore I upgraded and reopened Crash Dump Analysis and Debugging Forum and encourage using it. In order to prevent spammers gaining access any new registration has to be approved by me (usually in less than 24 hours).

- Dmitry Vostokov @ DumpAnalysis.org -

AW Reprints Device Drivers Book

March 29th, 2008

Just noticed that this month Addison-Wesley Professional reprints in paperback its out of stock hardcover book originally published in 1999:

Developing Windows NT Device Drivers: A Programmer’s Handbook (paperback)

Buy from Amazon

Highly recommended. Almost all book material is still relevant today even in the light of new WDF model. Please also see my post Moving to kernel space (updated references).

- Dmitry Vostokov @ DumpAnalysis.org -

Complete Dump: User Space Critical Sections

March 28th, 2008

Just a short note. Suppose we have a complete memory dump and we want to check critical sections to see any anomalies. We can do this by using !for_each_process extension command:

0: kd> !for_each_process ".process /r /p @#Process; !ntsdexts.locks"
Implicit process is now a59a4648
Loading User Symbols

NTSDEXTS: Unable to resolve ntdll!RtlCriticalSectionList
NTSDEXTS: Please check your symbols
Implicit process is now a553cd88
Loading User Symbols
....

Scanned 11 critical sections
Implicit process is now a518b1b0
Loading User Symbols
....

Scanned 105 critical sections
Implicit process is now a513a348
Loading User Symbols
....

Scanned 977 critical sections
Implicit process is now a5659d88
Loading User Symbols
....

Scanned 438 critical sections
Implicit process is now a551abb8
Loading User Symbols
....
...
...
...
...

Here the first NTSDEXTS warning is normal because we don’t have user space for System process.

- Dmitry Vostokov @ DumpAnalysis.org -

The Hunt for the Debugger

March 28th, 2008

Sometimes we have processes that actively monitor debugger attachments to prevent reverse engineering and terminate themselves if such attempts are detected. Some of them use very simple methods to achieve this like creating a thread that periodically calls IsDebuggerPresent API or waits for debugger events. In such cases attempts of any application to actively attach to these processes result in their termination.

Consider the following stack trace from the postmortem crash dump saved by NTSD on Windows Server 2003:

0:000> kL
ChildEBP RetAddr 
00fefbcc 098b84a1 kernel32!RaiseException+0x53
...
...
...
00fefd28 0116a86a component!_CRT_INIT+0x187
00fefd6c 0116a8e6 component!__DllMainCRTStartup+0xb7
00fefd74 7c81a352 component!_DllMainCRTStartup+0x1d
00fefd94 7c830e70 ntdll!LdrpCallInitRoutine+0x14
00fefe4c 77e668a3 ntdll!LdrShutdownProcess+0x182
00feff38 77e66905 kernel32!_ExitProcess+0x43
00feff4c 00561ab9 kernel32!ExitProcess+0x14
00feffb8 77e64829 application!foo+0x41
00feffec 00000000 kernel32!BaseThreadStart+0x34

Disassembling application!foo shows the call to WaitForDebugEvent API:

0:000> u application!foo
application!foo:
00561a78 push    ebp
00561a79 mov     ebp,esp
00561a7b sub     esp,60h
00561a7e push    0FFFFFFFFh
00561a80 lea     eax,[ebp-60h]
00561a83 push    eax
00561a84 call    dword ptr [application!_imp__WaitForDebugEvent (00655224)]
00561a8a mov     eax,dword ptr [ebp+8]

We also see it on the raw stack which might also help in more complex cases:

0:000> !teb
TEB at 7ffdd000
    ExceptionList:        00fefbf8
    StackBase:            00ff0000
    StackLimit:           00fef000
    SubSystemTib:         00000000
    FiberData:            00001e00
    ArbitraryUserPointer: 00000000
    Self:                 7ffdd000
    EnvironmentPointer:   00000000
    ClientId:             000063fc . 00003270
    RpcHandle:            00000000
    Tls Storage:          00000000
    PEB Address:          7ffdb000
    LastErrorValue:       0
    LastStatusValue:      c0000034
    Count Owned Locks:    0
    HardErrorMode:        0

0:000> dds 00fef000 00ff0000
...
...
...
00fefecc  00000000
00fefed0  00feff48
00fefed4  77e9c4d7 kernel32!WaitForDebugEvent+0×66
00fefed8  c0000008
00fefedc  00000000
00fefee0  77e41ef3 kernel32!SleepEx+0×91
00fefee4  00000000
00fefee8  00000000


How would we find what process was trying to attach to our application? Let’s go with pure crash dump analysis approach. We can take the advantage of RaiseException call and get a kernel or a complete memory dump to examine all running processes and their threads. In order to model this I created a small program that simulates the behavior shown above:

// IsDebuggerPresent64 

#include "stdafx.h"
#include "windows.h"

int _tmain(int argc, _TCHAR* argv[])
{
    while (1)
    {
        IsDebuggerPresent()
            ? puts ("Yes"),
                RaiseException(0x12345678,
                    0, 0, NULL)
            : puts ("No");
        Sleep(5000);
    }

    return 0;
}

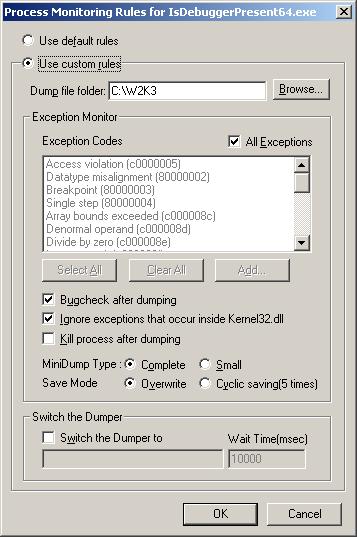
Then I configured Process Monitoring Rules in Userdump Process Dumper Control Panel applet to bugcheck the system after dumping:


Then I asked one of my friends to debug the running instance of that application and let me know if there was any sudden BSOD. Indeed there was one and I got my complete memory dump (although kernel dump would suffice here). Let’s look at it.

We see that our process has an open debug port and its main thread is suspended:

kd> !process /r /p fffffadfe73f9c20
PROCESS fffffadfe73f9c20
    SessionId: 0  Cid: 0e4c    Peb: 7fffffd4000  ParentCid: 0e54
    DirBase: 2c472000  ObjectTable: fffffa80006f1690  HandleCount:  12.
    Image: IsDebuggerPresent64.exe
    VadRoot fffffadfe6ef3e30 Vads 26 Clone 0 Private 97. Modified 0. Locked 0.
    DeviceMap fffffa8000930540
    Token                             fffffa80030e7910
    ElapsedTime                       00:00:03.062
    UserTime                          00:00:00.000
    KernelTime                        00:00:00.000
    QuotaPoolUsage[PagedPool]         16288
    QuotaPoolUsage[NonPagedPool]      3488
    Working Set Sizes (now,min,max)  (1322, 50, 345) (5288KB, 200KB, 1380KB)
    PeakWorkingSetSize                1322
    VirtualSize                       7 Mb
    PeakVirtualSize                   7 Mb
    PageFaultCount                    1314
    MemoryPriority                    BACKGROUND
    BasePriority                      8
    CommitCharge                      107
    DebugPort                         fffffadfe6ec9040

THREAD fffffadfe69a2bf0  Cid 0e4c.0e74  Teb: 000007fffffde000 Win32Thread: 0000000000000000 WAIT: (Unknown) KernelMode Non-Alertable
SuspendCount 1
    fffffadfe69a2e90  Semaphore Limit 0×2
Not impersonating
DeviceMap                 fffffa8000930540
Owning Process            fffffadfe73f9c20       Image:         IsDebuggerPresent64.exe
Wait Start TickCount      37247          Ticks: 49 (0:00:00:00.765)
Context Switch Count      45            
UserTime                  00:00:00.000
KernelTime                00:00:00.000
Win32 Start Address IsDebuggerPresent64 (0×00000001400013b0)
Start Address kernel32!BaseProcessStart (0×0000000077d59620)
Stack Init fffffadfdf7b5e00 Current fffffadfdf7b54f0
Base fffffadfdf7b6000 Limit fffffadfdf7b0000 Call 0

Priority 12 BasePriority 8 PriorityDecrement 2
Child-SP          RetAddr           Call Site
fffffadf`df7b5530 fffff800`0103b063 nt!KiSwapContext+0x85
fffffadf`df7b56b0 fffff800`0103c403 nt!KiSwapThread+0xc3
fffffadf`df7b56f0 fffff800`0105dc7c nt!KeWaitForSingleObject+0x528
fffffadf`df7b5780 fffff800`0105db2b nt!KiSuspendThread+0x2c
fffffadf`df7b57c0 fffff800`01058e71 nt!KiDeliverApc+0x20a
fffffadf`df7b5840 fffff800`0103c403 nt!KiSwapThread+0xde
fffffadf`df7b5880 fffffadf`dfd4a20c nt!KeWaitForSingleObject+0x528
fffffadf`df7b5910 fffffadf`dfd4a3be userdump!UdpCompleteExceptionForwarding+0x11c
fffffadf`df7b5990 fffffadf`dfd49dd8 userdump!UdpForwardException+0x13e
fffffadf`df7b59c0 fffff800`012ce9cf userdump!UdIoctl+0x618
fffffadf`df7b5a70 fffff800`012df026 nt!IopXxxControlFile+0xa5a
fffffadf`df7b5b90 fffff800`010410fd nt!NtDeviceIoControlFile+0x56
fffffadf`df7b5c00 00000000`77ef0a5a nt!KiSystemServiceCopyEnd+0x3 (TrapFrame @ fffffadf`df7b5c70)

If we search for a process that has NtWaitForDebugEvent function present on one of its stack traces we would find the debugger:

kd> !stacks 2 nt!NtWaitForDebugEvent
...
...
...
                [fffffadfe63da3b0 ntsd.exe]
 e54.000e50  fffffadfe6afbbf0 ffff6e8a Blocked    nt!KiSwapContext+0×85
                nt!KiSwapThread+0xc3
                nt!KeWaitForSingleObject+0×528
                nt!NtWaitForDebugEvent+0×342
                nt!KiSystemServiceCopyEnd+0×3
                ntdll!ZwWaitForDebugEvent+0xa
                dbgeng!LiveUserDebugServices::WaitForEvent+0xee
                dbgeng!LiveUserTargetInfo::WaitForEvent+0×488
                dbgeng!RawWaitForEvent+0×23c
                dbgeng!DebugClient::WaitForEvent+0×96
                ntsd!MainLoop+0xb7
                ntsd!main+0×18e
                ntsd!mainCRTStartup+0×171
                kernel32!BaseProcessStart+0×29

We see that it is NTSD.  

- Dmitry Vostokov @ DumpAnalysis.org -

Ceteris Paribus in Comparative Troubleshooting

March 27th, 2008

Ceteris Paribus means “with other things [being] the same” (Latin) and when applied to software troubleshooting and debugging means equal environment and configuration. My favorite example is troubleshooting an issue using two Citrix CDF traces (ETW based): one is for the problem and another for the expected behavior. Say we have a terminal services connectivity problem where a published application doesn’t start on the one particular server in Citrix farm. Here Ceteris Paribus means that the application, connection method, configuration, user name, and so on, are all the same for both traces. 

Looks like I have used Latin to obfuscate something obvious but surely many engineers forget it when facing complex issues. This equally applies to debugging as well. 

- Dmitry Vostokov @ DumpAnalysis.org -

Crash Dump Analysis Patterns (Part 56)

March 27th, 2008

The case when a function pointer or a return address becomes a Wild Pointer and EIP or RIP value lies in a valid region of memory the execution path may continue through a region called Wild Code. This might loop on itself or eventually reach non-executable or invalid pages and produce an exception. Local Buffer Overflow might lead to this behavior and also data corruption that overwrites function pointers with valid memory addresses.

My favorite example is when a function pointer points to zeroed pages with EXECUTE page attribute. What will happen next when we dereference it? All zeroes are perfect x86/x64 code:

0:001> dd 0000000`771afdf0
00000000`771afdf0  00000000 00000000 00000000 00000000
00000000`771afe00  00000000 00000000 00000000 00000000
00000000`771afe10  00000000 00000000 00000000 00000000
00000000`771afe20  00000000 00000000 00000000 00000000
00000000`771afe30  00000000 00000000 00000000 00000000
00000000`771afe40  00000000 00000000 00000000 00000000
00000000`771afe50  00000000 00000000 00000000 00000000
00000000`771afe60  00000000 00000000 00000000 00000000

0:001> u
ntdll!DbgUserBreakPoint:
00000000`771afe00 0000    add     byte ptr [rax],al
00000000`771afe02 0000    add     byte ptr [rax],al
00000000`771afe04 0000    add     byte ptr [rax],al
00000000`771afe06 0000    add     byte ptr [rax],al
00000000`771afe08 0000    add     byte ptr [rax],al
00000000`771afe0a 0000    add     byte ptr [rax],al
00000000`771afe0c 0000    add     byte ptr [rax],al
00000000`771afe0e 0000    add     byte ptr [rax],al

Now if RAX points to a valid memory page with WRITE attribute the code will modify the first byte at that address:

0:001> dq @rax
000007ff`fffdc000 00000000`00000000 00000000`035a0000
000007ff`fffdc010 00000000`0359c000 00000000`00000000
000007ff`fffdc020 00000000`00001e00 00000000`00000000
000007ff`fffdc030 000007ff`fffdc000 00000000`00000000
000007ff`fffdc040 00000000`0000142c 00000000`00001504
000007ff`fffdc050 00000000`00000000 00000000`00000000
000007ff`fffdc060 000007ff`fffd8000 00000000`00000000
000007ff`fffdc070 00000000`00000000 00000000`00000000

Therefore the code will be perfectly executed:

0:001> t
ntdll!DbgBreakPoint+0x2:
00000000`771afdf2 0000    add     byte ptr [rax],al ds:000007ff`fffdc000=00

0:001> t
ntdll!DbgBreakPoint+0x4:
00000000`771afdf4 0000    add     byte ptr [rax],al ds:000007ff`fffdc000=00

0:001> t
ntdll!DbgBreakPoint+0x6:
00000000`771afdf6 0000    add     byte ptr [rax],al ds:000007ff`fffdc000=00

0:001> t
ntdll!DbgBreakPoint+0x8:
00000000`771afdf8 0000    add     byte ptr [rax],al ds:000007ff`fffdc000=00

0:001> t
ntdll!DbgBreakPoint+0xa:
00000000`771afdfa 0000    add     byte ptr [rax],al ds:000007ff`fffdc000=00

- Dmitry Vostokov @ DumpAnalysis.org -

Crash Dump Analysis AntiPatterns (Part 9)

March 27th, 2008

Symbolless Analysis is another anti-pattern when an engineer either in a hurry or due to laziness doesn’t apply proper symbols and relies only on timestamps and module/offsets or trusts what WinDbg says and ignores symbol warnings. I usually apply symbols even in obvious cases and in hard ones strive to apply them until all possibilities are exhausted including search using PDBFinder.

Another weak variant is called Imageless Analysis when an engineer doesn’t specify proper Executable Image Search Path when it is necessary perhaps due to ignorance or just plain laziness again. Please see Minidump Analysis example for proper minidump analysis.

- Dmitry Vostokov @ DumpAnalysis.org -

The Time of the Crash

March 26th, 2008

When we have a crash dump WinDbg tells us the time of the crash:

1: kd> vertarget
Windows Vista Kernel Version 6000 MP (2 procs) Free x64
Product: WinNt, suite: TerminalServer SingleUserTS
Built by: 6000.16575.amd64fre.vista_gdr.071009-1548
Kernel base = 0xfffff800`01c00000 PsLoadedModuleList = 0xfffff800`01d9af70
Debug session time: Tue Jan 29 11:03:52.572 2008 (GMT+0)
System Uptime: 0 days 0:12:06.648

However I couldn’t find the similar command in GDB documentation. 

One option is to check core file timestamp. For kernel core files perhaps there is some kernel variable we can examine too (I’m interested in FreeBSD here). 

If anyone knows about GDB command that shows the time of a crash or any other method please let me know. Any hints are greatly appreciated!

- Dmitry Vostokov @ DumpAnalysis.org

Crash Dump Analysis Publishing Roadmap

March 26th, 2008

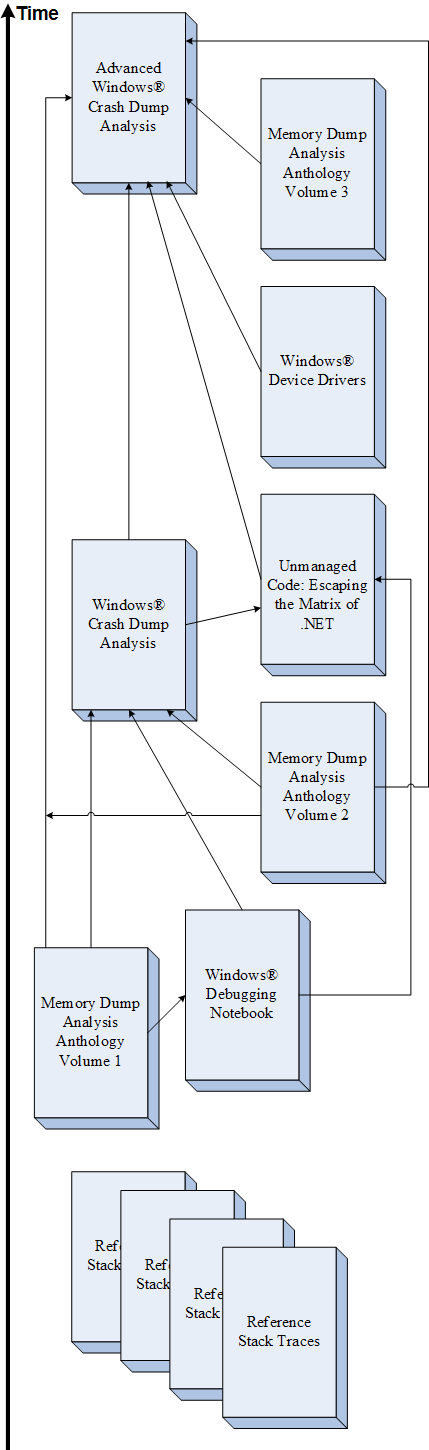
It may appear that I have announced too many titles but they all fall into the well-defined publishing roadmap (excluding a couple of publishing digressions like Debugware book):

This is a high level illustration of global incremental and iterative parts of IIPP (Iterative and Incremental Publishing Process) that I coined some months earlier. More about local iterative and incremental parts in one of my next posts. 

- Dmitry Vostokov @ DumpAnalysis.org -

Advanced Windows® Crash Dump Analysis

March 25th, 2008

This is planned for publication after Windows® Crash Dump Analysis book. Preliminary information is:

  • Title: Advanced Windows® Crash Dump Analysis
  • Paperback: 512 pages (*)
  • ISBN-13: 978-0-9558328-8-8
  • Author: Dmitry Vostokov
  • Publisher: Opentask (01 Dec 2009)
  • Language: English
  • Product Dimensions: 22.86 x 15.24

(*) subject to change

- Dmitry Vostokov @ DumpAnalysis.org -

Windows Internals Experts

March 25th, 2008

Microsoft is looking for 5 Windows Internals SME to help them with their special project. Details can be found on CPR Team blog:

Wanted: Windows Internals subject matter experts

- Dmitry Vostokov @ DumpAnalysis.org -