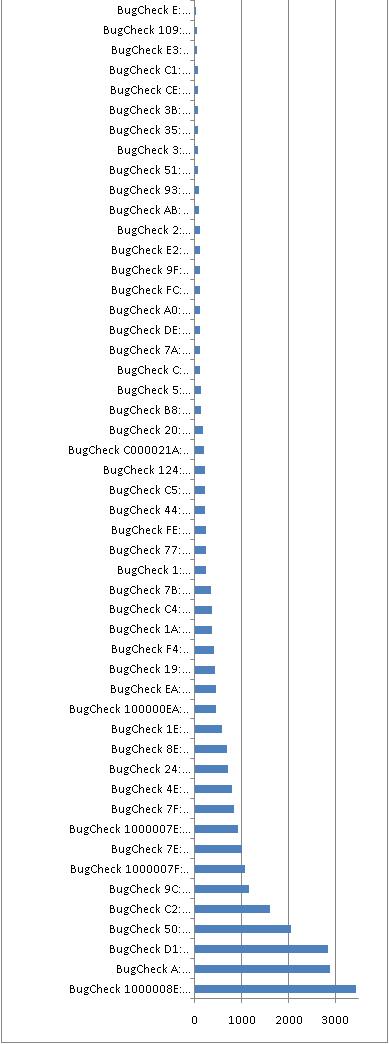
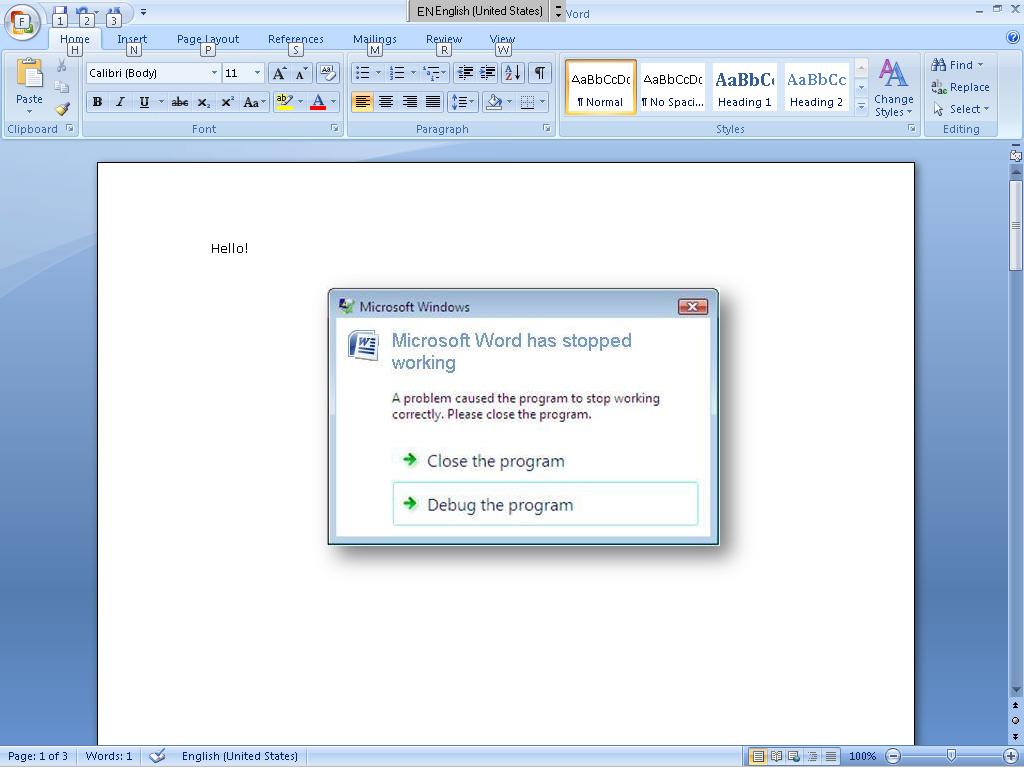
This morning I got the following bugcheck on my home Apple MacMini running Windows Vista:
IRQL_NOT_LESS_OR_EQUAL (a)

An attempt was made to access a pageable (or completely invalid) address at an interrupt request level (IRQL) that is too high.  This is usually caused by drivers using improper addresses.

If a kernel debugger is available get the stack backtrace.

Arguments:

Arg1: a112883e, memory referenced

Arg2: 0000001b, IRQL

Arg3: 00000000, bitfield :

 bit 0 : value 0 = read operation, 1 = write operation

 bit 3 : value 0 = not an execute operation, 1 = execute operation (only on chips which support this level of status)

Arg4: 81c28750, address which referenced memory
READ_ADDRESS: a112883e Paged pool
The address belongs to paged pool indeed:
0: kd> !pool a112883e

Pool page a112883e region is Paged pool

 a1128000 size:  6d0 previous size:    0  (Allocated)  Toke (Protected)

 a11286d0 size:    8 previous size:  6d0  (Free)       SeSd

 a11286d8 size:   a8 previous size:    8  (Allocated)  SpSy

 a1128780 size:   10 previous size:   a8  (Free)       AlEB

*a1128790 size:  1a0 previous size:   10  (Allocated) *KFlt

  Owning component : Unknown (update pooltag.txt)

 a1128930 size:  6d0 previous size:  1a0  (Allocated)  Toke (Protected)
Search for KFlt tag points to KeyMagic.sys:
C:\Windows\system32>findstr /S /m /l hKFlt *.sys

drivers\KeyMagic.sys

DriverStore\FileRepository\keymagic.inf_c8736569\KeyMagic.sys
When we look at the trap address we notice that it seems to be valid:
TRAP_FRAME:  85bdf8e8 -- (.trap 0xffffffff85bdf8e8)

ErrCode = 00000000

eax=a1128828 ebx=00000001 ecx=81d323c0 edx=00000000 esi=84ca6f38 edi=84ca6f40

eip=81c28750 esp=85bdf95c ebp=85bdf970 iopl=0 nv up ei pl zr na pe nc

cs=0008 ss=0010 ds=0023 es=0023 fs=0030 gs=0000  efl=00010246

nt!KeSetEvent+0x4d:

81c28750 385816          cmp     byte ptr [eax+16h],bl      ds:0023:a112883e=01
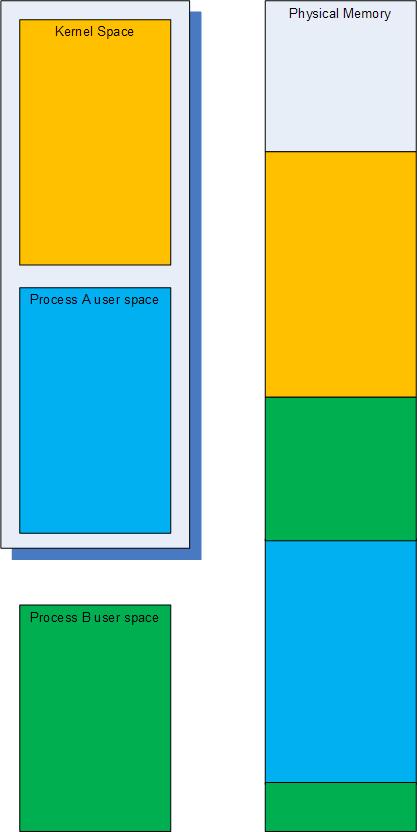
However as explained in Another look at page faults post we have a page in transition and this violates IRQL contract:
0: kd> !pte a112883e

               VA a112883e

PDE at 00000000C0602840    PTE at 00000000C0508940

contains 000000001CEC5863  contains 000000001AFB48C2

pfn 1cec5 ---DA--KWEV                           not valid

                       Transition: 1afb4

                       Protect: 6 - ReadWriteExecute
When we look at stack trace parameters we notice that the first parameter passed to KeSetEvent function belongs to nonpaged pool:
STACK_TEXT:

85bdf8e8 81c28750 badb0d00 00000000 00000000 nt!KiTrap0E+0x2ac

85bdf970 876394df 84ca6f0000000000 00000000 nt!KeSetEvent+0×4d

WARNING: Stack unwind information not available. Following frames may be wrong.

85bdf98c 8763a145 84ca68a0 8399e3b8 85bdf9ac KeyMagic+0×14df

85bdf99c 806f57a0 7b359920 7c98c800 85bdf9d4 KeyMagic+0×2145

85bdf9ac 806f514e 8399e3b8 8070e2a0 8399e3b8 Wdf01000!FxPkgPnp::PnpEventFailedOwnHardware+0×3b
0: kd> !pool 84ca6f00

Pool page 84ca6f00 region is Nonpaged pool

 84ca6000 size:  2b8 previous size:    0  (Allocated)  Thre (Protected)

 84ca62b8 size:   10 previous size:  2b8  (Free)       ....

 84ca62c8 size:   48 previous size:   10  (Allocated)  Vadl

 84ca6310 size:   30 previous size:   48  (Allocated)  Ntfn

 84ca6340 size:   38 previous size:   30  (Allocated)  usbp

 84ca6378 size:   98 previous size:   38  (Allocated)  NDam

 84ca6410 size:  188 previous size:   98  (Allocated)  NDoa

 84ca6598 size:    8 previous size:  188  (Free)       FOCX

 84ca65a0 size:   30 previous size:    8  (Allocated)  UHUB

 84ca65d0 size:   20 previous size:   30  (Allocated)  Wnln

 84ca65f0 size:   28 previous size:   20  (Allocated)  Io

 84ca6618 size:   18 previous size:   28  (Allocated)  Ala6

 84ca6630 size:   98 previous size:   18  (Allocated)  NDam

*84ca66c8 size:  938 previous size:   98  (Allocated) *KeyM

  Owning component : Unknown (update pooltag.txt)
However it is not a pointer to a valid _KEVENT structure:
0: kd> dt -r _KEVENT 84ca6f00

Wdf01000!_KEVENT

   +0x000 Header           : _DISPATCHER_HEADER

      +0x000 Type             : 0xc8 ''

      +0x001 Abandoned        : 0x87 ''

      +0x001 Absolute         : 0x87 ''

      +0x001 NpxIrql          : 0x87 ''

      +0x001 Signalling       : 0x87 ''

      +0x002 Size             : 0x12 ''

      +0x002 Hand             : 0x12 ''

      +0x003 Inserted         : 0xa1 ''

      +0x003 DebugActive      : 0xa1 ''

      +0x003 DpcActive        : 0xa1 ''

      +0x000 Lock             : -1592621112

      +0x004 SignalState      : -1592621112

      +0x008 WaitListHead     : _LIST_ENTRY [ 0x40000 - 0x0 ]

         +0x000 Flink            : 0x00040000 _LIST_ENTRY

         +0x004 Blink            : (null)
Moreover we see from disassembly and nonpaged pool entry contents that KeSetEvent function tried to dereference wrong WaitListHead that points to paged pool (the same pool entry that caused the bugcheck):
0: kd> uf nt!KeSetEvent

nt!KeSetEvent:

81c28703 mov     edi,edi

81c28705 push    ebp

81c28706 mov     ebp,esp

81c28708 push    ecx

81c28709 push    ecx

81c2870a push    ebx

81c2870b push    esi

81c2870c mov     esi,dword ptr [ebp+8]

81c2870f xor     ebx,ebx

81c28711 inc     ebx

81c28712 cmp     byte ptr [esi],0

81c28715 push    edi

81c28716 jne     nt!KeSetEvent+0x27 (81c2872a)
nt!KeSetEvent+0x15:

81c28718 cmp     dword ptr [esi+4],ebx

81c2871b jne     nt!KeSetEvent+0x27 (81c2872a)
nt!KeSetEvent+0x1a:

81c2871d cmp     byte ptr [ebp+10h],0

81c28721 jne     nt!KeSetEvent+0x27 (81c2872a)
nt!KeSetEvent+0x20:

81c28723 mov     eax,ebx

81c28725 jmp     nt!KeSetEvent+0xcf (81c287d6)
nt!KeSetEvent+0x27:

81c2872a xor     ecx,ecx

81c2872c call    dword ptr [nt!_imp_KeAcquireQueuedSpinLockRaiseToSynch (81c010a4)]

81c28732 mov     byte ptr [ebp+8],al ; clears the first byte of 84ca6f00 so PKEVENT could have been any 84ca6fXX

81c28735 mov     eax,dword ptr [esi+4]

81c28738 test    eax,eax

81c2873a mov     dword ptr [ebp-4],eax

81c2873d mov     dword ptr [esi+4],ebx

81c28740 jne     nt!KeSetEvent+0×9a (81c287a1)
nt!KeSetEvent+0x3f:

81c28742 lea     edi,[esi+8]

81c28745 cmp     dword ptr [edi],edi

81c28747 je      nt!KeSetEvent+0x9a (81c287a1)
nt!KeSetEvent+0x46:

81c28749 cmp     byte ptr [esi],0

81c2874c mov     eax,dword ptr [edi]

81c2874e jne     nt!KeSetEvent+0x70 (81c28775)
nt!KeSetEvent+0x4d:

81c28750 cmp     byte ptr [eax+16h],bl

81c28753 mov     ecx,dword ptr [eax+8]

81c28756 push    dword ptr [ebp+0Ch]

81c28759 jne     nt!KeSetEvent+0x5e (81c28761)
nt!KeSetEvent+0x58:

81c2875b movzx   edx,word ptr [eax+14h]

81c2875f jmp     nt!KeSetEvent+0x63 (81c28766)
nt!KeSetEvent+0x5e:

81c28761 mov     edx,100h
nt!KeSetEvent+0x63:

81c28766 call    nt!KiUnwaitThread (81ca9097)

81c2876b mov     eax,dword ptr [edi]

81c2876d cmp     eax,edi

81c2876f je      nt!KeSetEvent+0x9a (81c287a1)
nt!KeSetEvent+0x6e:

81c28771 jmp     nt!KeSetEvent+0x4d (81c28750)
nt!KeSetEvent+0x70:

81c28775 cmp     byte ptr [eax+16h],bl

81c28778 mov     ecx,dword ptr [eax+8]

81c2877b push    dword ptr [ebp+0Ch]

81c2877e je      nt!KeSetEvent+0x8d (81c28794)
nt!KeSetEvent+0x7b:

81c28780 mov     edx,100h

81c28785 call    nt!KiUnwaitThread (81ca9097)

81c2878a mov     eax,dword ptr [edi]

81c2878c cmp     eax,edi

81c2878e je      nt!KeSetEvent+0x9a (81c287a1)
nt!KeSetEvent+0x8b:

81c28790 jmp     nt!KeSetEvent+0x70 (81c28775)
nt!KeSetEvent+0x8d:

81c28794 and     dword ptr [esi+4],0

81c28798 movzx   edx,word ptr [eax+14h]

81c2879c call    nt!KiUnwaitThread (81ca9097)
nt!KeSetEvent+0x9a:

81c287a1 cmp     byte ptr [ebp+10h],0

81c287a5 je      nt!KeSetEvent+0xb2 (81c287b9)
nt!KeSetEvent+0xa0:

81c287a7 mov     eax,dword ptr fs:[00000124h]

81c287ad mov     cl,byte ptr [ebp+8]

81c287b0 or      dword ptr [eax+68h],8

81c287b4 mov     byte ptr [eax+5Eh],cl

81c287b7 jmp     nt!KeSetEvent+0xcc (81c287d3)
nt!KeSetEvent+0xb2:

81c287b9 mov     ecx,dword ptr fs:[20h]

81c287c0 add     ecx,418h

81c287c6 call    nt!KeReleaseQueuedSpinLockFromDpcLevel (81c8bf0c)

81c287cb push    dword ptr [ebp+8]

81c287ce call    nt!KiExitDispatcher (81ca9c12)
nt!KeSetEvent+0xcc:

81c287d3 mov     eax,dword ptr [ebp-4]
nt!KeSetEvent+0xcf:

81c287d6 pop     edi

81c287d7 pop     esi

81c287d8 pop     ebx

81c287d9 leave

81c287da ret     0Ch
0: kd> dd 84ca6f00 84ca6fff

84ca6f00 a11287c8 a11287c8 00040000 00000000

84ca6f10 a11287e0 a11287e0 00040000 00000000

84ca6f20 a11287f8 a11287f8 00040000 00000000

84ca6f30 a1128810 a1128810 00040000 00000001

84ca6f40 a1128828 a1128828 00040000 00000000

84ca6f50 a1128840 a1128840 00040000 00000000

84ca6f60 a1128858 a1128858 00040000 00000000

84ca6f70 a1128888 a1128888 00040000 00000000

84ca6f80 a11288a0 a11288a0 00040000 00000000

84ca6f90 a1128870 a1128870 00040000 00000000

84ca6fa0 a11288b8 a11288b8 00040000 00000000

84ca6fb0 a11288d0 a11288d0 00040000 00000000

84ca6fc0 a11288e8 a11288e8 00040000 00000000

84ca6fd0 a1128900 a1128900 00040000 00000000

84ca6fe0 a1128918 a1128918 5e55aec0 6003be28

84ca6ff0 60181fe8 00000000 00000000 00000000
0: kd> !pool a11287c8

Pool page a11287c8 region is Paged pool

 a1128000 size:  6d0 previous size:    0  (Allocated)  Toke (Protected)

 a11286d0 size:    8 previous size:  6d0  (Free)       SeSd

 a11286d8 size:   a8 previous size:    8  (Allocated)  SpSy

 a1128780 size:   10 previous size:   a8  (Free)       AlEB

*a1128790 size:  1a0 previous size:   10  (Allocated) *KFlt

  Owning component : Unknown (update pooltag.txt)

 a1128930 size:  6d0 previous size:  1a0  (Allocated)  Toke (Protected)
Let’s look at our stack trace:
0: kd> !thread 82f49020 1f

THREAD 82f49020  Cid 0004.0034  Teb: 00000000 Win32Thread: 00000000 RUNNING on processor 0

IRP List:

    8391e008: (0006,02b0) Flags: 00000000  Mdl: 00000000

Not impersonating

DeviceMap                 85c03048

Owning Process            82f00ab0       Image:         System

Wait Start TickCount      4000214        Ticks: 0

Context Switch Count      21886

UserTime                  00:00:00.000

KernelTime                00:00:00.421

Win32 Start Address nt!ExpWorkerThread (0x81c78ea3)

Stack Init 85be0000 Current 85bdf7c0 Base 85be0000 Limit 85bdd000 Call 0

Priority 14 BasePriority 12 PriorityDecrement 0 IoPriority 2 PagePriority 5

ChildEBP RetAddr

85bdf8e8 81c28750 nt!KiTrap0E+0x2ac (TrapFrame @ 85bdf8e8)

85bdf970 876394df nt!KeSetEvent+0x4d

WARNING: Stack unwind information not available. Following frames may be wrong.

85bdf98c 8763a145 KeyMagic+0x14df

85bdf99c 806f57a0 KeyMagic+0x2145

85bdf9ac 806f514e Wdf01000!FxPkgPnp::PnpEventFailedOwnHardware+0x3b

85bdf9d4 806f5ea9 Wdf01000!FxPkgPnp::PnpEnterNewState+0x15c

85bdf9fc 806f61b3 Wdf01000!FxPkgPnp::PnpProcessEventInner+0x1f5

85bdfa20 806ecf6b Wdf01000!FxPkgPnp::PnpProcessEvent+0x1c8

85bdfa2c 806f34b4 Wdf01000!FxPkgPnp::PnpSurpriseRemoval+0x29

85bdfa38 806edf86 Wdf01000!FxPkgFdo::_PnpSurpriseRemoval+0x10

85bdfa5c 806d7d0a Wdf01000!FxPkgPnp::Dispatch+0x26e

85bdfa68 806d7f0f Wdf01000!FxDevice::Dispatch+0x7f

85bdfa84 81c27f83 Wdf01000!FxDevice::DispatchWithLock+0x5d

85bdfa9c a4966e7f nt!IofCallDriver+0x63

85bdfac0 a496c9ae hidbth!HidBthCallDriverSynchronous+0x55

85bdfae0 85ac5a5d hidbth!HidBthPnP+0x68

85bdfaf4 85acd4c2 HIDCLASS!HidpCallDriver+0x3f

85bdfb10 85acd62e HIDCLASS!HidpFdoPnp+0x60

85bdfb20 85ac64fd HIDCLASS!HidpIrpMajorPnp+0x1e

85bdfb30 81c27f83 HIDCLASS!HidpMajorHandler+0x79

85bdfb48 81daf465 nt!IofCallDriver+0x63

85bdfb7c 81daf6cb nt!IopSynchronousCall+0xce

85bdfbd8 81da5da4 nt!IopRemoveDevice+0xd5

85bdfc00 81da5c97 nt!PnpSurpriseRemoveLockedDeviceNode+0xbd

85bdfc14 81da5f17 nt!PnpDeleteLockedDeviceNode+0x1f

85bdfc44 81daa554 nt!PnpDeleteLockedDeviceNodes+0x4c

85bdfd04 81daabe1 nt!PnpProcessQueryRemoveAndEject+0x572

85bdfd1c 81da9743 nt!PnpProcessTargetDeviceEvent+0x38

85bdfd44 81c78fa0 nt!PnpDeviceEventWorker+0x201

85bdfd7c 81e254e0 nt!ExpWorkerThread+0xfd

85bdfdc0 81c9159e nt!PspSystemThreadStartup+0x9d

00000000 00000000 nt!KiThreadStartup+0x16
IRP and device examination shows that KeyMagic is a lower filter driver to bluetooth HID driver and an upper filter driver to BthEnum (see Bluetooth Driver Stack WDK article):
0: kd> !irp 8391e008

Irp is active with 16 stacks 14 is current (= 0x8391e24c)

 No Mdl: No System Buffer: Thread 82f49020:  Irp stack trace.

     cmd  flg cl Device   File     Completion-Context

 [  0, 0]   0  0 00000000 00000000 00000000-00000000
   Args: 00000000 00000000 00000000 00000000

 [  0, 0]   0  0 00000000 00000000 00000000-00000000
   Args: 00000000 00000000 00000000 00000000

 [  0, 0]   0  0 00000000 00000000 00000000-00000000
   Args: 00000000 00000000 00000000 00000000

 [  0, 0]   0  0 00000000 00000000 00000000-00000000
   Args: 00000000 00000000 00000000 00000000

 [  0, 0]   0  0 00000000 00000000 00000000-00000000
   Args: 00000000 00000000 00000000 00000000

 [  0, 0]   0  0 00000000 00000000 00000000-00000000
   Args: 00000000 00000000 00000000 00000000

 [  0, 0]   0  0 00000000 00000000 00000000-00000000
   Args: 00000000 00000000 00000000 00000000

 [  0, 0]   0  0 00000000 00000000 00000000-00000000
   Args: 00000000 00000000 00000000 00000000

 [  0, 0]   0  0 00000000 00000000 00000000-00000000
   Args: 00000000 00000000 00000000 00000000

 [  0, 0]   0  0 00000000 00000000 00000000-00000000
   Args: 00000000 00000000 00000000 00000000

 [  0, 0]   0  0 00000000 00000000 00000000-00000000
   Args: 00000000 00000000 00000000 00000000

 [  0, 0]   0  0 00000000 00000000 00000000-00000000
   Args: 00000000 00000000 00000000 00000000

 [  0, 0]   0  0 00000000 00000000 00000000-00000000
   Args: 00000000 00000000 00000000 00000000

>[ 1b,17]   0 e1 a1b9b120 00000000 a4966d36-85bdfab0 Success Error Cancel pending

        \Driver\KeyMagic hidbth!HidBthSynchronousCompletion

   Args: 00000000 00000000 00000000 00000000

 [ 1b,17]   0  0 8a1fc030 00000000 00000000-00000000

        \Driver\HidBth

   Args: 00000000 00000000 00000000 00000000

 [ 1b,17]   0  0 8a1fc030 00000000 00000000-00000000

        \Driver\HidBth

   Args: 00000000 00000000 00000000 00000000
0: kd> !devobj 8a1fc030

Device object (8a1fc030) is for:

 _HID00000006 \Driver\HidBth DriverObject 836225e0

Current Irp 00000000 RefCount 0 Type 00000022 Flags 00002050

Dacl 85c60218 DevExt 8a1fc0e8 DevObjExt 8a1fce98

ExtensionFlags (0x00000800)

                             Unknown flags 0x00000800

AttachedTo (Lower) a1b9b120 \Driver\KeyMagic

Device queue is not busy.
0: kd> !devobj a1b9b120

Device object (a1b9b120) is for:

  \Driver\KeyMagic DriverObject 83712d70

Current Irp 00000000 RefCount 0 Type 00000022 Flags 00002004

DevExt 84ca68a0 DevObjExt a1b9b1f0

ExtensionFlags (0x00000800)

                             Unknown flags 0x00000800

AttachedDevice (Upper) 8a1fc030 \Driver\HidBth

AttachedTo (Lower) 8a1ef030 \Driver\BthEnum

Device queue is not busy.
0: kd> !devstack 8a1ef030

  !DevObj   !DrvObj            !DevExt   ObjectName

  8a1fc030  \Driver\HidBth     8a1fc0e8  _HID00000006

  a1b9b120  \Driver\KeyMagic   84ca68a0

> 8a1ef030  \Driver\BthEnum    8a1ef0e8  00000068
lmv command doesn’t show detailed module information:
0: kd> lmv m KeyMagic

start    end        module name

87638000 87642000   KeyMagic   (no symbols)

    Loaded symbol image file: KeyMagic.sys

    Image path: \SystemRoot\system32\DRIVERS\KeyMagic.sys

    Image name: KeyMagic.sys

    Timestamp:        Thu Aug 30 22:59:01 2007 (46D73DA5)

    CheckSum:         0000B906

    ImageSize:        0000A000

    Translations:     0000.04b0 0000.04e0 0409.04b0 0409.04e0
But dumping the module contents shows more (Unknown Component pattern):
0: kd> dc 87638000 87642000

...

...

...

8763b120  \.r.e.g.i.s.t.r.

8763b130  y.\.m.a.c.h.i.n.

8763b140  e.\.S.y.s.t.e.m.

8763b150  \.C.u.r.r.e.n.t.

8763b160  C.o.n.t.r.o.l.S.

8763b170  e.t.\.S.e.r.v.i.

8763b180  c.e.s.\.k.e.y.m.

8763b190  a.g.i.c.....FILT

8763b1a0  ER_EXTENSION....

8763b1b0  NEW_LAYOUT..OLD_

8763b1c0  LAYOUT..UNKNOWN_

8763b1d0  LAYOUT..EXTERNAL

8763b1e0  _BLUETOOTH..EXTE

8763b1f0  RNAL_CORDED.INTE

8763b200  RNAL....UNKNOWN_

8763b210  TYPE....JIS.ANSI

8763b220  ....ISO.UNKNOWN_

8763b230  LANG............

8763b240  u.....%.........

8763b250  ................

8763b260  ............K.m.

8763b270  d.f.L.i.b.r.a.r.

8763b280  y...RSDS.....W.M

8763b290  .V..A..e....c:\b

8763b2a0  wa\applekeyboard

8763b2b0  win-200.1.4\srcr

8763b2c0  oot\applekeyboar

8763b2d0  d\objfre_wlh_x86

8763b2e0  \i386\KeyMagic.p

8763b2f0  db…………..

8763b300  …………….

…

…

…
Therefore we have enough evidence for KeyMagic.sys to contact the vendor for updates or remove it. The latter is better because I don’t use Apple wireless keyboard but the driver is present on my system. To be absolutely sure we can enable IRQL checking in Driver Verifier for KeyMagic.sys.
- Dmitry Vostokov @ DumpAnalysis.org -