There are some improvements in Vista and Windows Server 2008 regarding various WER callbacks to write user-defined data in the case of application crashes and hangs. See MSDN documentation:
What’s New in WER
However I have found that many engineers are not aware that the similar mechanism exists in kernel for many years:
Writing a Bug Check Callback Routine
You can check this data using !bugdump and .enumtag WinDbg commands:
0: kd> !bugdump

**** Dump of Bug Check Data ****

8526ba7c: Bug check callback record could not be read
We get “could not be read” message probably because for systems newer than Windows XP SP1 !bugdump command shows callback data written to memory after the crash dump was saved. So it is useful for live debugging only. However we can see that bugcheck callbacks form a linked list:
0: kd> dps 8526ba7c

8526ba7c  849eca7c

8526ba80  81b36ce0 nt!KeBugCheckCallbackListHead

8526ba84  858a7dea ndis!ndisBugcheckHandler

8526ba88  8526b438

8526ba8c  00000b28

8526ba90  8594dd76 ndis! ?? ::LNCPHCLB::`string’

8526ba94  90461ac0

8526ba98  00000001

8526ba9c  85936767 ndis!ndisMDispatchReceiveNetBufferLists

8526baa0  85936767 ndis!ndisMDispatchReceiveNetBufferLists

8526baa4  85969274 ndis!ethFilterDprIndicateReceivePacket

8526baa8  8de66c5c bthpan!MpReturnPacket

8526baac  8526ea80

8526bab0  859495ef ndis!ndisSynchReturnPacketsForTranslation

8526bab4  8526b438

8526bab8  00000000
0: kd> !list -x "dps @$extret l10" 81b36ce0

81b36ce0  8526ba7c

81b36ce4  81ddbe40 hal!HalpCallbackRecord

81b36ce8  00000000

81b36cec  00000001

81b36cf0  00000000

81b36cf4  00000000

81b36cf8  00000101

81b36cfc  00000001

81b36d00  00000000

81b36d04  00000000

81b36d08  00000000

81b36d0c  00000000

81b36d10  00000000

81b36d14  00000000

81b36d18  00000000

81b36d1c  00000000
8526ba7c  849eca7c

8526ba80  81b36ce0 nt!KeBugCheckCallbackListHead

8526ba84  858a7dea ndis!ndisBugcheckHandler

8526ba88  8526b438

8526ba8c  00000b28

8526ba90  8594dd76 ndis! ?? ::LNCPHCLB::`string'

8526ba94  90461ac0

8526ba98  00000001

8526ba9c  85936767 ndis!ndisMDispatchReceiveNetBufferLists

8526baa0  85936767 ndis!ndisMDispatchReceiveNetBufferLists

8526baa4  85969274 ndis!ethFilterDprIndicateReceivePacket

8526baa8  8de66c5c bthpan!MpReturnPacket

8526baac  8526ea80

8526bab0  859495ef ndis!ndisSynchReturnPacketsForTranslation

8526bab4  8526b438

8526bab8  00000000
849eca7c  849ea72c

849eca80  8526ba7c

849eca84  858a7dea ndis!ndisBugcheckHandler

849eca88  849ec438

849eca8c  00000b28

849eca90  8594dd76 ndis! ?? ::LNCPHCLB::`string'

849eca94  8fbe2ac0

849eca98  00000001

849eca9c  85936767 ndis!ndisMDispatchReceiveNetBufferLists

849ecaa0  85936767 ndis!ndisMDispatchReceiveNetBufferLists

849ecaa4  859432ca ndis!ndisMIndicatePacket

849ecaa8  00000000

849ecaac  00000000

849ecab0  859495ef ndis!ndisSynchReturnPacketsForTranslation

849ecab4  849ec438

849ecab8  00000000
849ea72c  849c272c

849ea730  849eca7c

849ea734  858a7dea ndis!ndisBugcheckHandler

849ea738  849ea0e8

849ea73c  00000b28

849ea740  8594dd76 ndis! ?? ::LNCPHCLB::`string'

849ea744  8fbe0770

849ea748  00000001

849ea74c  85936767 ndis!ndisMDispatchReceiveNetBufferLists

849ea750  85936767 ndis!ndisMDispatchReceiveNetBufferLists

849ea754  85969274 ndis!ethFilterDprIndicateReceivePacket

849ea758  00000000

849ea75c  00000000

849ea760  859495ef ndis!ndisSynchReturnPacketsForTranslation

849ea764  849ea0e8

849ea768  00000000
849c272c  849c172c

849c2730  849ea72c

849c2734  858a7dea ndis!ndisBugcheckHandler

849c2738  849c20e8

849c273c  00000b28

849c2740  8594dd76 ndis! ?? ::LNCPHCLB::`string'

849c2744  8fbb8770

849c2748  00000001

849c274c  85936767 ndis!ndisMDispatchReceiveNetBufferLists

849c2750  85936767 ndis!ndisMDispatchReceiveNetBufferLists

849c2754  85969274 ndis!ethFilterDprIndicateReceivePacket

849c2758  85df579a tunmp!TunMpReturnPacket

849c275c  84a45538

849c2760  859495ef ndis!ndisSynchReturnPacketsForTranslation

849c2764  849c20e8

849c2768  00000000
849c172c  849a072c

849c1730  849c272c

849c1734  858a7dea ndis!ndisBugcheckHandler

849c1738  849c10e8

849c173c  00000b28

849c1740  8594dd76 ndis! ?? ::LNCPHCLB::`string'

849c1744  8fbb7770

849c1748  00000001

849c174c  85936767 ndis!ndisMDispatchReceiveNetBufferLists

849c1750  85936767 ndis!ndisMDispatchReceiveNetBufferLists

849c1754  859432ca ndis!ndisMIndicatePacket

849c1758  00000000

849c175c  00000000

849c1760  859495ef ndis!ndisSynchReturnPacketsForTranslation

849c1764  849c10e8

849c1768  00000000
849a072c  8499d72c

849a0730  849c172c

849a0734  858a7dea ndis!ndisBugcheckHandler

849a0738  849a00e8

849a073c  00000b28

849a0740  8594dd76 ndis! ?? ::LNCPHCLB::`string'

849a0744  8fb96770

849a0748  00000001

849a074c  85936767 ndis!ndisMDispatchReceiveNetBufferLists

849a0750  85936767 ndis!ndisMDispatchReceiveNetBufferLists

849a0754  859432ca ndis!ndisMIndicatePacket

849a0758  00000000

849a075c  00000000

849a0760  859495ef ndis!ndisSynchReturnPacketsForTranslation

849a0764  849a00e8

849a0768  00000000
8499d72c  8499f72c

8499d730  849a072c

8499d734  858a7dea ndis!ndisBugcheckHandler

8499d738  8499d0e8

8499d73c  00000b28

8499d740  8594dd76 ndis! ?? ::LNCPHCLB::`string'

8499d744  8fb93770

8499d748  00000001

8499d74c  85936767 ndis!ndisMDispatchReceiveNetBufferLists

8499d750  85936767 ndis!ndisMDispatchReceiveNetBufferLists

8499d754  859432ca ndis!ndisMIndicatePacket

8499d758  00000000

8499d75c  00000000

8499d760  859495ef ndis!ndisSynchReturnPacketsForTranslation

8499d764  8499d0e8

8499d768  00000000
8499f72c  81ddbe40 hal!HalpCallbackRecord

8499f730  8499d72c

8499f734  858a7dea ndis!ndisBugcheckHandler

8499f738  8499f0e8

8499f73c  00000b28

8499f740  8594dd76 ndis! ?? ::LNCPHCLB::`string'

8499f744  8fb95770

8499f748  00000001

8499f74c  85936767 ndis!ndisMDispatchReceiveNetBufferLists

8499f750  85936767 ndis!ndisMDispatchReceiveNetBufferLists

8499f754  859432ca ndis!ndisMIndicatePacket

8499f758  00000000

8499f75c  00000000

8499f760  859495ef ndis!ndisSynchReturnPacketsForTranslation

8499f764  8499f0e8

8499f768  00000000
81ddbe40  81b36ce0 nt!KeBugCheckCallbackListHead

81ddbe44  8499f72c

81ddbe48  81dcebdc hal!HalpBugCheckCallback

81ddbe4c  00000000

81ddbe50  00000000

81ddbe54  81dc2550 hal!HalName

81ddbe58  03b9112c

81ddbe5c  00000001

81ddbe60  00000000

81ddbe64  00000000

81ddbe68  00000000

81ddbe6c  00000000

81ddbe70  6d46da80

81ddbe74  00000000

81ddbe78  00000000

81ddbe7c  00000000
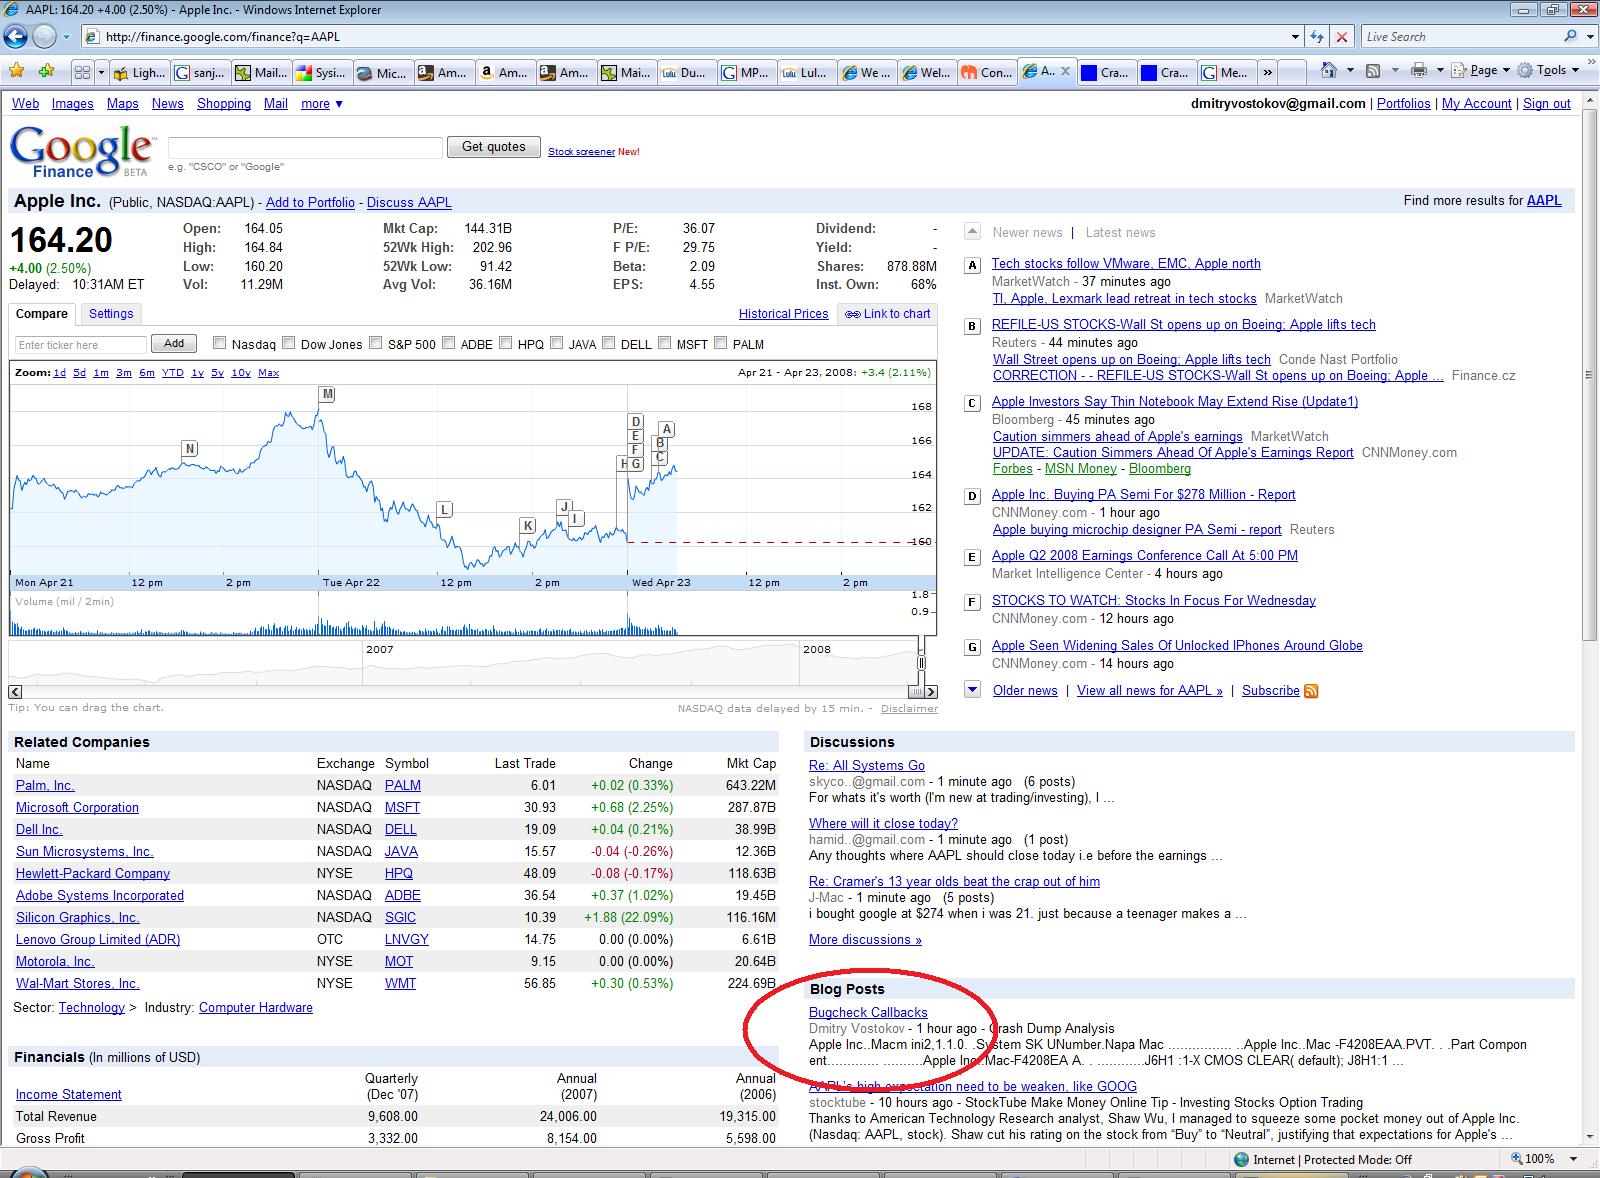
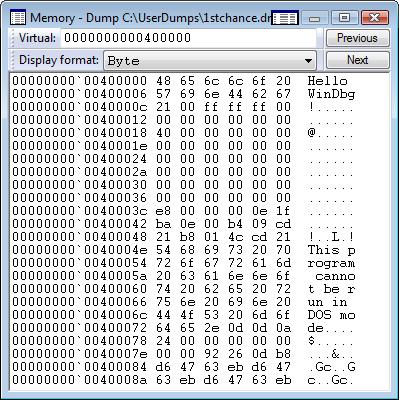
Another WinDbg command .enumtag shows data written before saving a crash dump and therefore useful for postmortem crash dump analysis (binary output is removed for visual clarity):
0: kd> .enumtag

{BC5C008F-1E3A-44D7-988D86F6884C6758} - 0x5cd bytes

  ...$............

  ................

  Apple Inc..    M

  M21.88Z.009A.B00

  .0706281359.06/2

  8/07............

  ................

  .Apple Inc..Macm

  ini2,1.1.0.

        .System SK

  UNumber.Napa Mac

  ................

  ..Apple Inc..Mac

  -F4208EAA.PVT. .

  .Part Compon

  ent.............

  ..........Apple

  Inc..Mac-F4208EA

  A.           .

  ............J6H1

  :1-X CMOS CLEAR(

  default); J8H1:1

  -X BIOS RECOVERY

  ...........None.

  Ethernet........

  ...None.DVI.....

  ......None.USB0.

  ..........None.U

  SB1...........No

  ne.USB2.........

  ..None.USB3.....

  ....!.None.FireW

  ire0...........N

  one.Audio Line I

  n...........None

  .Audio Line Out.

  ..............Ai

  rPort........Int

  egrated Graphics

  Controller ....

  ....Yukon Ethern

  et Controller...

  .....Azalia Audi

  o Codec........S

  ATA........PATA.

  ..........#.....

  .............&.&

  .A..........Inte

  l(R) Core(TM)2 C

  PU         T.Int

  el(R) Corporatio

  n.U2E1.       ..

[...]

  .......Intel(R)

  Core(TM)2 CPU

       T.Intel(R)

  Corporation.U2E

  1.       .......

[...]

  ...........DIMM0

  .BANK 0.0x2C0000

  0000000000.

      .       .0x

  3848544636343634

  4844592D36363744

  3320....!.......

  .. .$........"..

  ...@.@..........

  ......DIMM1.BANK

  1.0x2C000000000

  00000.

  .       .0x38485

  4463634363448445

  92D363637443320.

[...]

{6C7AC389-4313-47DC-9F34A8800A0FB56C} - 0x266 bytes

  ....~.M.H.z.....

  ......)...,...C.

  o.m.p.o.n.e.n.t.

  .I.n.f.o.r.m.a.

  t.i.o.n.........

  ..&...C.o.n.f.i.

  g.u.r.a.t.i.o.n.

  .D.a.t.a.......

  ........I.d.e.n.

  t.i.f.i.e.r.....

  ..B...x.8.6. .F.

  a.m.i.l.y. .6. .

  M.o.d.e.l. .1.5.

  .S.t.e.p.p.i.n.

  g. .2...(...P.r.

  o.c.e.s.s.o.r.N.

  a.m.e.S.t.r.i.n.

  g.......`...I.n.

  t.e.l.(.R.). .C.

  o.r.e.(.T.M.).2.

  .C.P.U. . . . .

  . . . . .T.5.6.

  0.0. . .@. .1...

  8.3.G.H.z..."...

  U.p.d.a.t.e. .S.

  i.g.n.a.t.u.r.e.

  ..............W.

  ......U.p.d.a.t.

  e. .S.t.a.t.u.s.

  ..............".

  ..V.e.n.d.o.r.I.

  d.e.n.t.i.f.i.e.

  r...........G.e.

  n.u.i.n.e.I.n.t.

  e.l.......M.S.R.

[...]

{D03DC06F-D88E-44C5-BA2AFAE035172D19} - 0x438 bytes

  ............Genu

  ntelineI....Genu

  ntelineI........

[...]

  ........Intel(R)

  Core(TMIntel(R)

  Core(TM........

  )2 CPU         T

  )2 CPU         T

  ........5600  @

  1.83GHz.5600  @

  1.83GHz.........

[...]

{E83B40D2-B0A0-4842-ABEA71C9E3463DD1} - 0x184 bytes

  APICh.....APPLE

  Apple00.....Loki

  _.......FACP....

  .aAPPLE Apple00.

  ....Loki_......>

  HPET8.....APPLE

  Apple00.....Loki

  _.......MCFG<...

  ..APPLE Apple00.

  ....Loki_.......

  ASF!.... .APPLE

  Apple00.....Loki

  _.......SBST0...

  ..APPLE Apple00.

  ....Loki_.......

  ECDTS....9APPLE

  Apple00.....Loki

  _.......SSDTO...

  .>APPLE SataPri.

  ....INTL... SSDT

  O....>APPLE Sata

  Pri.....INTL...

  SSDTO....>APPLE

  SataPri.....INTL

{270A33FD-3DA6-460D-BA893C1BAE21E39B} - 0xfc8 bytes

  ........H.......

  H.......H.......

[...]
Of course, this is much more useful if your drivers save additional data for troubleshooting and you have written a WinDbg extension to interpret it.
- Dmitry Vostokov @ DumpAnalysis.org -