Archive for the ‘Trace Analysis Patterns’ Category
Sunday, January 30th, 2011
When reading and analyzing software traces we always compare them to Master Trace. Another name for this pattern borrowed from narrative theory is Archetype. When looking at the software trace from a system we either know the correct sequence of Activity Regions, expect certain Background and Foreground Components, Event Sequence Order or mentally construct a model based on our experience and Implementation Discourse. For the latter example software engineers internalize software master narratives when they construct code and write tracing code for supportability. For the former example it is important to have a repository of traces corresponding to master traces. This helps in finding deviations after Bifurcation Point. Consider such comparisons similar to regression testing when we check the computation output against the expected prerecorded sequence.
- Dmitry Vostokov @ DumpAnalysis.org + TraceAnalysis.org -
Posted in CDF Analysis Tips and Tricks, Debugging, Software Narratology, Software Trace Analysis, Software Trace Reading, Testing, Trace Analysis Patterns | 2 Comments »
Saturday, January 22nd, 2011
Software trace analysis is difficult and it is very common to hear “couldn’t see anything …”. One of advantages of software trace analysis patterns is that we can use that pattern language to write analysis reports. Here I provide an example for an analysis of a CDF trace from Citrix XenApp server. Instead of replying “didn’t find anything suspicious …” an engineer identified the following patterns:
Seeing the list of patterns it was much easier to ask questions to aid in further troubleshooting.
- Dmitry Vostokov @ DumpAnalysis.org + TraceAnalysis.org -
Posted in CDF Analysis Tips and Tricks, Software Behavior Patterns, Software Trace Analysis, Software Trace Reading, Structural Trace Patterns, Trace Analysis Patterns | No Comments »
Saturday, January 15th, 2011
Stack Trace is a general pattern and there can always be found fine-grained patterns in stack traces as well. Here we discuss the general category of such stack trace patterns called Technology-Specific Subtrace (TSST) and give examples related to COM technology.
Consider this trace:
1: kd> k250

ChildEBP RetAddr

8d5d2808 82a7eb15 nt!KiSwapContext+0x26

8d5d2840 82a7d403 nt!KiSwapThread+0x266

8d5d2868 82a772cf nt!KiCommitThreadWait+0x1df

8d5d28e0 82550d75 nt!KeWaitForSingleObject+0x393

8d5d293c 82550e10 win32k!xxxRealSleepThread+0x1d7

8d5d2958 824ff4b0 win32k!xxxSleepThread+0x2d

8d5d29cc 825547e8 win32k!xxxInterSendMsgEx+0xb1c

8d5d2a1c 825546a4 win32k!xxxSendMessageTimeout+0x13b

8d5d2a44 82533843 win32k!xxxSendMessage+0×28

8d5d2b08 824fd865 win32k!xxxCalcValidRects+0xf7

8d5d2b64 82502c98 win32k!xxxEndDeferWindowPosEx+0×100

8d5d2b84 825170c9 win32k!xxxSetWindowPos+0xf6

8d5d2c08 82517701 win32k!xxxActivateThisWindow+0×2b1

8d5d2c38 82517537 win32k!xxxActivateWindow+0×144

8d5d2c4c 824fd9dd win32k!xxxSwpActivate+0×44

8d5d2ca4 82502c98 win32k!xxxEndDeferWindowPosEx+0×278

8d5d2cc4 824fff82 win32k!xxxSetWindowPos+0xf6

8d5d2d10 82a5342a win32k!NtUserSetWindowPos+0×140

8d5d2d10 76ee64f4 nt!KiFastCallEntry+0×12a (TrapFrame @ 8d5d2d34)

01e2cea0 7621358d ntdll!KiFastSystemCallRet

01e2cea4 6a8fa0eb USER32!NtUserSetWindowPos+0xc

01e2cf14 6a894b13 IEFRAME!SHToggleDialogExpando+0×15a

01e2cf28 6a894d5d IEFRAME!EleDlg::ToggleExpando+0×20

01e2d74c 6a895254 IEFRAME!EleDlg::OnInitDlg+0×229

01e2d7b8 762186ef IEFRAME!EleDlg::DlgProcEx+0×189

01e2d7e4 76209eb2 USER32!InternalCallWinProc+0×23

01e2d860 7620b98b USER32!UserCallDlgProcCheckWow+0xd6

01e2d8a8 7620bb7b USER32!DefDlgProcWorker+0xa8

01e2d8c4 762186ef USER32!DefDlgProcW+0×22

01e2d8f0 76218876 USER32!InternalCallWinProc+0×23

01e2d968 76217631 USER32!UserCallWinProcCheckWow+0×14b

01e2d9a8 76209b1d USER32!SendMessageWorker+0×4d0

01e2da64 76235500 USER32!InternalCreateDialog+0xb0d

01e2da94 76235553 USER32!InternalDialogBox+0xa7

01e2dab4 76235689 USER32!DialogBoxIndirectParamAorW+0×37

01e2dad8 6a5d4952 USER32!DialogBoxParamW+0×3f

01e2db00 6a5d5024 IEFRAME!Detour_DialogBoxParamW+0×47

01e2db24 6a8956df IEFRAME!SHFusionDialogBoxParam+0×32

01e2db58 6a8957bb IEFRAME!EleDlg::ShowDialog+0×398

01e2e638 6a8959d3 IEFRAME!ShowDialogBox+0xb6

01e2eb9c 6a9013ed IEFRAME!ShowElevationPrompt+0×1dd

01e2f010 7669fc8f IEFRAME!CIEUserBrokerObject::BrokerCoCreateInstance+0×202

01e2f040 76704c53 RPCRT4!Invoke+0×2a

01e2f448 76d9d936 RPCRT4!NdrStubCall2+0×2d6

01e2f490 76d9d9c6 ole32!CStdStubBuffer_Invoke+0xb6

01e2f4d8 76d9df1f ole32!SyncStubInvoke+0×3c

01e2f524 76cb213c ole32!StubInvoke+0xb9

01e2f600 76cb2031 ole32!CCtxComChnl::ContextInvoke+0xfa

01e2f61c 76d9a754 ole32!MTAInvoke+0×1a

01e2f64c 76d9dcbb ole32!AppInvoke+0xab

01e2f72c 76d9a773 ole32!ComInvokeWithLockAndIPID+0×372

01e2f778 7669f34a ole32!ThreadInvoke+0×302

01e2f7b4 7669f4da RPCRT4!DispatchToStubInCNoAvrf+0×4a

01e2f80c 7669f3c6 RPCRT4!RPC_INTERFACE::DispatchToStubWorker+0×16c

01e2f834 766a0cef RPCRT4!RPC_INTERFACE::DispatchToStub+0×8b

01e2f86c 7669f882 RPCRT4!RPC_INTERFACE::DispatchToStubWithObject+0xb2

01e2f8b8 7669f7a4 RPCRT4!LRPC_SCALL::DispatchRequest+0×23b

01e2f8d8 7669f763 RPCRT4!LRPC_SCALL::QueueOrDispatchCall+0xbd

01e2f8f4 7669f5ff RPCRT4!LRPC_SCALL::HandleRequest+0×34f

01e2f928 7669f573 RPCRT4!LRPC_SASSOCIATION::HandleRequest+0×144

01e2f960 7669ee4f RPCRT4!LRPC_ADDRESS::HandleRequest+0xbd

01e2f9dc 7669ece7 RPCRT4!LRPC_ADDRESS::ProcessIO+0×50a

01e2f9e8 766a1357 RPCRT4!LrpcServerIoHandler+0×16

01e2f9f8 76ecd3a3 RPCRT4!LrpcIoComplete+0×16

01e2fa20 76ed0748 ntdll!TppAlpcpExecuteCallback+0×1c5

01e2fb88 76e11174 ntdll!TppWorkerThread+0×5a4

01e2fb94 76efb3f5 kernel32!BaseThreadInitThunk+0xe

01e2fbd4 76efb3c8 ntdll!__RtlUserThreadStart+0×70

01e2fbec 00000000 ntdll!_RtlUserThreadStart+0×1b
In the middle of the stack trace we see COM interface invocation in IEFRAME module. The similar stack trace fragment can be found in the following stack trace where COM IRemUnknown interface implementation resides in .NET CLR mscorwks module:
0:000> kL

ChildEBP RetAddr

0018a924 68b5f8f0 mscorwks!SafeReleaseHelper+0x77

0018a958 68b04a99 mscorwks!SafeRelease+0x2f

0018a98c 68b04860 mscorwks!IUnkEntry::Free+0x68

0018a9a0 68b049b5 mscorwks!RCW::ReleaseAllInterfaces+0x18

0018a9d0 68b049e1 mscorwks!RCW::ReleaseAllInterfacesCallBack+0xbd

0018aa00 68c0a108 mscorwks!RCW::Cleanup+0x22

0018aa0c 68c0a570 mscorwks!RCWCleanupList::ReleaseRCWListRaw+0x16

0018aa3c 68bd4b3d mscorwks!RCWCleanupList::ReleaseRCWListInCorrectCtx+0xdf

0018aa4c 75dd8c2e mscorwks!CtxEntry::EnterContextCallback+0×89

0018aa68 763c586c ole32!CRemoteUnknown::DoCallback+0×7a

0018aa84 764405f1 rpcrt4!Invoke+0×2a

0018ae88 75efd936 rpcrt4!NdrStubCall2+0×2ea

0018aed0 75efd9c6 ole32!CStdStubBuffer_Invoke+0xb6

0018af18 75efdf1f ole32!SyncStubInvoke+0×3c

0018af64 75e1223c ole32!StubInvoke+0xb9

0018b040 75e12131 ole32!CCtxComChnl::ContextInvoke+0xfa

0018b05c 75e130fa ole32!MTAInvoke+0×1a

0018b088 75efde47 ole32!STAInvoke+0×46

0018b0bc 75efdcbb ole32!AppInvoke+0xab

0018b19c 75efe34c ole32!ComInvokeWithLockAndIPID+0×372

0018b1c4 75e12ed2 ole32!ComInvoke+0xc5

0018b1d8 75e12e91 ole32!ThreadDispatch+0×23

0018b21c 75a06238 ole32!ThreadWndProc+0×161

0018b248 75a068ea user32!InternalCallWinProc+0×23

0018b2c0 75a07d31 user32!UserCallWinProcCheckWow+0×109

0018b320 75a07dfa user32!DispatchMessageWorker+0×3bc

0018b330 75ddd6be user32!DispatchMessageW+0xf

0018b360 75ddd66d ole32!CCliModalLoop::PeekRPCAndDDEMessage+0×4c

0018b390 75ddd57e ole32!CCliModalLoop::FindMessage+0×30

0018b3f0 75ddd633 ole32!CCliModalLoop::HandleWakeForMsg+0×41

0018b408 75dd1117 ole32!CCliModalLoop::BlockFn+0xc3

0018b488 68a6c905 ole32!CoWaitForMultipleHandles+0xcd

0018b4a8 68a6c866 mscorwks!NT5WaitRoutine+0×51

0018b514 68a6c7ca mscorwks!MsgWaitHelper+0xa5

0018b534 68b5fbe4 mscorwks!Thread::DoAppropriateAptStateWait+0×28

0018b5b8 68b5fc79 mscorwks!Thread::DoAppropriateWaitWorker+0×13c

0018b608 68b5fdf9 mscorwks!Thread::DoAppropriateWait+0×40

0018b664 68a1c5b6 mscorwks!CLREvent::WaitEx+0xf7

0018b678 68b1adb4 mscorwks!CLREvent::Wait+0×17

0018b6c8 68b1ab2a mscorwks!WKS::GCHeap::FinalizerThreadWait+0xfb

0018b764 08fa12c1 mscorwks!GCInterface::RunFinalizers+0×99

[…]
A TSST usually spans several modules. In any stack trace we can also find several TSST that may be overlapping. For example, in the first stack trace above we can discern fragments of COM, RPC, LPC, GUI Dialog, Window Management, and Window Messaging subtraces. In the second trace we can also see GC, Modal Loop, COM Wrapper, and Interface Management stack frames.
The closest software trace analysis pattern here is Implementation Discourse.
- Dmitry Vostokov @ DumpAnalysis.org + TraceAnalysis.org -
Posted in .NET Debugging, COM Debugging, Crash Dump Analysis, Crash Dump Patterns, Debugging, Software Trace Analysis, Software Trace Reading, Trace Analysis Patterns | 1 Comment »
Saturday, January 1st, 2011
With the new year starts the new initiative to integrate traditional multidisciplinary debugging approaches and methodologies with multiplatform pattern-driven software problem solving, unified debugging patterns, best practices in memory dump analysis and software tracing, computer security, economics, and the new emerging trends I’m going to write about during this year.
- Dmitry Vostokov @ DumpAnalysis.org + TraceAnalysis.org -
Posted in Announcements, Best Practices, Computer Forensics, Computer Science, Countefactual Debugging, Crash Analysis Report Environment (CARE), Crash Dump Analysis, Crash Dump Patterns, DebugWare Patterns, Debugging, Debugging Industry, Debugging Methodology, Debugging Trends, Dublin School of Security, Economics, Education and Research, Escalation Engineering, First Fault Problem Solving, Malware Analysis, Malware Patterns, Mathematics of Debugging, Memiotics (Memory Semiotics), Memoretics, Memory Analysis Forensics and Intelligence, Memory Analysis Report System, Memory Dump Analysis Services, Memory Systems Language, Memory Visualization, New Debugging School, Science of Memory Dump Analysis, Science of Software Tracing, Security, Software Behavior Patterns, Software Defect Construction, Software Engineering, Software Generalist, Software Maintenance Institute, Software Narratology, Software Trace Analysis, Software Trace Visualization, Software Tracing Implementation Patterns, Software Troubleshooting Patterns, Structural Memory Patterns, Structural Trace Patterns, Systems Thinking, Testing, Tool Objects, Tools, Trace Analysis Patterns, Training and Seminars, Troubleshooting Methodology, Unified Debugging Patterns, Victimware, Visual Dump Analysis, Webinars, Workaround Patterns | No Comments »
Wednesday, December 29th, 2010
In these post series we are going to discuss the best practices for software tracing implementation including appropriate patterns and their links to software trace analysis patterns. The first one is called Period Timestamp where the start and the end time (and the date if necessary) are recorded in the trace file. This helps in Inter-Correlation and News Value analysis between several different trace types. For example, in one scenario, we had WindowHistory and MessageHistory logs. We identified a problem in the former log as happening at this time:
Handle: 00010196 Class: "ClassA" Title: "TitleA"

   Captured at: 13:36:30:533

[…]
However, when we looked at the latter trace to search for specific window messages posted or sent before that time we saw that the recording started later than the former event:
Start time: 13:36:35:830
Period timestamps are necessary to distinguish Incomplete History from Truncated Trace where in the former case the absence of expected trace message is due to some problem.
From a unified debugging patterns perspective we have this sequence fragment:
Implementation Patterns: Period Timestamp
Usage Patterns: Trace Simultaneously
- Dmitry Vostokov @ DumpAnalysis.org + TraceAnalysis.org -
Posted in Best Practices, Debugging, Debugging Methodology, Software Architecture, Software Engineering, Software Narratology, Software Technical Support, Software Trace Analysis, Software Trace Reading, Software Tracing Implementation Patterns, Trace Analysis Patterns, Troubleshooting Methodology, Unified Debugging Patterns | No Comments »
Friday, December 24th, 2010
News Value is a pattern that assigns relative importance to software traces for problem solving purposes especially when related to problem description, recent incidents and timestamps of other supporting artifacts (memory dumps, other traces, etc.). For example, in one scenario, an ETW trace was provided with 3 additional log files:
# Source PID  TID  Date       Time         Message

0 Header 1260 1728 12/14/2010 06:48:56.289 ?????

[…]

215301 Unknown 640 808 12/14/2010 07:22:57.508 ?????  Unknown( 16): GUID=[…] (No Format Information found).
// LogA

05/11/10 18:28:15.1562 : Service() - entry

[...]

14/12/10 10:31:58.0381 : Notification: sleep

* Start of new log *

14/12/10 10:34:38.4687 : Service() - entry

[…]

14/12/10 11:53:35.2729 : Service.CleanUp complete

* Start of new log *

14/12/10 11:56:11.7031 : Service() - entry

[…]

14/12/10 15:25:23.3004 : Notification: sleep
// LogB

[   1] 12/14 10:34:29:890   Entry: ctor

[…]

[   2] 12/14 11:53:30:866   Exit: COMServer.Server.DeleteObject
// LogC

[   1] 12/14 11:56:03:359   Entry: ctor

[…]

[  20] 12/14 15:30:20:110   Exit: Kernel32.Buffer.Release
From the description of the problem we expected LogB and LogC to be logs from two subsequent process executions where the first launch fails (LogB) and the second launch succeeds (LogC). Looking at their start and end times we see that they make sense from the problem description perspective but we have to dismiss ETW trace and most of LogA as recorded earlier and having no value for Inter-Correlation analysis of the more recent logs. We also see that portions of LogA overlap with LogB and LogC and therefore having analysis value for us.
- Dmitry Vostokov @ DumpAnalysis.org + TraceAnalysis.org -
Posted in CDF Analysis Tips and Tricks, Debugging, Software Trace Analysis, Software Trace Reading, Trace Analysis Patterns | No Comments »
Friday, December 17th, 2010
As the new decade is approaching (2011-2020) we would like to make a few previews and predictions:
- Increased complexity of software will bring more methods from biological, social sciences and humanities in addition to existing methods of automated debugging and computer science techniques
- Focus on first fault software problem solving (when aspect)
- Focus on pattern-driven software problem solving (how aspect)
- Fusion of debugging and malware analysis into a unified structural and behavioral pattern framework
- Visual debugging, memory and software trace visualization techniques
- Software maintenance certification
- Focus on domain-driven troubleshooting and debugging tools as a service (debugware TaaS)
- Focus on security issues related to memory dumps and software traces
- New scripting languages and programming language extensions for debugging
- The maturation of the science of memory snapshots and software traces (memoretics)
Imagining is not not limited to the above and more to come and explain in the forthcoming parts.
- Dmitry Vostokov @ DumpAnalysis.org + TraceAnalysis.org -
Posted in Announcements, Anthropology, Archaeology of Computer Memory, Biology, Certification, Computer Science, Countefactual Debugging, Crash Analysis Report Environment (CARE), Crash Dump Analysis, Crash Dump Patterns, DebugWare Patterns, Debugging, Debugging Industry, Debugging Methodology, Debugging Trends, Dublin School of Security, EasyDbg, Economics, Escalation Engineering, Evolution, First Fault Problem Solving, Futuristic Memory Dump Analysis, General Memory Analysis, General Science, Geography, Hardware, Hermeneutics of Memory Dumps and Traces, History, Humanities, Language, Laws of Troubleshooting and Debugging, Logic, Malware Analysis, Malware Patterns, Mathematics of Debugging, Memiotics (Memory Semiotics), Memoretics, Memory Analysis Forensics and Intelligence, Memory Analysis Report System, Memory Dump Analysis and History, Memory Systems Language, Memory Visualization, Paleo-debugging, Pattern Models, Pattern Prediction, Physics, Psychology, Publishing, Science of Memory Dump Analysis, Science of Software Tracing, Security, Social Media, Social Sciences, Software Architecture, Software Behavior Patterns, Software Chorography, Software Chorology, Software Defect Construction, Software Engineering, Software Generalist, Software Maintenance Institute, Software Narrative Fiction, Software Narratology, Software Technical Support, Software Trace Analysis, Software Trace Analysis and History, Software Trace Deconstruction, Software Trace Linguistics, Software Trace Visualization, Software Troubleshooting Patterns, Software Victimology, Statistics, Structural Memory Analysis and Social Sciences, Structural Memory Patterns, Structural Trace Patterns, Systems Thinking, Testing, Tools, Trace Analysis Patterns, Troubleshooting Methodology, Unified Debugging Patterns, Uses of UML, Victimware, Virtualization, Visual Dump Analysis, Windows System Administration, Workaround Patterns | No Comments »
Tuesday, December 7th, 2010
If we look at any non-trivial trace we would see different Implementation Discourses. Components are written in different languages and adhere to different runtime environments, binary models and interface frameworks. All these implementation variations influence the structure, syntax and semantics of trace messages. For example, .NET debugging traces differ from file system driver or COM debugging messages. Therefore we establish the new field of Software Trace Linguistics as a science of software trace languages. Some parallels can be drawn here towards software linguistics (the science of software languages) although we came to that conclusion independently while thinking about applying “ethnography of speaking” to software trace narration. More on this in the following posts.
- Dmitry Vostokov @ DumpAnalysis.org + TraceAnalysis.org -
Posted in CDF Analysis Tips and Tricks, Debugging, Software Narratology, Software Trace Analysis, Software Trace Linguistics, Software Trace Reading, Trace Analysis Patterns | No Comments »
Friday, December 3rd, 2010
We now start unifying software behavior analysis patterns with debugging architecture, design, implementation and usage. This is analogous to software construction where a problem analysis leads to various software engineering phases. The important difference here is the addition of debugging usage patterns. Let’s look at an example (we discuss suggested patterns later):
- Analysis Patterns
Shared Buffer Overwrite
- Architectural Patterns
Debug Event Subscription / Notification
- Design Patterns
Punctuated Execution
- Implementation Patterns
Breakpoint (software and hardware)
- Usage Patterns
Kernel vs. user space breakpoints
To differentiate this systematic approach from the various published ad hoc debugging patterns we call it Unified Debugging Pattern Language. ADI parts can also correspond to various DebugWare patterns where we provide a mapping later.
- Dmitry Vostokov @ DumpAnalysis.org + TraceAnalysis.org -
Posted in Crash Dump Analysis, Crash Dump Patterns, DebugWare Patterns, Debugging, Software Architecture, Software Behavior Patterns, Software Engineering, Software Trace Analysis, Trace Analysis Patterns, Unified Debugging Patterns | No Comments »
Tuesday, November 30th, 2010
MAaaS includes 2 complementary DA+TA services:
1. Dump Analysis as a Service (DAaaS)
2. Trace Analysis as a Service (TAaaS)
Memory Dump Analysis Services is the first organization to provide such a service at an audit and certification levels.
- Dmitry Vostokov @ DumpAnalysis.org + TraceAnalysis.org -
Posted in Certification, Complete Memory Dump Analysis, Crash Analysis Report Environment (CARE), Crash Dump Analysis, Crash Dump Patterns, Debugging, Dublin School of Security, Escalation Engineering, Malware Analysis, Malware Patterns, Memiotics (Memory Semiotics), Memoretics, Memory Analysis Forensics and Intelligence, Memory Analysis Report System, Memory Dump Analysis Services, Minidump Analysis, Security, Software Behavior Patterns, Software Technical Support, Software Trace Analysis, Software Trace Reading, Structural Memory Patterns, Structural Trace Patterns, Tools, Trace Analysis Patterns, Windows System Administration | No Comments »
Thursday, November 25th, 2010
Posted in Announcements, Complete Memory Dump Analysis, Crash Analysis Report Environment (CARE), Crash Dump Analysis, Crash Dump De-analysis, Crash Dump Patterns, Debugging, Debugging Industry, Escalation Engineering, Kernel Development, Memory Analysis Forensics and Intelligence, Memory Dump Analysis Services, Minidump Analysis, Software Behavior Patterns, Software Engineering, Software Technical Support, Software Trace Analysis, Software Troubleshooting Patterns, Tools, Trace Analysis Patterns, Vista, Windows 7, Windows Server 2008, Windows System Administration, Workaround Patterns, x64 Windows | No Comments »
Wednesday, November 24th, 2010
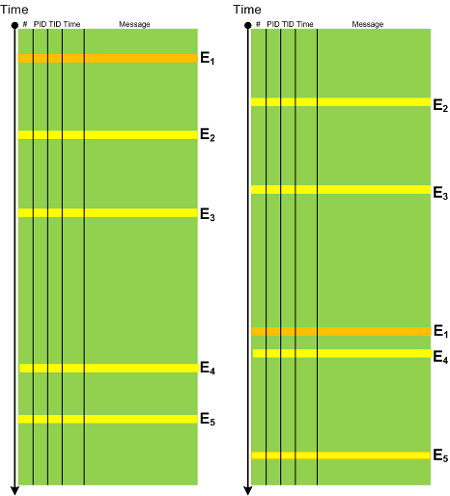
In any system there is an expected Event Sequence Order as a precondition to its normal behaviour. Any out-of-order events should raise the suspicion bar as they might result or lead to synchronization problems. It need not be a sequence of trace messages from different threads but also between processes, for example, image load events in CDF / ETW traces can indicate a misconfiguration in service startup order. The following diagram depicts a possible pattern scenario:
- Dmitry Vostokov @ DumpAnalysis.org + TraceAnalysis.org -
Posted in CDF Analysis Tips and Tricks, Debugging, Software Trace Analysis, Trace Analysis Patterns | No Comments »
Monday, November 15th, 2010
This is a synthesized case study with the simplified ETW trace output based on real events (consider it as an exercise in a software narrative fiction). In a client-server environment a server session was always active regardless of whether a client was active or not. There was a workaround to enable a registry key to force checking for user activity via CheckActivity registry key. Unfortunately this didn’t help and a software trace was recorded for the offline analysis. First, we checked for Basic Facts and found the correspondence that confirmed the registry key setting:
#      PID  TID  Message

[...]

3200   1428 5476 CheckActivity = 1

[...]
There was also Periodic Errors throughout the whole trace fabric:
#       PID  TID  Message

[...]

119097  2468 476  Security check failed

[...]
Although such errors happened in a number of support incidents we see a message text we have never seen and couldn’t even find in our database of incidents (Defamiliarizing Effect):
#      PID  TID  Message

[...]

119090 2468 476  Calling the third party security information provider

119091 2468 476  Get security information: failed

[...]
Therefore we advised to test with the 3rd party security provider disabled. The software story continues…
- Dmitry Vostokov @ DumpAnalysis.org + TraceAnalysis.org -
Posted in CDF Analysis Tips and Tricks, Debugging, Software Narrative Fiction, Software Trace Analysis, Trace Analysis Patterns | No Comments »
Friday, November 12th, 2010
Five volumes of cross-disciplinary Anthology (dubbed by the author “The Summa Memorianica”) lay the foundation of the scientific discipline of Memoretics (study of computer memory snapshots and their evolution in time) that is also called Memory Dump and Software Trace Analysis.ca
The 5th volume contains revised, edited, cross-referenced, and thematically organized selected DumpAnalysis.org blog posts about crash dump, software trace analysis and debugging written in February 2010 - October 2010 for software engineers developing and maintaining products on Windows platforms, quality assurance engineers testing software on Windows platforms, technical support and escalation engineers dealing with complex software issues, and security researchers, malware analysts and reverse engineers. The fifth volume features:
- 25 new crash dump analysis patterns
- 11 new pattern interaction case studies (including software tracing)
- 16 new trace analysis patterns
- 7 structural memory patterns
- 4 modeling case studies for memory dump analysis patterns
- Discussion of 3 common analysis mistakes
- Malware analysis case study
- Computer independent architecture of crash analysis report service
- Expanded coverage of software narratology
- Metaphysical and theological implications of memory dump worldview
- More pictures of memory space and physicalist art
- Classification of memory visualization tools
- Memory visualization case studies
- Close reading of the stories of Sherlock Holmes: Dr. Watson’s observational patterns
- Fully cross-referenced with Volume 1, Volume 2, Volume 3, and Volume 4
Product information:
- Title: Memory Dump Analysis Anthology, Volume 5
- Author: Dmitry Vostokov
- Language: English
- Product Dimensions: 22.86 x 15.24
- Paperback: 400 pages
- Publisher: Opentask (10 December 2010)
- ISBN-13: 978-1-906717-96-4
- Hardcover: 400 pages
- Publisher: Opentask (10 December 2010)
- ISBN-13: 978-1-906717-97-1

Back cover features memory space art image Hot Computation: Memory on Fire.
- Dmitry Vostokov @ DumpAnalysis.org + TraceAnalysis.org -
Posted in Aesthetics of Memory Dumps, Announcements, Archaeology of Computer Memory, Art, Assembly Language, Books, C and C++, CDF Analysis Tips and Tricks, Categorical Debugging, Common Mistakes, Complete Memory Dump Analysis, Computer Science, Crash Analysis Report Environment (CARE), Crash Dump Analysis, Crash Dump De-analysis, Crash Dump Patterns, Debugging, Debugging Methodology, Debugging Slang, Deep Down C++, Dr. Watson, Dublin School of Security, Education and Research, Escalation Engineering, Fun with Crash Dumps, Fun with Debugging, Fun with Software Traces, General Memory Analysis, Hermeneutics of Memory Dumps and Traces, Images of Computer Memory, Kernel Development, Malware Analysis, Malware Patterns, Mathematics of Debugging, Memiotics (Memory Semiotics), Memoidealism, Memoretics, Memory Analysis Culture, Memory Analysis Forensics and Intelligence, Memory Analysis Report System, Memory Diagrams, Memory Dreams, Memory Dump Analysis Jobs, Memory Dump Analysis Services, Memory Dump Analysis and History, Memory Dumps in Movies, Memory Dumps in Myths, Memory Religion (Memorianity), Memory Space Art, Memory Systems Language, Memory Visualization, Memory and Glitches, Memuonics, Metaphysical Society of Ireland, Minidump Analysis, Movies and Debugging, Multithreading, Museum of Debugging, Music for Debugging, Music of Computation, New Acronyms, New Words, Paleo-debugging, Pattern Models, Pattern Prediction, Philosophy, Physicalist Art, Psychoanalysis of Software Maintenance and Support, Publishing, Science of Memory Dump Analysis, Science of Software Tracing, Security, Software Architecture, Software Behavior Patterns, Software Chorography, Software Chorology, Software Defect Construction, Software Engineering, Software Generalist, Software Maintenance Institute, Software Narratology, Software Technical Support, Software Trace Analysis, Software Trace Analysis and History, Software Trace Deconstruction, Software Trace Reading, Software Trace Visualization, Software Tracing for Dummies, Software Troubleshooting Patterns, Software Victimology, Stack Trace Collection, Structural Memory Analysis and Social Sciences, Structural Memory Patterns, Structural Trace Patterns, Systems Thinking, Testing, Theology, Tool Objects, Tools, Trace Analysis Patterns, Training and Seminars, Troubleshooting Methodology, Uses of UML, Victimware, Virtualization, Vista, Visual Dump Analysis, Webinars, WinDbg Scripts, WinDbg Tips and Tricks, WinDbg for GDB Users, Windows 7, Windows Server 2008, Windows System Administration, Workaround Patterns, x64 Windows | No Comments »
Saturday, November 6th, 2010
I’m pleased to announce that MDAA, Volume 4 is available in PDF format:
www.dumpanalysis.org/Memory+Dump+Analysis+Anthology+Volume+4
It features:
- 15 new crash dump analysis patterns
- 13 new pattern interaction case studies
- 10 new trace analysis patterns
- 6 new Debugware patterns and case study
- Workaround patterns
- Updated checklist
- Fully cross-referenced with Volume 1, Volume 2 and Volume 3
- Memory visualization tutorials
- Memory space art
Its table of contents is available here:
http://www.dumpanalysis.org/MDAA/MDA-Anthology-V4-TOC.pdf
Paperback and hardcover versions should be available in a week or two. I also started working on Volume 5 that should be available in December.
- Dmitry Vostokov @ DumpAnalysis.org + TraceAnalysis.org -
Posted in .NET Debugging, Aesthetics of Memory Dumps, Announcements, AntiPatterns, Art, Assembly Language, Books, C and C++, CDF Analysis Tips and Tricks, Categorical Debugging, Common Mistakes, Complete Memory Dump Analysis, Computer Science, Countefactual Debugging, Crash Dump Analysis, Crash Dump Patterns, DebugWare Patterns, Debugging, Debugging Slang, Deep Down C++, Education and Research, Escalation Engineering, Fun with Crash Dumps, Fun with Debugging, Images of Computer Memory, Kernel Development, Memiotics (Memory Semiotics), Memoidealism, Memoretics, Memory Space Art, Memory Visualization, Memuonics, Metaphysics of Memory Worldview, Multithreading, Opcodism, Philosophy, Physicalist Art, Publishing, Science Fiction, Science of Memory Dump Analysis, Science of Software Tracing, Security, Software Architecture, Software Behavior Patterns, Software Defect Construction, Software Engineering, Software Narratology, Software Technical Support, Software Trace Analysis, Software Trace Reading, Software Victimology, Stack Trace Collection, Testing, Tools, Trace Analysis Patterns, Troubleshooting Methodology, Uses of UML, Victimware, Virtualization, Vista, Visual Dump Analysis, WinDbg Scripts, WinDbg Tips and Tricks, Windows 7, Windows Server 2008, Windows System Administration, Workaround Patterns, x64 Windows | No Comments »
Thursday, November 4th, 2010
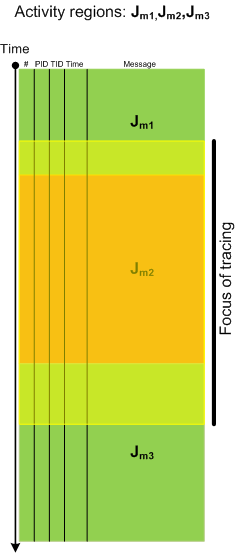
Activity Region pattern highlights “mechanical” and syntactical aspects of trace analysis whereas Focus of Tracing brings attention to changing semantics of trace message flow, for example in Citrix terminal services environment, from logon messages during session initialization to LHC database search. Here is a graphical illustration of this pattern where tracing focus region spans 3 regions of activity:
- Dmitry Vostokov @ DumpAnalysis.org + TraceAnalysis.org -
Posted in Debugging, Software Narratology, Software Trace Analysis, Software Trace Reading, Trace Analysis Patterns | No Comments »
Wednesday, November 3rd, 2010
I have discovered rules that make it possible to devise a memory dump and software trace analysis equivalent of the Periodic Table of Elements in Chemistry. It allows prediction of abnormal software behaviour and structural defects and what patterns to look for after deploying software and collecting its artifacts. More on this is in the next part of these series.
- Dmitry Vostokov @ DumpAnalysis.org + TraceAnalysis.org -
Posted in Announcements, Chemistry, Crash Dump Analysis, Crash Dump Patterns, Debugging, Pattern Prediction, Software Behavior Patterns, Software Trace Analysis, Structural Memory Patterns, Structural Trace Patterns, Trace Analysis Patterns | No Comments »
Wednesday, November 3rd, 2010
There are two trace reading practices with techniques borrowed from structuralist and post-structuralist narratology:
1. Close reading
- emphasizes structural patterns
- looks at a software trace as a unity of messages
- searches for similarities, repetitions and contrasts
- reveals code reflections in message texts
2. Deconstructive reading
- reveals subconscious exposed in message texts
- searches for conflicting and absent messages
- looks at a software trace as a disunity of messages from conflicting components
- Dmitry Vostokov @ DumpAnalysis.org + TraceAnalysis.org -
Posted in Debugging, Software Behavior Patterns, Software Narratology, Software Trace Analysis, Software Trace Deconstruction, Software Trace Reading, Structural Trace Patterns, Trace Analysis Patterns | No Comments »
Friday, October 22nd, 2010
I detour for MARS expedition. You may also call it Memory Analysis Report System as malware analysis is always exploration of memory (in general). Why is this sudden change of course? After reading Gilles Deleuze I want to broaden the concept of “malware” and give it new orientation and direction of thinking. Beside that I also want new challenges after many years of research in pattern-driven memory dump and software trace analysis of abnormal software behaviour.
You may have also noticed small restructuring (rebranding) of this blog and DumpAnalysis.org headers.
See you there 
- Dmitry Vostokov @ DumpAnalysis.org + TraceAnalysis.org -
Posted in Announcements, Archaeology of Computer Memory, Assembly Language, Computer Science, Education and Research, General Memory Analysis, Malware Analysis, Malware Patterns, Memiotics (Memory Semiotics), Memoretics, Memory Analysis Forensics and Intelligence, Memory Analysis Report System, Memory Dump Analysis Services, New Acronyms, Philosophy, Science of Memory Dump Analysis, Science of Software Tracing, Security, Software Trace Analysis, Software Victimology, Structural Memory Patterns, Systems Thinking, Tools, Trace Analysis Patterns, Victimware, Windows System Administration | No Comments »
Wednesday, October 20th, 2010
As a practical example of applying behavioral and structural pattern analysis of computer memory and traces OpenTask plans to publish the following title next year:
- Title: Malware Patterns: Structure and Behavior of Computer Adware, Crimeware, Rootkits, Scareware, Spyware, Trojans, Viruses, Victimware and Worms
- Author: Dmitry Vostokov
- Paperback: 1200 pages
- Publisher: OpenTask (October 2011)
- ISBN-13: 978-1-908043-01-6
The inclusion of victimware is necessary because of the effects of defective malware.
- Dmitry Vostokov @ DumpAnalysis.org + TraceAnalysis.org -
Posted in Announcements, Books, Crash Dump Analysis, Crash Dump Patterns, Malware Analysis, Malware Patterns, Memiotics (Memory Semiotics), Memoretics, Memory Analysis Forensics and Intelligence, Publishing, Science of Memory Dump Analysis, Science of Software Tracing, Security, Software Behavior Patterns, Software Defect Construction, Software Trace Analysis, Software Victimology, Structural Memory Patterns, Trace Analysis Patterns, Victimware | No Comments »