Archive for the ‘Trace Analysis Patterns’ Category
Wednesday, September 21st, 2011
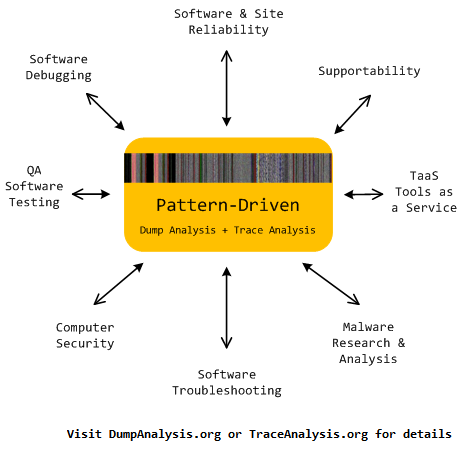
Memoretics promotes pattern-driven memory dump and software trace analysis which has many uses but not limited to:
- Software and site reliability
- Software Debugging
- QA and Software Testing
- Computer Security
- Software Troubleshooting
- Malware Research and Analysis
- Tools as a Service (TaaS)
- Supportability
- Software Diagnostics
- Dmitry Vostokov @ DumpAnalysis.org + TraceAnalysis.org -
Posted in Cloud Memory Dump Analysis, Computer Forensics, Crash Dump Analysis, Crash Dump Patterns, DebugWare Patterns, Debugging, Debugging Trends, Escalation Engineering, Malware Analysis, Malware Patterns, Memiotics (Memory Semiotics), Memoretics, Memory Analysis Forensics and Intelligence, Metadefect Template Library, Metamalware, Pattern Models, Pattern Prediction, Reverse Engineering, Root Cause Analysis, Science of Memory Dump Analysis, Science of Software Tracing, Security, Software Behavior DNA, Software Behavior Patterns, Software Behavioral Genome, Software Defect Construction, Software Engineering, Software Generalist, Software Narratology, Software Support Patterns, Software Technical Support, Software Trace Analysis, Software Troubleshooting Patterns, Structural Memory Patterns, Structural Trace Patterns, Systems Thinking, Testing, Tools, Trace Analysis Patterns, Troubleshooting Methodology, UI Problem Analysis Patterns, Unified Debugging Patterns, Victimware, Windows System Administration, Workaround Patterns | No Comments »
Wednesday, September 21st, 2011
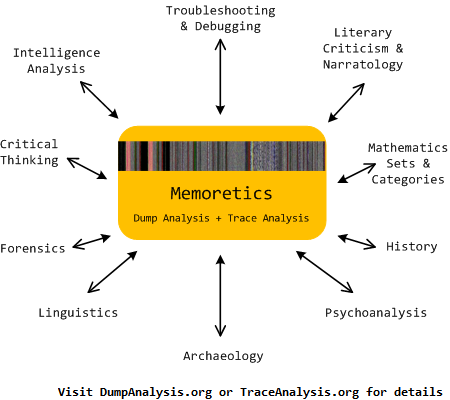
Memoretics as a science of memory snapshots borrows many ideas from the following disciplines (the list is not exhaustive):
- Troubleshooting and Debugging
- Intelligence Analysis
- Critical Thinking
- Forensics
- Linguistics
- Archaeology
- Psychoanalysis
- History
- Mathematics: Sets and Categories
- Literary Criticism and Narratology
It also contributes many ideas back. The following diagram depicts such an interaction:
- Dmitry Vostokov @ DumpAnalysis.org + TraceAnalysis.org -
Posted in Archaeology of Computer Memory, Categorical Debugging, Computer Forensics, Computer Science, Countefactual Debugging, Crash Dump Analysis, Crash Dump De-analysis, Crash Dump Patterns, Debugging, Debugging Methodology, Dublin School of Security, Education and Research, Escalation Engineering, General Memory Analysis, Generative Debugging, Hermeneutics of Memory Dumps and Traces, History, Intelligence Analysis Patterns, M->analysis, Malware Analysis, Malware Patterns, Mathematics of Debugging, Memiotics (Memory Semiotics), Memoretics, Memory Analysis Forensics and Intelligence, Memory Dump Analysis and History, Memory Systems Language, Memory Visualization, Metadefect Template Library, Metamalware, New Debugging School, Paleo-debugging, Pattern Models, Pattern Prediction, Psychoanalysis of Software Maintenance and Support, Psychology, Reverse Engineering, Root Cause Analysis, Science of Memory Dump Analysis, Science of Software Tracing, Security, Software Architecture, Software Behavior DNA, Software Behavior Patterns, Software Behavioral Genome, Software Chorography, Software Chorology, Software Defect Construction, Software Engineering, Software Narratology, Software Technical Support, Software Trace Analysis, Software Trace Analysis and History, Software Trace Deconstruction, Software Trace Linguistics, Software Trace Reading, Software Trace Visualization, Software Tracing Implementation Patterns, Software Troubleshooting Patterns, Software Victimology, Software and History, Structural Memory Analysis and Social Sciences, Structural Memory Patterns, Structural Trace Patterns, Systems Thinking, Testing, Tools, Trace Analysis Patterns, Troubleshooting Methodology, UI Problem Analysis Patterns, Unified Debugging Patterns, Victimware, Virtualization, Visual Dump Analysis, Workaround Patterns | No Comments »
Saturday, September 17th, 2011
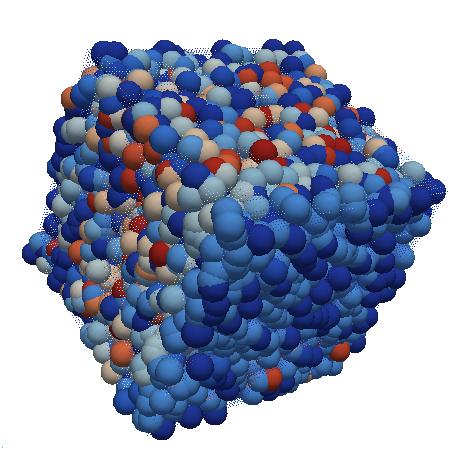
Whereas DNA of a ruptured computation is a coarse grained, software behavioral genome in general is fine grained consisting of multiple behavioral patterns such as seen in memory dumps and software traces. I will elaborate more on it later especially in relation to software behavior profiles. Here’s a nice “memory DNA” metaphorical picture from 3D memory visualization post:
- Dmitry Vostokov @ DumpAnalysis.org + TraceAnalysis.org -
Posted in Announcements, Crash Dump Patterns, Memory Visualization, Software Behavior DNA, Software Behavior Patterns, Software Behavioral Genome, Trace Analysis Patterns | No Comments »
Wednesday, September 14th, 2011
Original Message pattern deals with software trace messages where certain activity is repeated several times but the only the first message occurrence or specific message vocabulary has significance for analysis activity. Typical example from CDF/ETW tracing is module load events:
#     Module  PID   TID   Time         Message

[...]

35835 ModuleA 11000 11640 17:27:28.720 LoadImageEvent: \Device\HarddiskVolume2\Windows\System32\userinit.exe PId 5208

[…]

37684 ModuleA 12332 9576  17:27:29.063 LoadImageEvent: \Windows\System32\userinit.exe PId 573C

[…]

37687 ModuleA 12332 9576  17:27:29.064 LoadImageEvent: \Windows\System32\userinit.exe PId 573C

[…]
What we are looking here is for message invariant like “.exe” but interested in the occurrence of specific path structures like \Device\HarddiskVolume because in our troubleshooting context they signify process launch sequence during terminal session initialization.
- Dmitry Vostokov @ DumpAnalysis.org + TraceAnalysis.org -
Posted in CDF Analysis Tips and Tricks, Debugging, Software Trace Analysis, Software Trace Reading, Trace Analysis Patterns | No Comments »
Thursday, July 28th, 2011
UI Message pattern is very useful for troubleshooting system-wide issues because we can map visual behaviour to various activity regions and consider such messages as significant events.
#    Module  PID  TID  Time         Message

[...]

2782 ModuleA 2124 5648 10:58:03.356 CreateWindow: Title "..." Class "..."

[...]

3512 ModuleA 2124 5648 10:58:08.154 Menu command: Save Data

[...]

3583 ModuleA 2124 5648 10:58:08.155 CreateWindow: Title "Save As" Class "Dialog"

[... Data update and replication related messages ...]

4483 ModuleA 2124 5648 10:58:12.342 DestroyWindow: Title "Save As" Class "Dialog"

[...]
By filtering the emitting module we can create an adjoint thread:
#    Module  PID  TID  Time         Message

[...]

2782 ModuleA 2124 5648 10:58:03.356 CreateWindow: Title "..." Class "..."

3512 ModuleA 2124 5648 10:58:08.154 Menu command: Save Data

3583 ModuleA 2124 5648 10:58:08.155 CreateWindow: Title "Save As" Class "Dialog"

4483 ModuleA 2124 5648 10:58:12.342 DestroyWindow: Title "Save As" Class "Dialog"

[...]
- Dmitry Vostokov @ DumpAnalysis.org + TraceAnalysis.org -
Posted in CDF Analysis Tips and Tricks, Debugging, Software Trace Analysis, Software Trace Reading, Trace Analysis Patterns | 4 Comments »
Sunday, May 22nd, 2011
Being deep into intelligence analysis while preparing for cyberwarfare memory dump analysis presentation I came to an idea of intelligence analysis patterns based on software trace analysis patterns and software narratology. Basically we consider intelligence data as pseudo-software trace messages with an additional probability field (column). Most of the patterns can be transferred and used immediately in intelligence analysis and I’m working on such a map. Because real software trace messages are quite certain (deterministic) where their sequences sometimes not (see, for example, Impossible Trace pattern) there are some unique patterns applicable only in intelligence analysis domain and I’m working on the first such pattern to introduce it in the next part.
- Dmitry Vostokov @ DumpAnalysis.org + TraceAnalysis.org -
Posted in Cyber Warfare, Intelligence Analysis Patterns, Memory Analysis Forensics and Intelligence, Security, Software Narratology, Software Trace Analysis, Software Trace Analysis and History, Trace Analysis Patterns | No Comments »
Saturday, May 21st, 2011
Posted in Announcements, Debugging, EasyDbg, Memory Analysis Forensics and Intelligence, New Acronyms, Software Trace Analysis, Software Trace Reading, Tool Objects, Tools, Trace Analysis Patterns | No Comments »
Sunday, May 15th, 2011
Presentation Software Trace and Memory Dump Analysis: Patterns, Tools, Processes and Best Practices from E2E Virtualization Conference (13th of May, 2011) is available for download:
http://www.dumpanalysis.com/STMDA-materials
- Dmitry Vostokov @ DumpAnalysis.org + TraceAnalysis.org -
Posted in Announcements, Debugging, Debugging Methodology, Escalation Engineering, Presentations, Root Cause Analysis, Software Behavior Patterns, Software Technical Support, Software Trace Analysis, Software Trace Reading, Tools, Trace Analysis Patterns, Training and Seminars, Troubleshooting Methodology | No Comments »
Sunday, May 1st, 2011
Most of the time software trace messages coming from the same source code fragment (PLOT) contain invariant parts such as function and variable names, descriptions, and mutable parts such as pointer values and error codes. Message Invariant is a pattern useful for comparative analysis of several trace files where we are interested in message differences. For example, in one troubleshooting scenario certain objects were not created correctly for one user. We suspected a different object version was linked to a user profile. Separate application debug traces were recorded for each user and we could see version 0×4 for the problem user and 0×5 for all other normal users:
#    Module  PID  TID  Time         Message

[...]

2782 ModuleA 2124 5648 10:58:03.356 CreateObject: pObject 0×00A83D30 data ([…]) version 0×4

[…]
#    Module  PID  TID  Time         Message

[...]

4793 ModuleA 2376 8480 09:22:01.947 CreateObject: pObject 0×00BA4E20 data ([…]) version 0×5

[…]
- Dmitry Vostokov @ DumpAnalysis.org + TraceAnalysis.org -
Posted in CDF Analysis Tips and Tricks, Debugging, Software Trace Analysis, Software Trace Reading, Structural Trace Patterns, Trace Analysis Patterns | No Comments »
Sunday, May 1st, 2011
To model software behavior at application and system levels, test generative debugging scenarious and construct software defects using metaprogramming I started working on MdTL (Metadefect Template Library). Its consists of C++ templates for structural and behavioral patterns. The simplest examples include Threads<Spike> and Spike<Thread>. The template classes can be more complex, of course, utilizing the full power of C++, STL, and existing libraries like Boost. The unique and novel feature of this library is the inclusion of dual classes of behaviour such as Leak<>, Deadlock<>, Overflow<>, Residue<>, Exception<>, Contention<>, etc. parameterized by various structural memory classes like Process<>, Thread<>, Heap<>, Stack<>, Region<>, Buffer<>, etc. MdTL also includes classes to model software tracing and this will be used for simultaneous software trace and memory dump analysis case study in the forthcoming presentation. I also plan to extend this metaprogramming approach in the future to model malware analysis patterns by introducing Metamalware Template Library (MmTL).
Forthcoming parts will introduce template classes and examples.
- Dmitry Vostokov @ DumpAnalysis.org + TraceAnalysis.org -
Posted in C and C++, Crash Dump Patterns, Debugging, Generative Debugging, Malware Analysis, Malware Patterns, Metadefect Template Library, Metamalware, New Acronyms, Software Behavior Patterns, Software Defect Construction, Structural Memory Patterns, Structural Trace Patterns, Tools, Trace Analysis Patterns, Victimware | No Comments »
Thursday, April 28th, 2011
The New School of Debugging places pattern-driven memory and software trace analysis as a solid foundation for any debugging methodology, processes, tools and techniques. Unified Debugging Patterns and Generative Debugging Framework are additional features of the new school. To highlight its essentials I’ve created this draft diagram:

- Dmitry Vostokov @ DumpAnalysis.org + TraceAnalysis.org -
Posted in Crash Dump Patterns, Debugging, Generative Debugging, New Debugging School, Trace Analysis Patterns, Unified Debugging Patterns | No Comments »
Monday, April 25th, 2011
Here we continue with Technology-Specific Subtrace pattern series started earlier with COM interface invocation example. In this part we consider dynamic memory allocation example in kernel space (kernel pool). Usually pool corruption is detected during pool memory allocation or release with a special bugcheck code, for example:
BAD_POOL_HEADER (19)

The pool is already corrupt at the time of the current request.

This may or may not be due to the caller.

The internal pool links must be walked to figure out a possible cause of the problem, and then special pool applied to the suspect tags or the driver verifier to a suspect driver.

Arguments:

Arg1: 00000020, a pool block header size is corrupt.

Arg2: 8b79d078, The pool entry we were looking for within the page.

Arg3: 8b79d158, The next pool entry.

Arg4: 8a1c0004, (reserved)
However, pool corruption might be deeper enough to trigger an access violation even before self-diagnosis. In such cases stack subtraces with functions like ExFreePoolWithTag might point to troubleshooting and debugging directions:
ATTEMPTED_WRITE_TO_READONLY_MEMORY (be)

An attempt was made to write to readonly memory. The guilty driver is on the stack trace (and is typically the current instruction pointer).

When possible, the guilty driver’s name (Unicode string) is printed on the bugcheck screen and saved in KiBugCheckDriver.

Arguments:

Arg1: 00470044, Virtual address for the attempted write.

Arg2: 06d39025, PTE contents.

Arg3: aec0fb30, (reserved)

Arg4: 0000000a, (reserved)
TRAP_FRAME:  aec0fb30 -- (.trap 0xffffffffaec0fb30)

ErrCode = 00000003

eax=8ac12d38 ebx=8b700040 ecx=000001ff edx=00470040 esi=8ac12db8 edi=808b0b40

eip=808949e7 esp=aec0fba4 ebp=aec0fbf0 iopl=0 nv up ei pl nz na po nc

cs=0008  ss=0010  ds=0023  es=0023  fs=0030  gs=0000  efl=00010202

nt!ExFreePoolWithTag+0x6a3:

808949e7 895a04          mov     dword ptr [edx+4],ebx ds:0023:00470044=????????
STACK_TEXT:

aec0faa0 80860121 000000be 00470044 06d39025 nt!KeBugCheckEx+0x1b

aec0fb18 8088e490 00000001 00470044 00000000 nt!MmAccessFault+0xb25

aec0fb18 808949e7 00000001 00470044 00000000 nt!KiTrap0E+0xdc

aec0fbf0 808d93b5 8ac12dc0 00000000 00000000 nt!ExFreePoolWithTag+0×6a3

aec0fc08 808cd304 e5ae5770 8ac12dc0 8aa77db0 nt!CmpFreePostBlock+0×4d

aec0fc3c 8082ea53 8ac12dc0 aec0fc88 aec0fc7c nt!CmpPostApc+0xde

aec0fc8c 80833eec 00000000 00000000 00000000 nt!KiDeliverApc+0xf9

aec0fcc4 808290bd aec0fd64 8099781c 0160fd44 nt!KiSwapThread+0×300

aec0fd0c 809978a0 00000001 00000000 f77275e0 nt!KeDelayExecutionThread+0×2ab

aec0fd54 8088b45c 00000000 0160fd74 0160fd9c nt!NtDelayExecution+0×84

aec0fd54 7c82847c 00000000 0160fd74 0160fd9c nt!KiFastCallEntry+0xfc

WARNING: Frame IP not in any known module. Following frames may be wrong.

0160fd9c 00000000 00000000 00000000 00000000 0×7c82847c
1: kd> !pool 8ac12dc0

Pool page 8ac12dc0 region is Nonpaged pool

 8ac12000 size:  858 previous size:    0  (Allocated)  TWPG

 8ac12858 size:    8 previous size:  858  (Free)       ….

 8ac12860 size:   20 previous size:    8  (Allocated)  VadS

 8ac12880 size:    8 previous size:   20  (Free)       NtFs

 8ac12888 size:   20 previous size:    8  (Allocated)  VadS

 8ac128a8 size:   28 previous size:   20  (Allocated)  Ntfn

 8ac128d0 size:   30 previous size:   28  (Allocated)  Vad

 8ac12900 size:   40 previous size:   30  (Allocated)  Muta (Protected)

 8ac12940 size:   38 previous size:   40  (Allocated)  Sema (Protected)

 8ac12978 size:   40 previous size:   38  (Allocated)  Muta (Protected)

 8ac129b8 size:  270 previous size:   40  (Allocated)  Thre (Protected)

 8ac12c28 size:   40 previous size:  270  (Allocated)  Ntfr

 8ac12c68 size:   d0 previous size:   40  (Allocated)  DRIV

8ac12d38 is not a valid large pool allocation, checking large session pool…

8ac12d38 is freed (or corrupt) pool

Bad previous allocation size @8ac12d38, last size was 1a
***

*** An error (or corruption) in the pool was detected;

*** Attempting to diagnose the problem.

***

*** Use !poolval 8ac12000 for more details.

***
Pool page [ 8ac12000 ] is __inVALID.
Analyzing linked list...

[ 8ac12c68 --> 8ac12db8 (size = 0x150 bytes)]: Corrupt region

Scanning for single bit errors...
None found
- Dmitry Vostokov @ DumpAnalysis.org + TraceAnalysis.org -
Posted in Crash Dump Analysis, Crash Dump Patterns, Debugging, Software Trace Analysis, Software Trace Reading, Trace Analysis Patterns | No Comments »
Sunday, April 17th, 2011
I’m pleased to announce that MDAA, Volume 5 is available in PDF format:
www.dumpanalysis.org/Memory+Dump+Analysis+Anthology+Volume+5
It features:
- 25 new crash dump analysis patterns
- 11 new pattern interaction case studies (including software tracing)
- 16 new trace analysis patterns
- 7 structural memory patterns
- 4 modeling case studies for memory dump analysis patterns
- Discussion of 3 common analysis mistakes
- Malware analysis case study
- Computer independent architecture of crash analysis report service
- Expanded coverage of software narratology
- Metaphysical and theological implications of memory dump worldview
- More pictures of memory space and physicalist art
- Classification of memory visualization tools
- Memory visualization case studies
- Close reading of the stories of Sherlock Holmes: Dr. Watson’s observational patterns
- Fully cross-referenced with Volume 1, Volume 2, Volume 3, and Volume 4
Its table of contents is available here:
www.dumpanalysis.org/MDAA/MDA-Anthology-V5-TOC.pdf
Paperback and hardcover versions should be available in a week or two. I also started working on Volume 6 that should be available in November-December.
- Dmitry Vostokov @ DumpAnalysis.org + TraceAnalysis.org -
Posted in Aesthetics of Memory Dumps, Analysis Notation, Announcements, AntiPatterns, Archaeology of Computer Memory, Art, Assembly Language, Best Practices, Books, C and C++, CDF Analysis Tips and Tricks, Categorical Debugging, Citrix, Common Mistakes, Common Questions, Complete Memory Dump Analysis, Computer Forensics, Computer Science, Crash Analysis Report Environment (CARE), Crash Dump Analysis, Crash Dump De-analysis, Crash Dump Patterns, Crash Dumps for Dummies, Cyber Warfare, Debugging, Debugging Bureau, Debugging Industry, Debugging Methodology, Debugging Slang, Debugging Trends, Deep Down C++, Dr. Watson, Dublin School of Security, Education and Research, Escalation Engineering, Fun with Crash Dumps, Fun with Debugging, Fun with Software Traces, General Memory Analysis, Hermeneutics of Memory Dumps and Traces, Images of Computer Memory, Kernel Development, Malware Analysis, Mathematics of Debugging, Memiotics (Memory Semiotics), Memory Analysis Forensics and Intelligence, Memory Diagrams, Memory Dump Analysis Services, Memory Dumps in Myths, Memory Space Art, Memory Systems Language, Memory Visualization, Memory and Glitches, Metaphysics of Memory Worldview, Multithreading, Music for Debugging, New Acronyms, New Debugging School, New Words, Pattern Models, Philosophy, Physicalist Art, Publishing, Reverse Engineering, Science of Memory Dump Analysis, Science of Software Tracing, Security, Software Architecture, Software Behavior Patterns, Software Chorography, Software Chorology, Software Defect Construction, Software Engineering, Software Generalist, Software Maintenance Institute, Software Narratology, Software Technical Support, Software Trace Analysis, Software Trace Reading, Software Trace Visualization, Software Tracing for Dummies, Software Troubleshooting Patterns, Software Victimology, Structural Memory Patterns, Structural Trace Patterns, Systems Thinking, Testing, The Way of Philip Marlowe, Tools, Trace Analysis Patterns, Training and Seminars, Troubleshooting Methodology, Victimware, Vista, Webinars, WinDbg Scripting Extensions, WinDbg Scripts, WinDbg Tips and Tricks, WinDbg for GDB Users, Windows 7, Windows Server 2008, Windows System Administration, Workaround Patterns, x64 Windows | No Comments »
Tuesday, April 12th, 2011
I’m to present pattern-driven software trace analysis with examples from application and desktop delivery environments featuring Memory Dump Analysis Services at the forthcoming E2E Virtualization Conference (PubForum) in Dublin on 13th of May, 2011. Topics include a case study covering simultaneous analysis of software traces and memory dumps.

- Dmitry Vostokov @ DumpAnalysis.org + TraceAnalysis.org -
Posted in Announcements, CDF Analysis Tips and Tricks, Crash Dump Analysis, Crash Dump Patterns, Debugging, Presentations, Software Technical Support, Software Trace Analysis, Software Trace Reading, Tools, Trace Analysis Patterns | 1 Comment »
Monday, April 11th, 2011
Adjoint Thread invariants like PID can be reused giving rise to curious CDF (ETW) traces where two separate execution entities are glued together in one trace. For example, in one trace we see AppA and AppB sharing the same PID
#      Module  PID  TID   Time         Message

[…]

242583 ProcMon 5492 9476  11:04:33.398 LoadImageEvent for ImageName: …\AppA.exe PID: 5492

256222 ProcMon 5492 9476  11:04:50.036 ProcessDestroyEvent for PPID: 12168 PID: 5492

274887 ProcMon 5492 10288 11:05:18.235 LoadImageEvent for ImageName: …\AppB.exe PID: 5492

[…]
Other similar examples might include different instances of components sharing the same name, source code or even, in general, periodic tracing sessions appended to the end of the same trace file although we are thinking that the latter should be a separate pattern. We named this pattern Glued Activity by an analogy of different thread strings glued together (in general, manifiolds glued along their boundaries). Another name might be along the line of adjoint thread ID reuse (ATID Reuse).
- Dmitry Vostokov @ DumpAnalysis.org + TraceAnalysis.org -
Posted in CDF Analysis Tips and Tricks, Debugging, Software Trace Analysis, Trace Analysis Patterns | No Comments »
Saturday, March 26th, 2011
The presentation materials from the webinar (25th of March, 2011) are available for download:
http://www.dumpanalysis.com/PDSPSI-materials
Thanks to everyone who registered and attended!
- Dmitry Vostokov @ DumpAnalysis.org + TraceAnalysis.org -
Posted in Announcements, Crash Dump Analysis, Crash Dump Patterns, DebugWare Patterns, Debugging, Debugging Methodology, Escalation Engineering, Mac Crash Corner, Malware Analysis, Malware Patterns, Memory Analysis Forensics and Intelligence, Software Architecture, Software Behavior Patterns, Software Engineering, Software Technical Support, Software Trace Analysis, Software Tracing Implementation Patterns, Software Troubleshooting Patterns, Structural Memory Patterns, Structural Trace Patterns, Tools, Trace Analysis Patterns, Training and Seminars, Troubleshooting Methodology, Unified Debugging Patterns, Webinars, Workaround Patterns | No Comments »
Thursday, March 10th, 2011
Because the number of software trace patterns is growing I’m starting another checklist in addition to memory dump analysis checklist. The goal is to help experienced engineers not to miss any important information. The checklist doesn’t prescribe any specific steps, just lists all possible points to double check when looking at a software trace. Of course, it is not complete at the moment and any suggestions are welcome. This post will be modified on the ongoing basis.
General:
• Check overall trace time delta
• Check no trace metafile message density
• Check whether a trace is a multi-part or a circular
• Check for basic facts and the story (software narrative)
• Check for any exceptions, non-false positive errors and periodic errors
• Check for significant events
• Check for discontinuities in the time domain
• Check for message current and acceleration in the frequency domain
- Dmitry Vostokov @ DumpAnalysis.org + TraceAnalysis.org -
Posted in CDF Analysis Tips and Tricks, Debugging, Debugging Methodology, Escalation Engineering, Software Technical Support, Software Trace Analysis, Software Trace Reading, Trace Analysis Patterns, Troubleshooting Methodology | No Comments »
Monday, March 7th, 2011

The first Webinar to start an in-depth discussion of pattern-driven software troubleshooting, debugging and maintenance:
Date: 25th of March 2011
Time: 18:30 (GMT) 14:30 (EST) 11:30 (PST)
Duration: 60 minutes
Space is limited.
Reserve your Webinar seat now at:
https://www3.gotomeeting.com/register/448268158
Topics include:
- A Short History of DumpAnalysis.org
- Memory Dump Analysis Patterns
- Troubleshooting and Debugging Tools (Debugware) Patterns
- Software Trace Analysis Patterns
- From Software Defects to Software Behavior
- Workaround Patterns
- Structural Memory Patterns
- Memory Analysis Domain Pattern Hierarchy
- New Directions
Prerequisites: experience in software troubleshooting and/or debugging.
- Dmitry Vostokov @ DumpAnalysis.org + TraceAnalysis.org -
Posted in .NET Debugging, Analysis Notation, Announcements, AntiPatterns, Best Practices, CDA Pattern Classification, Crash Dump Analysis, Crash Dump Patterns, DebugWare Patterns, Debugging, Debugging Methodology, Debugging Trends, Escalation Engineering, Java Debugging, Linux Crash Corner, Mac Crash Corner, Malware Analysis, Malware Patterns, Memory Analysis Forensics and Intelligence, Memory Dump Analysis Services, Pattern Models, Pattern Prediction, Presentations, Software Behavior Patterns, Software Chorology, Software Engineering, Software Narratology, Software Technical Support, Software Trace Analysis, Software Trace Reading, Software Tracing Implementation Patterns, Software Troubleshooting Patterns, Structural Memory Patterns, Structural Trace Patterns, Systems Thinking, Testing, Trace Analysis Patterns, Training and Seminars, Troubleshooting Methodology, Unified Debugging Patterns, Webinars, Workaround Patterns | No Comments »
Sunday, February 20th, 2011
Sometimes, we look at a trace and say it’s Impossible Trace. For example, this fragment shows that the function foo had been called:
#     Module  PID  TID  Message

[...]

1001  ModuleA 202  404  foo: start

1002  ModuleA 202  404  foo: end

[...]
However, if we look at the corresponding source code (PLOT) we would see that something is missing: the function bar must have been called with its own set of trace messages we don’t see in the trace:
void foo()

{

    TRACE("foo: start");

    bar();

    TRACE("foo: end");

}
void bar()

{

    TRACE("bar: start");

    // some code ...

    TRACE("bar: end");

}
We suspect the runtime code being modified, perhaps by patching. In other cases of missing messages we can also suspect thrown exceptions or local buffer overflows that led to wrong return address skipping the code with expected tracing statements. The mismatch between the trace and the source code we are looking at is also possible if the old source code didn’t have bar function called.
Note: I’m grateful for this pattern idea to Gary Barton.
- Dmitry Vostokov @ DumpAnalysis.org + TraceAnalysis.org -
Posted in Code Reading, Debugging, Software Trace Analysis, Software Trace Reading, Trace Analysis Patterns | No Comments »
Tuesday, February 8th, 2011
This pattern has a funny name Gossip. I thought originally to call it Duplicated Message but gave it the new name allowing for the possibility of semantics of the same message to be distorted in subsequent trace messages from different adjoint threads. Typical ETW / CDF trace example (distortion free) of the same message content seen in different modules (some columns like Date and Time are omitted):
#     Module  PID  TID  Message[...]26875 ModuleA

2172 5284 LoadImageEvent: ImageName(\Device\HarddiskVolume2\Windows\System32\notepad.exe) ProcessId(0x000000000000087C)26876 ModuleB

2172 5284 LoadImageEvent: ImageName(\Device\HarddiskVolume2\Windows\System32\notepad.exe), ProcessId(2172)26877 ModuleC

2172 5284 ImageLoad: fileName=notepad.exe, pid: 000000000000087C[...]
In such cases, when constructing event sequence order it is recommended to choose messages from the one source instead of mixing events from different sources, for example:
#     Module  PID  TID  Message[...]26875 ModuleA

2172 5284 LoadImageEvent: ImageName(\Device\HarddiskVolume2\Windows\System32\notepad.exe) ProcessId(0×000000000000087C)[…]33132 ModuleA

4180 2130 LoadImageEvent: ImageName(\Device\HarddiskVolume2\Windows\System32\calc.exe) ProcessId(0×0000000000001054)[…]
- Dmitry Vostokov @ DumpAnalysis.org + TraceAnalysis.org -
Posted in CDF Analysis Tips and Tricks, Debugging, Software Trace Analysis, Software Trace Reading, Trace Analysis Patterns | No Comments »
