Archive for the ‘Trace Analysis Patterns’ Category
Wednesday, October 20th, 2010
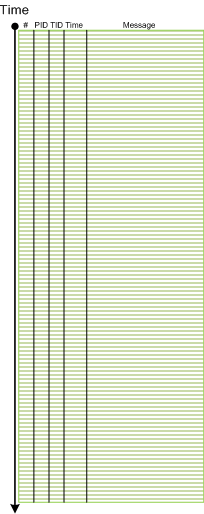
The next pattern with the name borrowed from historiography is Layered Periodization. This periodization of software trace messages includes individual messages, then aggregated messages from threads, then processes as wholes and finally individual computers (in client-server or similar sense). This is best illustrated graphically.
Message layer:
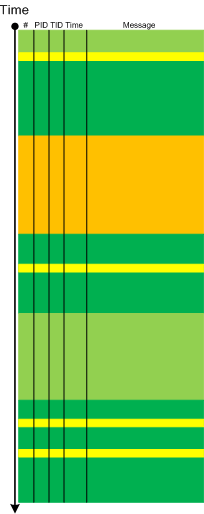
Thread layer (different colors correspond to different TID):
Process layer (different colors correspond to different PID):
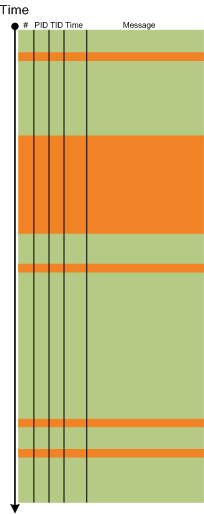
Please note that it is also possible to have a periodization based on modules, functions and individual messages but it might be complicated because different threads can enter the same module or function and here other patterns more appropriate like Activity Region, Characteristic Message Block, and Background and Foreground Components.
- Dmitry Vostokov @ DumpAnalysis.org + TraceAnalysis.org -
Posted in CDF Analysis Tips and Tricks, Debugging, Software Trace Analysis, Software Trace Analysis and History, Software Trace Reading, Trace Analysis Patterns | No Comments »
Wednesday, October 13th, 2010
Sometimes, when we find an Anchor Message related to our problem description (for example, a COM port error) we are interested in its evolution throughout a software narrative:
#       PID     TID     Message

[...]

126303  5768    1272    OpenComPort returns Status = 0x0

[...]

231610  3464    1576    OpenComPort returns Status = 0x0

[...]

336535  5768    4292    OpenComPort returns Status = 0×0

[…]

423508  5252    2544    OpenComPort returns Status = 0xc000000f

[…]

531247  5768    5492    OpenComPort returns Status = 0xc000000f

[…]

639039  772     3404    OpenComPort returns Status = 0xc000000f

[…]
Then we can check activity between changes. We call this pattern Message Change.
- Dmitry Vostokov @ DumpAnalysis.org + TraceAnalysis.org -
Posted in CDF Analysis Tips and Tricks, Debugging, Software Trace Analysis, Trace Analysis Patterns | No Comments »
Thursday, October 7th, 2010
It is time now to introduce a syntactical notation for memory (dump) and software trace analysis pattern languages (in addition to graphical notation proposed earlier). It should be simple and concise: allow easy grammar with plain syntax and obvious reading semantics. We propose to use capitalized letters for major pattern categories, for example, W for wait chains and D for deadlocks. Then use subscripts (or small letters) for pattern subcategories, for example, Wcs and Dlpc. Several categories and subcategories can be combined by using slash (/), for example, Wcs/Dcs/lpc. Slash notation is better viewed using subscripts:
Wcs/Dcs/lpc
Next part will introduce more categories and propose notational adornments for pattern succession, space differentiation and the inclusion of details in notational sentences.
- Dmitry Vostokov @ DumpAnalysis.org + TraceAnalysis.org -
Posted in Analysis Notation, Crash Dump Analysis, Crash Dump Patterns, Debugging, Science of Memory Dump Analysis, Science of Software Tracing, Software Behavior Patterns, Software Trace Analysis, Structural Memory Patterns, Trace Analysis Patterns | No Comments »
Tuesday, October 5th, 2010
The choice of webinars below mostly reflects my personal preferences and long time desire to speak on topics like systems thinking, troubleshooting tool design and development. The other topic about BSOD minidump analysis was requested by participants in an ongoing survey. There will be more topics in 2011. All forthcoming webinars will be hosted by Memory Dump Analysis Services. The planning list includes:
Systems Thinking in Memory Dump and Software Trace Analysis
Software Troubleshooting and Debugging Tools: Objects, Components, Patterns and Frameworks with UML
- UML basics
- DebugWare patterns
- Unified Troubleshooting Framework
- RADII software development process
- Hands-on exercise: designing and building a tool
Blue Screen Of Death Analysis Done Right: Minidump Investigation for System Administrators
- Making sense of !analyze –v output
- Get extra troubleshooting information with additional WinDbg commands
- Guessing culprits with raw stack analysis
- Who’s responsible: hardware or software?
- Checklist and patterns
- Including hands-on exercises: send your own minidumps
More detailed information will be available soon.
- Dmitry Vostokov @ DumpAnalysis.org + TraceAnalysis.org -
Posted in Announcements, CDF Analysis Tips and Tricks, Common Mistakes, Common Questions, Crash Analysis Report Environment (CARE), Crash Dump Analysis, Crash Dump De-analysis, Crash Dump Patterns, Crash Dumps for Dummies, DebugWare Patterns, Debugging, Debugging Industry, Debugging Methodology, Escalation Engineering, General Memory Analysis, Hermeneutics of Memory Dumps and Traces, Memory Systems Language, Minidump Analysis, Software Architecture, Software Behavior Patterns, Software Engineering, Software Technical Support, Software Trace Analysis, Software Tracing for Dummies, Structural Memory Patterns, Systems Thinking, Tools, Trace Analysis Patterns, Training and Seminars, Troubleshooting Methodology, Vista, Webinars, WinDbg Tips and Tricks, Windows 7, Windows Server 2008, Windows System Administration, x64 Windows | No Comments »
Thursday, September 30th, 2010
Another tool that supports adjoint threading in addition to Citrix CDFAnalyzer (see also Debugging Experts magazine article for pictorial description of this concept) is Process Monitor. We can view adjoint threads having common attributes like TID (ordinary threads), PID, operation (function), process name, etc. by using this right click context menu:
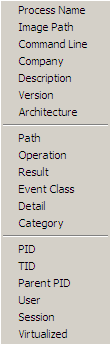
For example, this adjoint thread having RegOpenKey as its ATID (Adjoint Thread ID) where we excluded Path, Result and Detail fields for viewing clarity (together these fields can constitute an analogous Message field in TMF traces):
Time of Day      Process Name PID  TID  Operation

[…]

09:33:25.9545410 Explorer.EXE 1292 1032 RegOpenKey

09:33:25.9548650 Explorer.EXE 1292 1032 RegOpenKey

09:33:25.9550234 Explorer.EXE 1292 1032 RegOpenKey

09:33:25.9551656 Explorer.EXE 1292 1032 RegOpenKey

09:33:25.9692456 WFICA32.EXE  3588 3496 RegOpenKey

09:33:25.9761325 wfcrun32.exe 852  1148 RegOpenKey

09:33:25.9761912 wfcrun32.exe 852  1148 RegOpenKey

09:33:25.9762295 wfcrun32.exe 852  1148 RegOpenKey

09:33:25.9984547 wfcrun32.exe 852  1148 RegOpenKey

09:33:26.0023831 wfcrun32.exe 852  1148 RegOpenKey

09:33:26.0074675 wfcrun32.exe 852  1148 RegOpenKey

09:33:26.0087191 Explorer.EXE 1292 1032 RegOpenKey

09:33:26.1618595 iexplore.exe 1348 2228 RegOpenKey

09:33:26.1625697 iexplore.exe 1348 2228 RegOpenKey

09:33:26.1632745 iexplore.exe 1348 2228 RegOpenKey

09:33:26.1633924 iexplore.exe 1348 2228 RegOpenKey

09:33:26.1639209 iexplore.exe 1348 2228 RegOpenKey

[…]
So if someone writes a converter from TMF to PML format…
- Dmitry Vostokov @ DumpAnalysis.org + TraceAnalysis.org -
Posted in Debugging, Multithreading, New Acronyms, Software Trace Analysis, Software Trace Reading, Tools, Trace Analysis Patterns | No Comments »
Monday, September 27th, 2010
General Memory Analysis is another name for Memoretics, a discipline that studies memory snapshots including their similarities and differences on different system platforms such as Windows, Linus, Mac OS X, embedded and mobile systems, historical architectures, etc. The analysis of memory helps solve problems in various domains such as software troubleshooting and debugging, computer forensic analysis, etc.
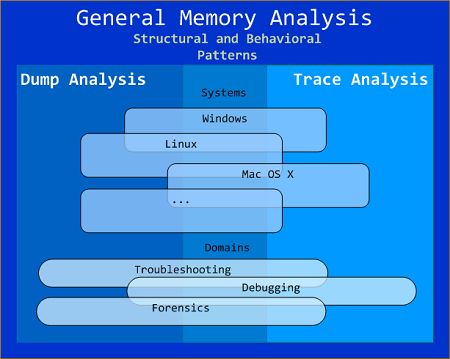
The current focus of interdisciplinary research is to build a unified memory pattern language that covers both behavioral and structural patterns and also to study the possibility of building memory systems from below, not from requirements -> architecture -> design -> implementation -> compilation -> linking -> loading -> execution but from directly modeling and assembling memory systems using memory patterns.
- Dmitry Vostokov @ DumpAnalysis.org + TraceAnalysis.org -
Posted in Announcements, Crash Dump Analysis, Debugging, General Memory Analysis, Memiotics (Memory Semiotics), Memoretics, Memory Analysis Forensics and Intelligence, Memory Systems Language, Security, Software Behavior Patterns, Software Technical Support, Software Trace Analysis, Structural Memory Patterns, Trace Analysis Patterns | No Comments »
Monday, September 20th, 2010
Sometimes, when comparing normal, expected (working) and abnormal (non-working) traces we can get a clue for further troubleshooting and debugging by looking at module load events. For example, when we see an unexpected module loaded in our non-working trace, its function (and sometimes even module name) can signify some difference to pay attention to:
#     PID  TID  Time         Message

[...]

14492 6908 6912 11:06:41.953 LoadImageEvent: ImageName(\WINDOWS\system32\3rdPartySso.dll)

[...]
I call this pattern Guest Component and it is a different from Missing Component. Although in the latter pattern a missing component in one trace may appear in another but the component name is known apriori and expected. In the former pattern the component is unexpected. For example, in the trace above, its partial name fragment “Sso” may trigger a suggestion to relate differences in authentication where in a non-working case SSO (single sign-on) was configured.
- Dmitry Vostokov @ DumpAnalysis.org + TraceAnalysis.org -
Posted in CDF Analysis Tips and Tricks, Debugging, Software Trace Analysis, Trace Analysis Patterns | No Comments »
Sunday, September 19th, 2010
Finally, after the delay, the issue is available in print on Amazon and through other sellers:
Debugged! MZ/PE: Multithreading

- Dmitry Vostokov @ DumpAnalysis.org + TraceAnalysis.org -
Posted in .NET Debugging, Announcements, CDF Analysis Tips and Tricks, Citrix, Computer Science, Debugged! MZ/PE, Debugging, Memory Dump Analysis Services, Multithreading, Publishing, Science of Software Tracing, Software Trace Analysis, Software Trace Visualization, Tools, Trace Analysis Patterns, WinDbg Tips and Tricks | No Comments »
Monday, September 13th, 2010
Often we see errors in software traces recorded during deviant software behavior (often called non-working software traces) and when we double check their presence in normal expected software behavior traces (often called working traces) we find them there too. This pattern is called False Positive Error. I already mentioned similar false positives when I introduced the first software trace analysis pattern called Periodic Error. Here is an example from the real trace. In a non-working trace we found this error in an adjoint thread of a foreground component:
OpenProcess error 5
However, we found the same error in the working trace so we continued looking and found several other errors:
Message request report: last error 1168, …

[…]

GetMsg result -2146435043
The last one if converted to a hex status is 8010001D but, unfortunately, the same errors were present in the working trace too in the same activity regions.
After that we started comparing both traces looking for a bifurcation point and we found the error that was only present in a non-working trace with a significant trace differences after that:
Error reading from the named pipe: 800700E9
My favourite tool (WinDbg) to convert error and status values gave this description:
0:000> !error 800700E9

Error code: (HRESULT) 0x800700e9 (2147942633) - No process is on the other end of the pipe.
- Dmitry Vostokov @ DumpAnalysis.org + TraceAnalysis.org -
Posted in CDF Analysis Tips and Tricks, Debugging, Software Trace Analysis, Software Trace Reading, Trace Analysis Patterns, WinDbg Tips and Tricks | No Comments »
Friday, August 27th, 2010
Like in a literature (and in a narratology in general) we have components that trace themselves and components that tell the story of a computation including status updates they query about other components and subsystems. This pattern gets its name Diegetic Messages from diegesis. Here’s the difference between diegetic (in blue bold) and non-diegetic trace messages:
PID    TID    TIME          MESSAGE

11864  11912  06:34:53.598  ModuleA: foo called bar. Status OK.

11620  10372  06:34:59.754  ModuleB: ModuleA integrity check. Status OK.
Some modules may emit messages that tell about their status but from their message text we know the larger computation story like in a process startup sequence example.
- Dmitry Vostokov @ DumpAnalysis.org + TraceAnalysis.org -
Posted in CDF Analysis Tips and Tricks, Debugging, Software Narratology, Software Trace Analysis, Software Trace Reading, Trace Analysis Patterns | 1 Comment »
Tuesday, August 10th, 2010
Sometimes a software trace is truncated when the trace session was stopped prematurely, often when a problem didn’t manifest itself visually. We can diagnose such traces by their short time duration, missing anchor messages or components necessary for analysis. My favourite example is user session initialization in a Citrix terminal services environment when problem effects are visible only after the session is fully initialized and an application is launched but a truncated CDF trace only shows the launch of winlogon.exe despite the presence of a process creation trace provider or other components that record the process launch sequence and the trace itself lasts only a few seconds after that.
- Dmitry Vostokov @ DumpAnalysis.org + TraceAnalysis.org -
Posted in CDF Analysis Tips and Tricks, Debugging, Software Narratology, Software Trace Analysis, Software Trace Reading, Trace Analysis Patterns | 1 Comment »
Wednesday, June 16th, 2010
Adding AI. Analysis Improvement.
After reading earlier today Windows Internals pages about system audit an idea came to my mind in the evening to provide audit services for memory dump and software trace analysis. One mind is good but two are better, especially if the second is a pattern-driven AI. Here are possible problem scenarios:
Problem: You are not satisfied with a crash report.
Problem: Your critical issue is escalated to the VP level. Engineers analyze memory dumps and software traces. No definite conclusion so far. You want to be sure that nothing has been omitted from the analysis.
Problem: You analyze a system dump or a software trace. You need a second pair of eyes but don’t want to send your memory dump due to your company security policies.
Other scenarios (use cases) will be added as soon as I see the service fit to the realities of software technical support.
I plan to make this service operational in July - August, 2010. Prices to be announced soon.
- Dmitry Vostokov @ DumpAnalysis.org + TraceAnalysis.org -
Posted in .NET Debugging, Announcements, Common Mistakes, Complete Memory Dump Analysis, Crash Analysis Report Environment (CARE), Crash Dump Analysis, Crash Dump De-analysis, Crash Dump Patterns, Debugging, Escalation Engineering, Minidump Analysis, Software Behavior Patterns, Software Engineering, Software Technical Support, Software Trace Analysis, Software Troubleshooting Patterns, Tools, Trace Analysis Patterns | 1 Comment »
Tuesday, June 8th, 2010
Here we introduce a software narratological partitioning of a trace into Head, Prologue, Core, Epilogue and Tail segments. This is useful for comparative software trace analysis. Suppose, a trace started just before the reproduction steps or a start marker was injected (by CDFMarker, for example) and finished just after the last repro steps or after an end marker was injected. Then its core trace messages are surrounded by prologue and epilogue statements. What is before and after are not necessary for analysis and usually distract an analyst. They are shown as grey areas on the following picture where the left trace is for working (non-working) scenario and the right trace is for non-working (working) scenario:
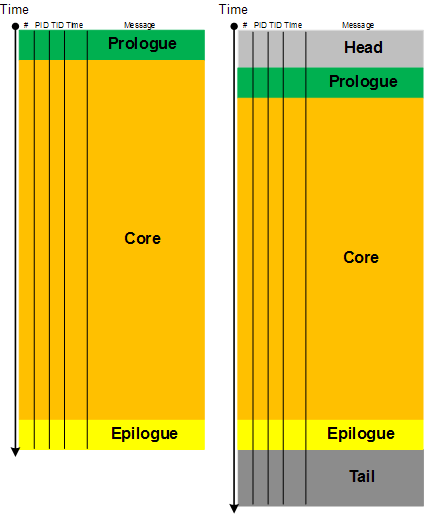
The size of a core segment need not be the same because environments and executed code paths might be different. However, often some traces are truncated (another pattern). Also sometimes it is difficult to establish whether the first trace is normal and the second has a tail or the first one is truncated and the second one is normal with an optional tail. Here artificial markers are important.
- Dmitry Vostokov @ DumpAnalysis.org + TraceAnalysis.org -
Posted in Software Narratology, Software Trace Analysis, Software Trace Reading, Software Trace Visualization, Trace Analysis Patterns | No Comments »
Wednesday, June 2nd, 2010
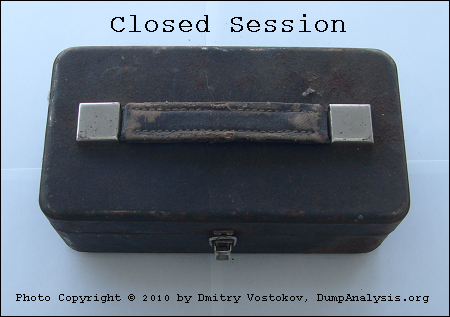
This paleodebugging tool was excavated from Central Russia (thanks to Mr. Kutuzov) and generously provided for a photo session by its owner Mr. Mansour:
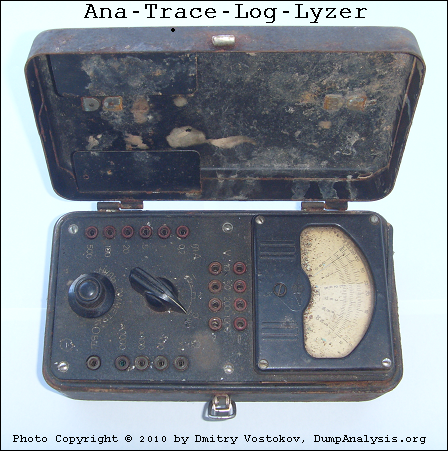
It also inspired this sequence of strcat: Analog -> Anatrace -> Analyzer -> Tracelyzer -> Loglyzer.
… enough tracing. It’s time to close our session:
… what is left? If you are curious, look at this conceptual picture:
Component Trace
If you wonder what electricity has to do with tracing (at a metaphorical level) look at this trace analysis pattern:
Statement Density and Current
- Dmitry Vostokov @ DumpAnalysis.org + TraceAnalysis.org -
Posted in Archaeology of Computer Memory, Art, Debugging, Fun with Software Traces, History, New Words, Paleo-debugging, Physicalist Art, Software Trace Analysis, Testing, Tools, Trace Analysis Patterns | No Comments »
Wednesday, June 2nd, 2010
The limit of Discontinuity pattern is No Activity. The absence of activity can be seen at a thread level or at a process level where it is similar to Missing Component pattern. The difference from the latter pattern is that we know for certain that we selected our process modules for tracing but don’t see any trace messages. Consider this example:
#  Source        PID  TID  Time         Function     Message

1  TraceSettings 1480 8692 08:04:20.682              **** Start Trace Session

[... TraceSettings messages 2-11 show that we selected AppA for tracing ...]

12 ModuleB       3124 4816 08:04:37.049 WorkerThread Worker thread running

13 TraceSettings 1480 8692 08:04:41.966              **** Trace Session was stopped
Only modules from AppA process and modules from a coupled process (for example, ModuleB) were selected. However, we only see a reminder message from the coupled process (3124.4816:ModuleB!WorkerThread) and no messages for 21 seconds. Fortunately, AppA process memory dump was saved during the tracing session:
Debug session time: Fri May 21 08:04:31.000 2010 (GMT+0)
We see 2 threads waiting for a critical section:
0:000> ~*kL
  14  Id: 640.8b8 Suspend: 1 Teb: 7ffa7000 Unfrozen

ChildEBP RetAddr

0248f8c0 7c827d29 ntdll!KiFastSystemCallRet

0248f8c4 7c83d266 ntdll!ZwWaitForSingleObject+0xc

0248f900 7c83d2b1 ntdll!RtlpWaitOnCriticalSection+0x1a3

0248f920 0040dea8 ntdll!RtlEnterCriticalSection+0xa8

[…]

0248f9a4 77ce78aa rpcrt4!Invoke+0×30

0248f9c0 77ce7a94 rpcrt4!NdrCallServerManager+0×17

0248fcb8 77ce7b7c rpcrt4!NdrStubCall+0×1d6

0248fcd0 77c7ff7a rpcrt4!NdrServerCall+0×15

0248fd04 77c8042d rpcrt4!DispatchToStubInCNoAvrf+0×38

0248fd58 77c80353 rpcrt4!RPC_INTERFACE::DispatchToStubWorker+0×11f

0248fd7c 77c7e0d4 rpcrt4!RPC_INTERFACE::DispatchToStub+0xa3

0248fdbc 77c7e080 rpcrt4!RPC_INTERFACE::DispatchToStubWithObject+0xc0

0248fdfc 77c812f0 rpcrt4!LRPC_SCALL::DealWithRequestMessage+0×41e

0248fe20 77c88678 rpcrt4!LRPC_ADDRESS::DealWithLRPCRequest+0×127

0248ff84 77c88792 rpcrt4!LRPC_ADDRESS::ReceiveLotsaCalls+0×430

0248ff8c 77c8872d rpcrt4!RecvLotsaCallsWrapper+0xd

0248ffac 77c7b110 rpcrt4!BaseCachedThreadRoutine+0×9d
  15  Id: 640.18c0 Suspend: 1 Teb: 7ffdb000 Unfrozen

ChildEBP RetAddr

01b8ff40 7c827d29 ntdll!KiFastSystemCallRet

01b8ff44 7c83d266 ntdll!ZwWaitForSingleObject+0xc

01b8ff80 7c83d2b1 ntdll!RtlpWaitOnCriticalSection+0x1a3

01b8ffa0 0040dba7 ntdll!RtlEnterCriticalSection+0xa8

[…]

01b8ffec 00000000 kernel32!BaseThreadStart+0×34
Unfortunately it belongs to a missing thread and blocked threads wait forever:
0:000> !cs -l -o -s

-----------------------------------------

DebugInfo          = 0x01facdd0

Critical section   = 0x01da19c0 (+0x1DA19C0)

LOCKED

LockCount          = 0×2

WaiterWoken        = No

OwningThread       = 0×00001384

RecursionCount     = 0×1

LockSemaphore      = 0×578

SpinCount          = 0×00000000

ntdll!RtlpStackTraceDataBase is NULL. Probably the stack traces are not enabled
0:000> ~~[1384]

              ^ Illegal thread error in ‘~~[1384]’
Apparently AppA process was hanging and it explains why we don’t see any activity in the trace. We suggested to enable user mode stack trace database using this article as an example: CTX106970 and get a new dump.
- Dmitry Vostokov @ DumpAnalysis.org + TraceAnalysis.org -
Posted in Crash Dump Analysis, Debugging, Software Trace Analysis, Trace Analysis Patterns | 1 Comment »
Sunday, May 30th, 2010
Finally, after careful consideration, I’ve come up with the topic that has been neglected so far but at the same time important for both camps (kernel space and user space, including managed space): complete memory dump and software trace analysis. I plan to publish the first webinar agenda early in July and deliver the webinar in August (the date should be finalized by mid July).
PS. Sailing memory spaces under an RGB flag 

- Dmitry Vostokov @ DumpAnalysis.org + TraceAnalysis.org -
Posted in Announcements, CDF Analysis Tips and Tricks, Crash Analysis Report Environment (CARE), Crash Dump Analysis, Crash Dump Patterns, Debugging, DumpAnalysis and TraceAnalysis Logos, Escalation Engineering, Software Behavior Patterns, Software Technical Support, Software Trace Analysis, Software Troubleshooting Patterns, Tools, Trace Analysis Patterns, Training and Seminars, WinDbg Scripts, WinDbg Tips and Tricks | 2 Comments »
Tuesday, May 25th, 2010
Finally Citrix has published a tool (written by my colleague Colm Naish, lead escalation engineer) that allows controlled injection of events into CDF (ETW) trace message stream. This is useful in many troubleshooting scenarios where we need to rely on Significant Event and Anchor Message analysis patterns to partition traces into artificial Activity Regions to start our analysis with. This is also analogous for the imposition of the external time on the stream of tracing events from software narratology perspective:
CDFMarker On Demand - For XenApp and XenDesktop
- Dmitry Vostokov @ DumpAnalysis.org + TraceAnalysis.org -
Posted in Announcements, CDF Analysis Tips and Tricks, Citrix, Debugging, Escalation Engineering, Software Engineering, Software Narratology, Software Technical Support, Software Trace Analysis, Software Trace Reading, Tools, Trace Analysis Patterns | 1 Comment »
Friday, May 21st, 2010
When we have a software trace we read it in two directions. The first one is to deconstruct it into a linear ordered source code based on PLOT fragments. The second direction is to construct an interpretation that serve as an explanation for reported software behaviour. During the interpretive reading we remove irrelevant information, compress relevant activity regions and construct the new fictional software trace based on discovered patterns and our problem description.
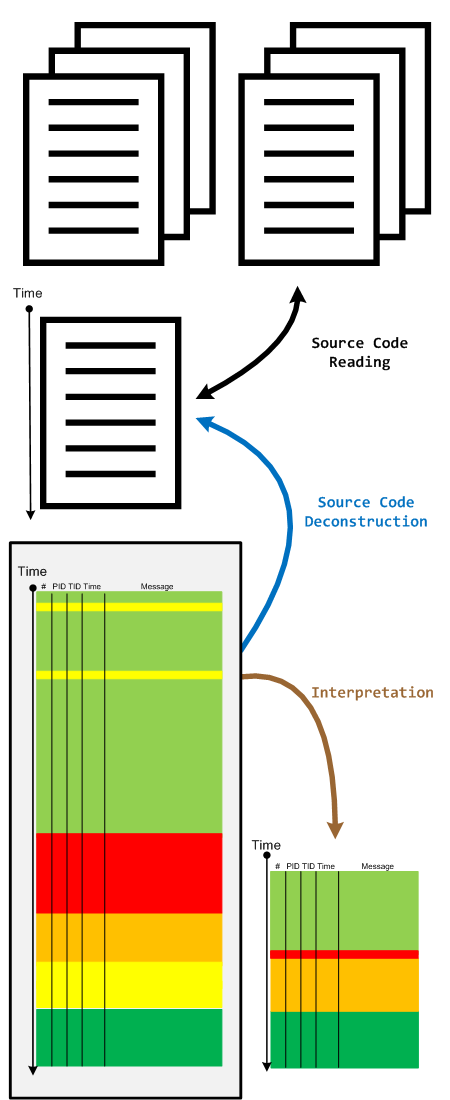
- Dmitry Vostokov @ DumpAnalysis.org + TraceAnalysis.org -
Posted in Code Reading, Debugging, Science of Software Tracing, Software Narratology, Software Technical Support, Software Trace Analysis, Software Trace Reading, Trace Analysis Patterns | No Comments »
Monday, May 10th, 2010
This pattern is similar to No Component Symbols memory analysis pattern and is called No Trace Metafile:
#     Module    PID  TID  Time        Message

21372 \src\dllA 2968 5476 3:55:10.004 Calling foo()

21373 Unknown   2968 5476 3:55:10.004 ????? Unknown( 27): GUID=1EF56EBD-A7FC-4892-8DBA-00AD813F8A24 (No Format Information found).

21374 Unknown   2968 5476 3:55:10.004 ????? Unknown( 27): GUID=1EF56EBD-A7FC-4892-8DBA-00AD813F8A24 (No Format Information found).

21375 Unknown   2968 5476 3:55:10.004 ????? Unknown( 27): GUID=1EF56EBD-A7FC-4892-8DBA-00AD813F8A24 (No Format Information found).

21376 Unknown   2968 5476 3:55:10.004 ????? Unknown( 28): GUID=1EF56EBD-A7FC-4892-8DBA-00AD813F8A24 (No Format Information found).

21377 Unknown   2968 5476 3:55:10.004 ????? Unknown( 23): GUID=1EF56EBD-A7FC-4892-8DBA-00AD813F8A24 (No Format Information found).

21378 \src\dllA 2968 5476 3:55:10.004 Calling bar()
In some case when we don’t have TMF files it is possible to detect broad behavioral patterns such as:
By looking at Thread of Activity we can also sometimes infer the possible component name based on surrounding trace messages with present TMF files, escpecially when we have source code access. For example, in the trace above it can be dllA or any other module that foo function calls.
- Dmitry Vostokov @ DumpAnalysis.org + TraceAnalysis.org -
Posted in CDF Analysis Tips and Tricks, Debugging, Software Trace Analysis, Trace Analysis Patterns | No Comments »
Monday, May 10th, 2010
My drive to generalization led me to place an adornment on the portal to highlight the fact that memory and software trace analysis patterns are under an umbrella of general software behaviour patterns:
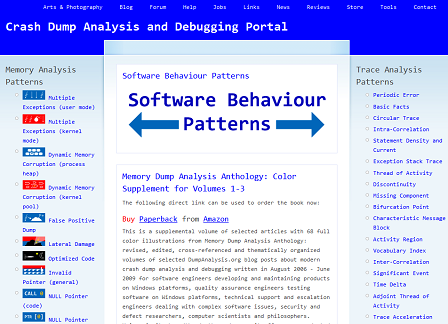
http://www.dumpanalysis.org/Software-Behavior-Patterns-Headline
In the forthcoming post series I plan to write about similarities between these two branches and also provide pattern examples from non-Windows platforms. All this material will provide the foundation for the forthcoming book Software Behavior: A Guide to Systematic Analysis (ISBN: 978-1906717162).
- Dmitry Vostokov @ DumpAnalysis.org + TraceAnalysis.org -
Posted in Announcements, Computer Science, Crash Dump Analysis, Crash Dump Patterns, Debugging, Escalation Engineering, Memiotics (Memory Semiotics), Memoretics, Science of Memory Dump Analysis, Science of Software Tracing, Software Behavior Patterns, Software Engineering, Software Maintenance Institute, Software Technical Support, Software Trace Analysis, Software Troubleshooting Patterns, Trace Analysis Patterns | No Comments »