Trace Analysis Patterns (Part 14)

Forthcoming Webinar on Pattern-Driven Software Diagnostics

2012 - The Year of Software Trace Analysis

Accelerated Memory Dump Analysis Training

Sponsored link: Memory Dump Analysis Services

Debugging Experts Magazine Online

Debugging Today Daily Newspaper

Debugging TV

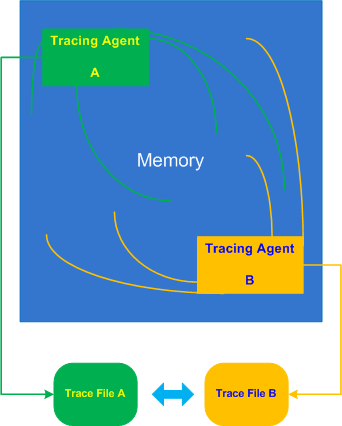
Inter-Correlation pattern is analogous to the previously described Intra-Correlation pattern but involves several traces from possibly different trace agents recorded (most commonly) at the same time or during an overlapping time interval:


Let’s look at a typical example of an application subclassing windows to add additional look and feel element to its GUI or thjat hooks into window messaging. Suppose this application also records important trace points like window parameters before and after subclassing using ETW technology (Event Tracing for Windows). When we run the application in terminal services envirinment all windows (including other processes) are shown with an incorrect dimension. We therefore request the application trace and in addition WindowHistory trace to see how corrdinates of all windows are changed over time. We easily find some Basic Facts in both traces such as window class name or time but it looks like window handle is different. In another set of traces recorded for comparison we have same window handle values, class name is absent from the ETW trace but a process and thread ID for the same window handle are different. We, therefore, don’t see a correlation between these traces and suspect that both traces in 2 sets were recorded in different terminal sessions, for example:

ETW trace:

#      PID   TID   Time          Message
[…] 
46750  5890  6960  10:17:18.825  Subclassing, handle=0×100B8, class=MyWindowClass, […]
[…]

WindowHistory trace:

Handle: 0001006E Class: “MyWindowClass” Title: “”
   Captured at: 10:17:19:637
   Process ID: 19e0
   Thread ID: 16e4

   Parent: 0
   Screen position (l,t,r,b): (-2,896,1282,1026)
   Client rectangle (l,t,r,b): (0,0,1276,122)
   Visible: true
   Window placement command: SW_SHOWNORMAL
   Foreground: false
   HungApp: false
   Minimized: false
   Maximized: false
[…]

- Dmitry Vostokov @ TraceAnalysis.org -

Sponsored link: Professional Software Debugging Services

/* Malware and Software Defects -> Victimware.org */

Copyright © 2006 - 2012. This is a non-profit research and scientific project.


Citrix and Microsoft Customer Forum

Museum of Debugging and Memory Dumps

7/7/2011 - 8/8/2011 Annual Competition: Tell Your Windows Debugging Story

Crash and Hang Analysis Audit Service

CARE: Crash Analysis Report Environment

Crash Dump and Software Trace Analysis Training and Seminars

Access OpenTask Titles on Safari Books Online

DATA (Dump Analysis + Trace Analysis) Facebook group
Please join the community of memory (dump) and trace analysis engineers. This group promotes scientific methods and memory dump-based worldview.

Twitter @ DumpAnalysis
You can now follow portal and blog news at DumpAnalysis on Twitter

LinkedIn Group Dr. Watson Enthusiasts
All about Dr. Watson errors and more. Get news, excerpts and progress reports about the forthcoming book The Science of Dr. Watson: An Illustrated History of Debugging (ISBN 978-1906717070)

2010 (0x7DA) - The Year of Dump Analysis
2011 (0x7DB) - 2020 (0x7E4) The Debugging Decade

International Memory Analysts and Debuggers Day:
07.07 and/or 08.08 starting from The Year of Dump Analysis, 2010, 7DA

Announcements

Coming Soon:

Resume and CV: As a Book

Fundamentals of Complete Crash and Hang Memory Dump Analysis

Management Bits: An Anthology from Reductionist Manager

Crash Dump Analysis: Practical Foundations (Windows Edition, Systematic Software Fault Analysis Series)

Crash Dump Analysis for System Administrators and Support Engineers

New Magazines:

Debugged! MZ/PE: MagaZine for/from Practicing Engineers


New Books:

Advanced Windows Memory Dump Analysis with Data Structures: Training Course Transcript and WinDbg Practice Exercises with Notes

Accelerated .NET Memory Dump Analysis: Training Course Transcript and WinDbg Practice Exercises with Notes

Accelerated Windows Memory Dump Analysis: Training Course Transcript and WinDbg Practice Exercises with Notes

Introduction to Pattern-Driven Software Problem Solving

Memory Dump Analysis Anthology: Color Supplement for Volumes 4-5

Windows Debugging Notebook: Essential User Space WinDbg Commands

Memory Dump Analysis Anthology, Volume 5

Memory Dump Analysis Anthology, Volume 4

Memory Dump Analysis Anthology: Color Supplement for Volumes 1-3

Memory Dump Analysis Anthology, Volume 3

First Fault Software Problem Solving: A Guide for Engineers, Managers and Users

x64 Windows Debugging: Practical Foundations

Also available:

Windows Debugging: Practical Foundations

DLL List Landscape: The Art from Computer Memory Space

Dumps, Bugs and Debugging Forensics: The Adventures of Dr. Debugalov

WinDbg: A Reference Poster and Learning Cards

Memory Dump Analysis Anthology, Volume 2

Memory Dump Analysis Anthology, Volume 1

New Children's Book:

Baby Turing

Leave a Reply