Inside A Memory File
Sunday, July 11th, 2010Twitter epoch gives an additional aesthetic dimension to this artwork.
- Dmitry Vostokov @ DumpAnalysis.org + TraceAnalysis.org -
Twitter epoch gives an additional aesthetic dimension to this artwork.
- Dmitry Vostokov @ DumpAnalysis.org + TraceAnalysis.org -

- Dmitry Vostokov @ DumpAnalysis.org + TraceAnalysis.org -
- Dmitry Vostokov @ DumpAnalysis.org + TraceAnalysis.org -
Looks like reading Darwin biography influenced me in the direction of founding a museum. So I did and here’s its draft logo:
![]()
This multi-dimensional museum will show exhibitions dedicated to the history of debugging, memory dump artifacts and art. Stay tuned. The first exhibition opens very soon.
If you would like to donate an exhibit (for example, an old memory dump or a picture related to debugging) please use this page: http://www.dumpanalysis.org/contact. Any donations are greatly appreciated!
- Dmitry Vostokov @ DumpAnalysis.org + TraceAnalysis.org -
Previously announced book is now available on Amazon:
Memory Dump Analysis Anthology: Color Supplement for Volumes 1-3

- Dmitry Vostokov @ DumpAnalysis.org + TraceAnalysis.org -
Memory Dump Analysis Anthology lacks full color inserts. This is rather a current limitation of POD technology that OpenTask publisher uses at the present time. The solution previously announced a year ago is to print a separate full color title with selected articles and illustrations. Finally, it is about to be published next month. The book front and back covers are collages from covers of individual memory dump analysis volumes:
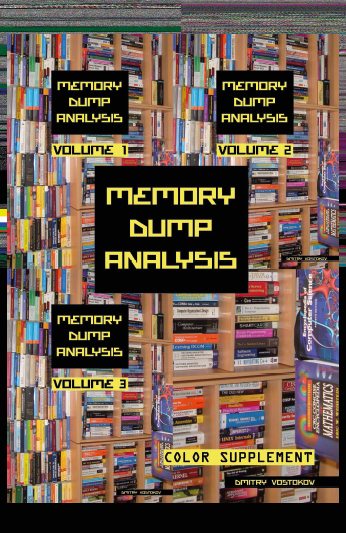
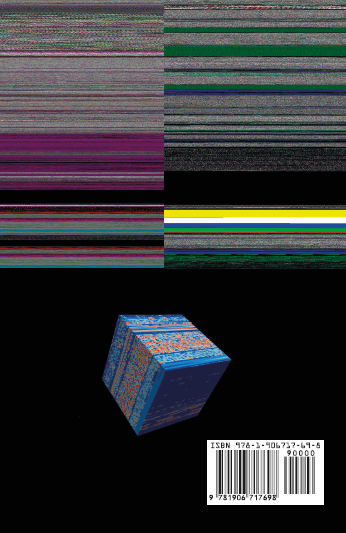
TOC will be available soon. Here is the book data:
OpenTask also plans a separate color supplement for volumes 4 and 5 once they are published.
- Dmitry Vostokov @ DumpAnalysis.org + TraceAnalysis.org -
Yesterday I discovered the blog j00ru//vx where I was pleased to see another memory visualization approach which I classify as synthetic:
x86 Kernel Memory Space Visualization (KernelMAP v0.0.1)
So far now I put a bit more extended (but in no way complete) classification with links (based on my previous blog post where every category is presented in chronological order of my encounter with links):
1. Synthetic
2. Natural
a. Static
b. Semi-dynamic
c. Dynamic
Please let me know any other approaches or links you know.
PS. I’m currently a big fan of artificial evolution and recommend this fantastic full-color book that has good ideas about expression-based visualization:
The Art of Artificial Evolution: A Handbook on Evolutionary Art and Music (Natural Computing Series)

- Dmitry Vostokov @ DumpAnalysis.org + TraceAnalysis.org -
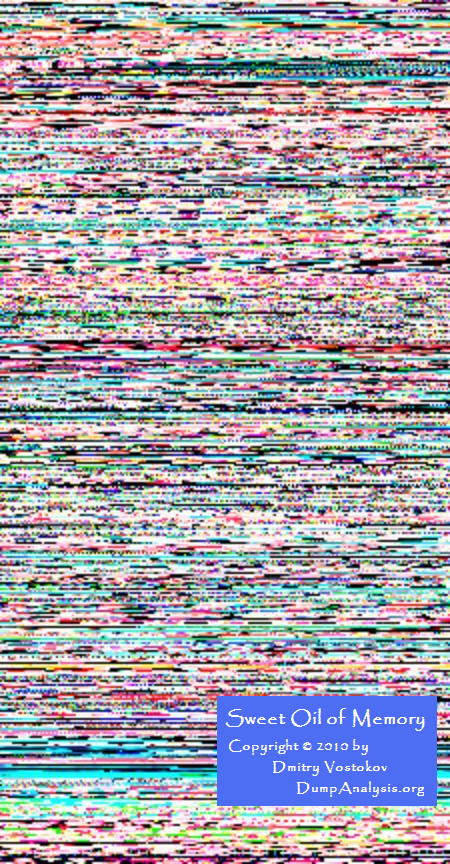
Twitter page for DumpAnalysis now has the background picture of a memory dump generated by Dump2Picture:
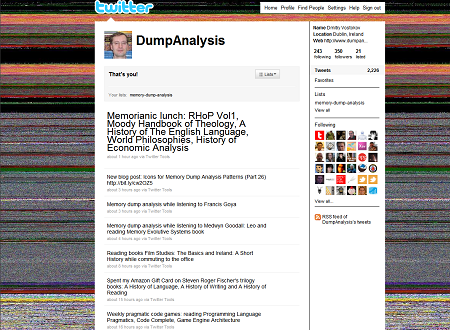
Hope you enjoy the new design ![]()
- Dmitry Vostokov @ DumpAnalysis.org + TraceAnalysis.org -
Today we introduce an icon for Insufficient Memory (virtual memory) pattern:
B/W
![]()
Color
![]()
Note: it features fragments from B/W and color images generated by Dump2Picture.
- Dmitry Vostokov @ DumpAnalysis.org + TraceAnalysis.org -
OpenTask to offer first 3 volumes of Memory Dump Analysis Anthology in one set:


The set is available exclusively from OpenTask e-Commerce web site starting from June. Individual volumes are also available from Amazon, Barnes & Noble and other bookstores worldwide.
Product information:
Information about individual volumes:
- Dmitry Vostokov @ DumpAnalysis.org + TraceAnalysis.org -
Plan to start providing training and seminars in my free time. If you are interested please answer these questions (you can either respond here in comments or use this form for private communication http://www.dumpanalysis.org/contact):
Additional topics of expertise that can be integrated into training include Source Code Reading and Analysis, Debugging, Windows Architecture, Device Drivers, Troubleshooting Tools Design and Implementation, Multithreading, Deep Down C and C++, x86 and x64 Assembly Language Reading.
Looking forward to your responses. Any suggestions are welcome.
- Dmitry Vostokov @ DumpAnalysis.org + TraceAnalysis.org -
I’m very pleased to announce that the Korean edition is available:

The book can be found on:
- Dmitry Vostokov @ DumpAnalysis.org + TraceAnalysis.org -
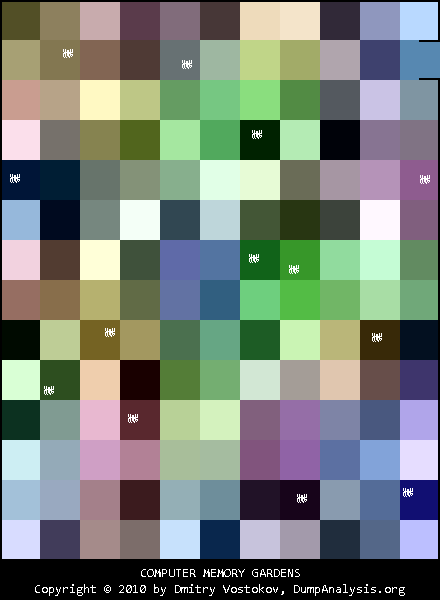
This post was motivated during my work on a memory dump differing tool called DumpLogic that can do logical and arithmetic operations between memory snapshots, for example, take a difference between them for further visualization. This tool is forthcoming next week and it resulted in another simple tool called DumpFilter. The latter allows to filter certain unsigned integer (DWORD) values from a memory dump (or any binary file) by replacing them with 0xFFFFFFFF and all other values with 0×00000000. The resultant binary file can be visualized by any data visualization package or transformed to a bitmap file using Dump2Picture to see distribution of filtered values.
As a filtering example I used TestDefaultDebugger64 to generate a process user memory dump. It was converted to a BMP file by Dump2Picture:
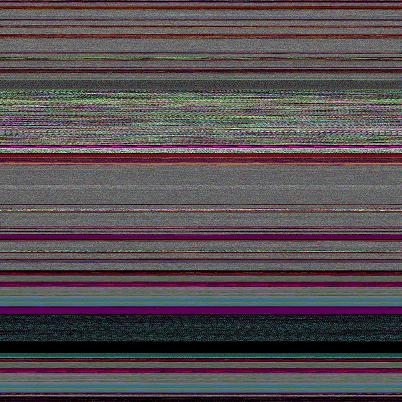
Then I filtered only AV exception code 0xc0000005:
C:\>DumpFilter tdd64.dmp tdd64.bin <dwords.txt
dwords.txt just contained one line
c0000005
It is possible to filter many values. Just put more lines to dwords.txt file. tdd64.bin was converted to tdd64.bmp by Dump2Picture:
C:\>Dump2Picture tdd64.bin tdd64.bmp
Because the image had only black and while RGBA colors I saved it as a B/W bitmap (click to enlarge, it is a 3236×3236 1.3Mb bitmap):

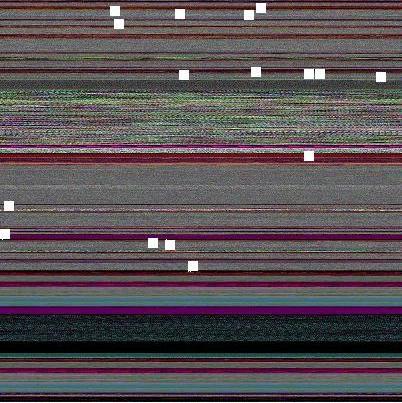
Every EV exception code is a white dot there but it is difficult to see them unless magnified. So I enlarged them manually on the following map:

I put them on the original image too. We can see that exception processing spans many areas:
The tool and the sample dwords.txt file (for c0000005 and 80000003) can be downloaded from this location:
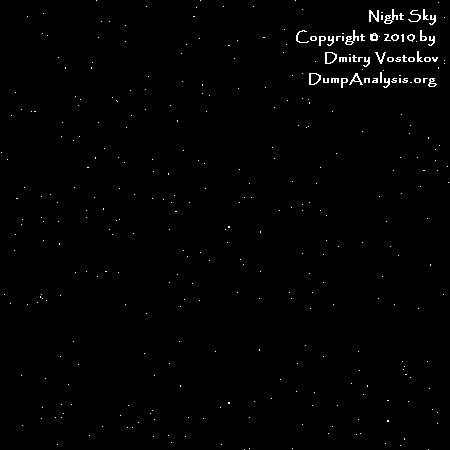
Another example: Night Sky memory space art image is just a fragment after filtering all 1 values from another process memory dump.
- Dmitry Vostokov @ DumpAnalysis.org + TraceAnalysis.org -
- Dmitry Vostokov @ DumpAnalysis.org + TraceAnalysis.org -
- Dmitry Vostokov @ DumpAnalysis.org + TraceAnalysis.org -
This is a revised, edited, cross-referenced and thematically organized volume of selected DumpAnalysis.org blog posts about crash dump analysis and debugging written in July 2009 - January 2010 for software engineers developing and maintaining products on Windows platforms, quality assurance engineers testing software on Windows platforms and technical support and escalation engineers dealing with complex software issues. The fourth volume features:
- 13 new crash dump analysis patterns
- 13 new pattern interaction case studies
- 10 new trace analysis patterns
- 6 new Debugware patterns and case study
- Workaround patterns
- Updated checklist
- Fully cross-referenced with Volume 1, Volume 2 and Volume 3
- New appendixes
Product information:

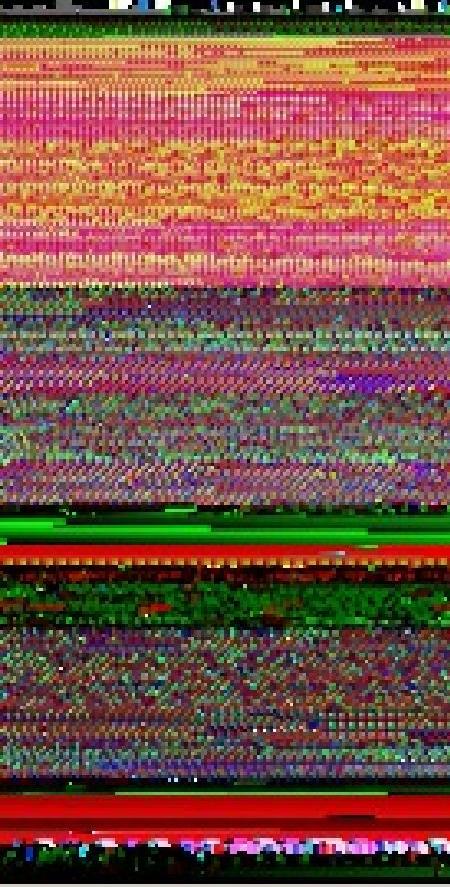
Back cover features memory space art image: Internal Process Combustion.
- Dmitry Vostokov @ DumpAnalysis.org + TraceAnalysis.org -
Internal Process Combustion (to be featured on Memory Dump Analysis Anthology, Volume 4 backcover):
- Dmitry Vostokov @ DumpAnalysis.org + TraceAnalysis.org -
- Dmitry Vostokov @ DumpAnalysis.org + TraceAnalysis.org -
The Year of Debugging, 0×7D9, was a remarkable year for DumpAnalysis.org. Here is the list of achievements to report:
- Software Trace Analysis as a new discipline with its own set of patterns
- Unification of Memory Dump Analysis with Software Trace Analysis (DA+TA)
- New computer memory dump-based art movements: Opcodism and Physicalist Art
- Discovery of 3D computer memory visualization techniques
- Establishing Software Maintenance Institute
- Broadening software fault injection as Software Defect Construction discipline
- Establishing a new profession of a Software Defect Researcher
- Starting ambitious Dictionary of Debugging
- Publishing Windows Debugging: Practical Foundations book
- Publishing the first x86-free Windows debugging book: x64 Windows Debugging: Practical Foundations
- Establishing the new debugging magazine: Debugged! MZ/PE
- Publishing Memory Dump Analysis Anthology, Volume 3
- Cooperation with OpenTask to promote First Fault Software Problem Solving book
- Establishing Debugging Expert(s) Magazine Online
- Creating the first development process for debugging and software troubleshooting tools: RADII
- Publishing the first pattern-driven memory dump analysis troubleshooting methodology as a foundation for software debugging
- Proposal for an International Memory Analysts and Debuggers Day
- Almost completed Windows Debugging Notebook to be published soon
Now DumpAnalysis.org focuses on The Year of Dump Analysis, 0×7DA, as a foundation for the forthcoming debugging decade and reveals future plans this weekend.
I’m sure that many other organizations and individuals have no less remarkable accomplishments to report for 2009. I promise to track down and write about some of them in the forthcoming book:
The Science of Dr. Watson: An Illustrated History of Debugging (ISBN: 978-1906717070)
- Dmitry Vostokov @ DumpAnalysis.org + TraceAnalysis.org -
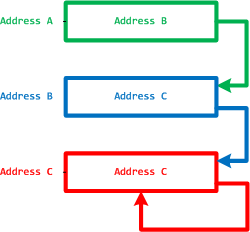
I started applying category theory (as an alternative to traditional set-theoretic approach of memory bits) to memory dump analysis, debugging and software trace analysis in parallel to my studies of that branch of mathematics and reading the book Memory Evolutive Systems. In addition to complex systems modelled in the latter book I apply evolutive systems approach to computer memory. Here is a picture illustrating MemD category of memory dumps (snapshots) as category objects and category arrows as different ways in arriving at the same memory picture:
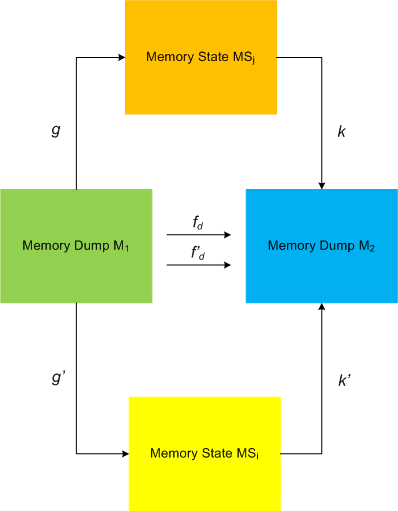
This category definitely applies to software traces as well if we consider every individual trace message or statement as a minidump. We currently consider software trace category MemT as a subcategory of MemD.
Configuration category of a computer memory dump represents its memory internals at an instant t (ideal memory dumps) or at a time interval T: components and links, pointers, wait chains, causal relations, data flows, … .
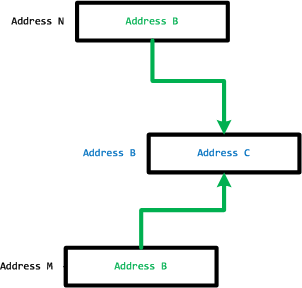
Pointers and their links are also objects and arrows to form a category, called MemP(tr). The following picture illustrates it with the last pointer shown as a dereference fixpoint:
The perception field of a pointer is a category of all links to its memory location:
However, the operating field of a pointer is its link to a memory location it is pointing to.
- Dmitry Vostokov @ DumpAnalysis.org -