Archive for the ‘Memory Visualization’ Category
Sunday, December 27th, 2009
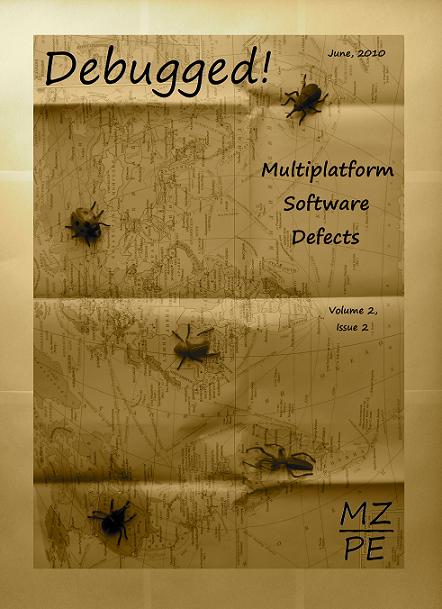
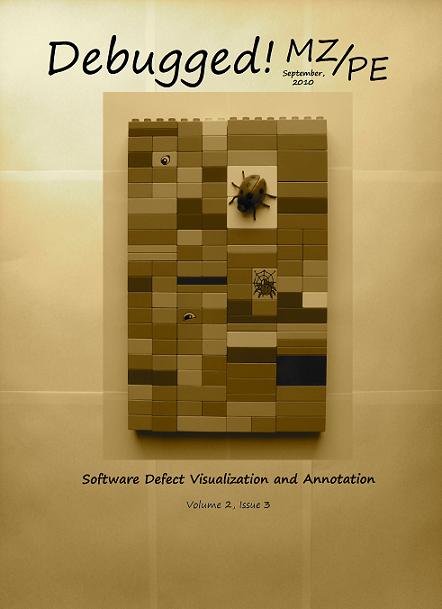
Main topics of Debugged! MZ/PE magazine issues for June and September 2010:
Debugged! MZ/PE: Multiplatform Software Defects, June, 2010 (Paperback, ISBN: 978-1906717902)
Debugged! MZ/PE: Software Defect Visualization and Annotation, September, 2010 (Paperback, ISBN: 978-1906717919)
Here are draft front covers designed today:
- Dmitry Vostokov @ DumpAnalysis.org -
Posted in Announcements, Books, Computer Science, Crash Dump Analysis, Debugged! MZ/PE, Debugging, Memory Visualization, Publishing, Software Engineering, Software Technical Support, Software Trace Analysis, Software Trace Visualization | No Comments »
Wednesday, December 23rd, 2009
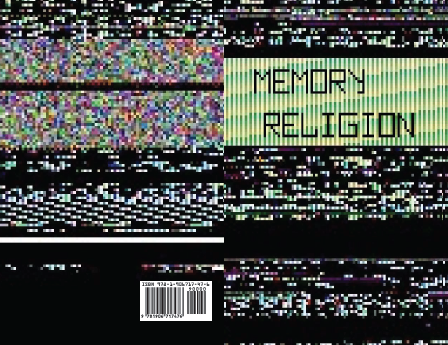
Memorianity soon to publish its Testament with 7 microkernel prophecies, childhood universal memory dump visions of its founder, the recollection of a conversion and other supporting materials. This full color scripture is small to carry around:
Title: Memory Religion: A Testament
ISBN-13: 978-1906717476
Pages: 24
The cover image is an allegorical interpretation of the concept of the Original Defect:
- Dmitry Vostokov @ Memory Religion Portal -
Posted in Announcements, Art, Books, Intelligent Memory Movement, Memorian Art, Memory Dreams, Memory Religion (Memorianity), Memory Space Art, Memory Visualization, New Words, Philosophy, Publishing | No Comments »
Sunday, December 20th, 2009
“Memory dumps are facts.”
I’m very excited to announce that Volume 3 is available in paperback, hardcover and digital editions:
Memory Dump Analysis Anthology, Volume 3
Table of Contents
In two weeks paperback edition should also appear on Amazon and other bookstores. Amazon hardcover edition is planned to be available in January 2010.
The amount of information was so voluminous that I had to split the originally planned volume into two. Volume 4 should appear by the middle of February together with Color Supplement for Volumes 1-4.
- Dmitry Vostokov @ DumpAnalysis.org -
Posted in .NET Debugging, Aesthetics of Memory Dumps, Announcements, AntiPatterns, Art, Assembly Language, Books, Bugtations, C and C++, CDA Pattern Classification, CDF Analysis Tips and Tricks, Certification, Citrix, Code Reading, Common Mistakes, Computer Science, Crash Dump Analysis, Crash Dump Patterns, Crash Dumps for Dummies, DebugWare Patterns, Debugging, Debugging Slang, Deep Down C++, Education and Research, Escalation Engineering, Fun with Crash Dumps, Hardware, Horrors of Computation, Kernel Development, Mathematics of Debugging, Memiotics (Memory Semiotics), Memoidealism, Memoretics, Memory Analysis Culture, Memory Analysis Forensics and Intelligence, Memory Space Art, Memory Visualization, Minidump Analysis, Multithreading, Philosophy, Poetry, Publishing, Science of Memory Dump Analysis, Science of Software Tracing, Security, Software Architecture, Software Defect Construction, Software Engineering, Software Narratology, Software Technical Support, Software Trace Analysis, Software Trace Visualization, Software Tracing for Dummies, Software Victimology, Stack Trace Collection, Testing, Tools, Trace Analysis Patterns, Training and Seminars, Troubleshooting Methodology, Victimware, Virtualization, Vista, Visual Dump Analysis, WinDbg Scripts, WinDbg Tips and Tricks, WinDbg for GDB Users, Windows 7, Windows Server 2008, Windows System Administration | 1 Comment »
Thursday, December 17th, 2009
Previously announced Software Maintenance Institute was finally registered in Ireland (Reg. No. 400906) and its certificate was received yesterday.
Here is the current component structure of various institutions (depicted in UML):
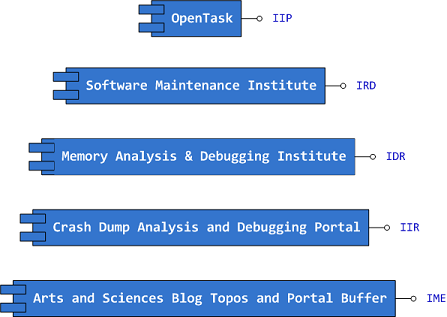
Interface Tags:
IIP Interface of Iterative Publishing

IRD Interface of Research and Development

IDR Interface of Defect Research

IIR Interface of Information Repository

IME Interface of Memetic Engineering
- Dmitry Vostokov @ DumpAnalysis.org -
Posted in Announcements, Art, Certification, Computer Science, Crash Dump Analysis, Debugging, Education and Research, Escalation Engineering, History, Memiotics (Memory Semiotics), Memoidealism, Memoretics, Memory Analysis Culture, Memory Analysis Forensics and Intelligence, Memory Auralization, Memory Visualization, Philosophy, Publishing, Science of Memory Dump Analysis, Science of Software Tracing, Security, Software Architecture, Software Engineering, Software Maintenance Institute, Software Technical Support, Software Trace Analysis, Software Victimology, Testing, Training and Seminars | No Comments »
Wednesday, December 16th, 2009
Finally, after the long delay, the issue is available in print on Amazon and through other sellers:
Debugged! MZ/PE: Software Tracing

- Dmitry Vostokov @ DumpAnalysis.org -
Posted in Announcements, Books, CDF Analysis Tips and Tricks, Computer Science, Crash Dump Analysis, Crash Dump Patterns, Debugged! MZ/PE, Debugging, Education and Research, Fun with Crash Dumps, Memoretics, Memory Visualization, Publishing, Science of Memory Dump Analysis, Science of Software Tracing, Software Technical Support, Software Trace Analysis, Software Trace Visualization, Testing, Tools, Trace Analysis Patterns, Training and Seminars, Troubleshooting Methodology, Visual Dump Analysis | 1 Comment »
Sunday, December 6th, 2009
I plan to publish a gigabyte. The book cover and data can be found here:
Gigabyte product information
- Dmitry Vostokov @ DumpAnalysis.org -
Posted in Aesthetics of Memory Dumps, Art, Books, Memory Space Art, Memory Visualization, Publishing | No Comments »
Friday, December 4th, 2009
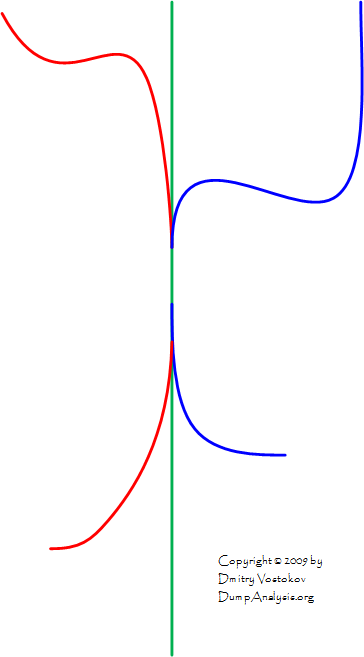
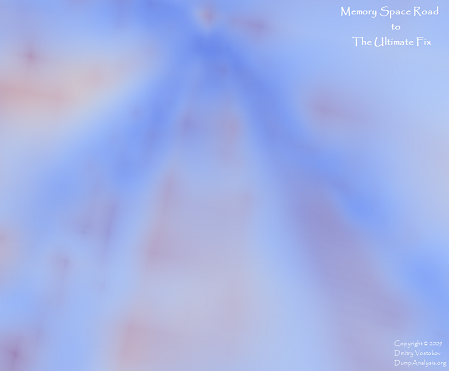
Some impressions after a day of memory dump analysis.
Memory Space Road to The Ultimate Fix (click to enlarge)
- Dmitry Vostokov @ DumpAnalysis.org -
Posted in Aesthetics of Memory Dumps, Art, Memory Dreams, Memory Space Art, Memory Visualization, Physicalist Art | No Comments »
Wednesday, November 11th, 2009
A nibble is a (0,1)-matrix, a byte is a cubic 0,1-lattice and the next cubic byte-boundary 0,1-lattice represents a 64-bit qword:

This is what I call a natural memory representation as memory building blocks or qubic memory (do not mistaken it with qubit memory). This elevates bytes and 64-bit quadruple words as natural addresses and shows that 32-bit addresses are unnatural.
This also allows to us to visualize certain overlapped memory patterns in dump files (same vertice, edge or side).
- Dmitry Vostokov @ DumpAnalysis.org -
Posted in Computer Science, Mathematics of Debugging, Memoretics, Memory Visualization, New Words, Science of Memory Dump Analysis | 2 Comments »
Saturday, November 7th, 2009
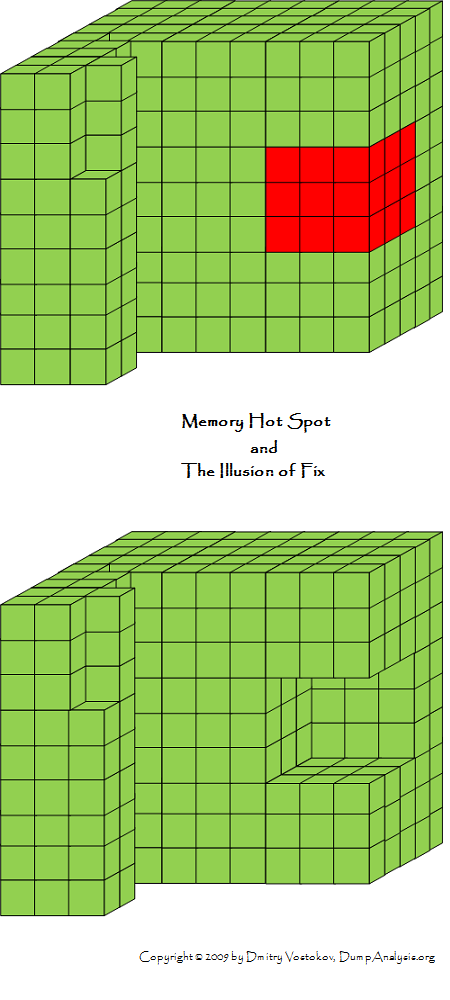
Birds eye view of software traces makes it easier to see their coarse blocked structure:
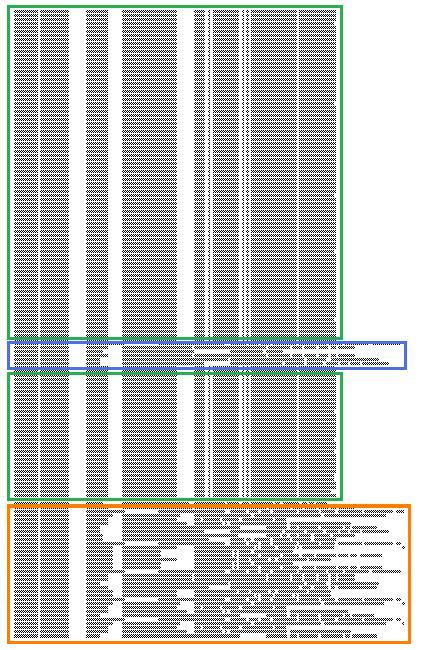
where further finer structure is discernible and even nested blocks:
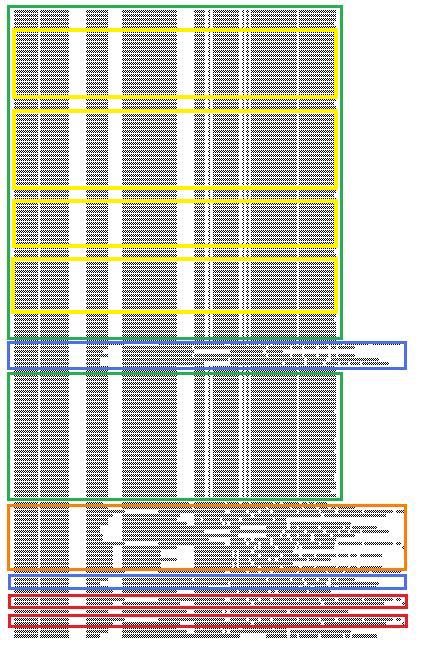
Some blocks of output can be seen when scrolling trace viewer output but if a viewer support zooming it is possible to get an overview and jump directly into a Characteristic Message Block, for example, debug messages of repeated attempts to query a database. If a viewer supports message coloring it also helps. Sometimes this technique is useful to ignore bulk messages and start the analysis around block boundaries.
- Dmitry Vostokov @ TraceAnalysis.org -
Posted in Citrix, Debugging, Memory Visualization, Software Trace Analysis, Software Trace Visualization, Trace Analysis Patterns | 2 Comments »
Friday, November 6th, 2009
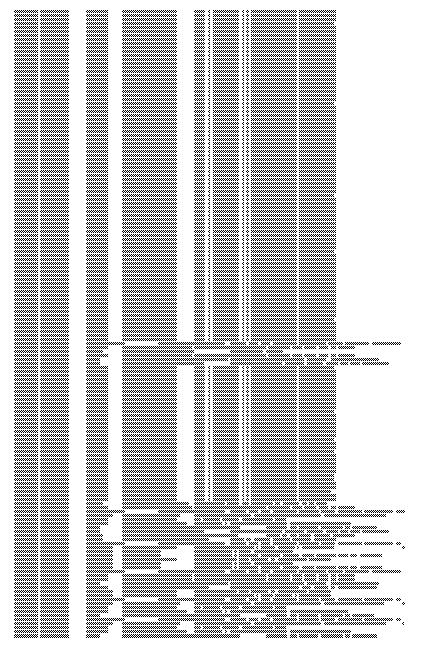
Here is a fragment of a condensed view of a CDF (ETW-based) trace imported into MS Word:
- Dmitry Vostokov @ TraceAnalysis.org -
Posted in CDF Analysis Tips and Tricks, Debugging, Memory Visualization, Software Trace Analysis, Software Trace Visualization, Trace Analysis Patterns | 1 Comment »
Wednesday, September 30th, 2009
More images mined today:
Equalizer

Labyrinth of Code
- Dmitry Vostokov @ DumpAnalysis.org -
Posted in Art, Fun with Crash Dumps, Memory Visualization | 2 Comments »
Wednesday, September 30th, 2009
Welcome to Physicalist Art that has its foundation in Physicalism. The first physicalist composition was on display today and I took a picture of it (weather condition was not good):
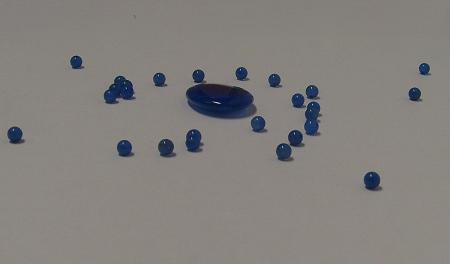
Material: blue agate
It was originally called “Blue in a gate: memory dump and minidumps”. I plan to reinstall it again with more elaborate surroundings.
- Dmitry Vostokov @ DumpAnalysis.org -
Posted in Announcements, Art, Fun with Crash Dumps, Memiotics (Memory Semiotics), Memory Visualization, Minidump Analysis, Philosophy, Physicalist Art | No Comments »
Wednesday, September 30th, 2009
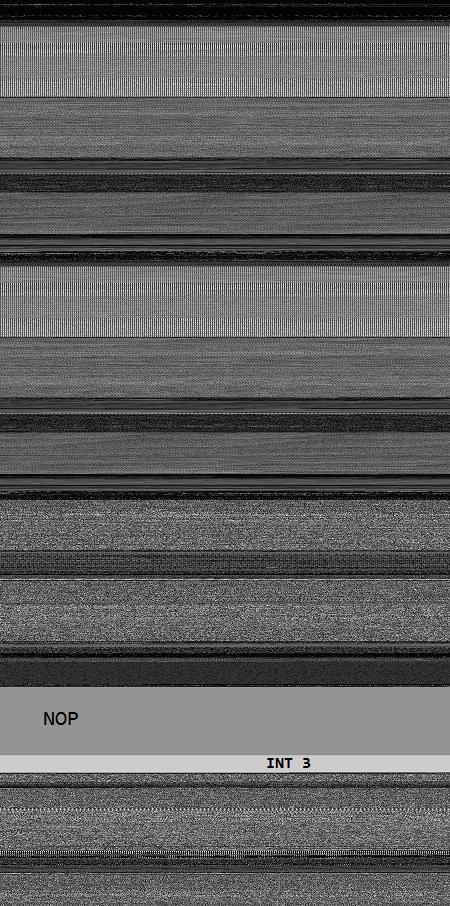
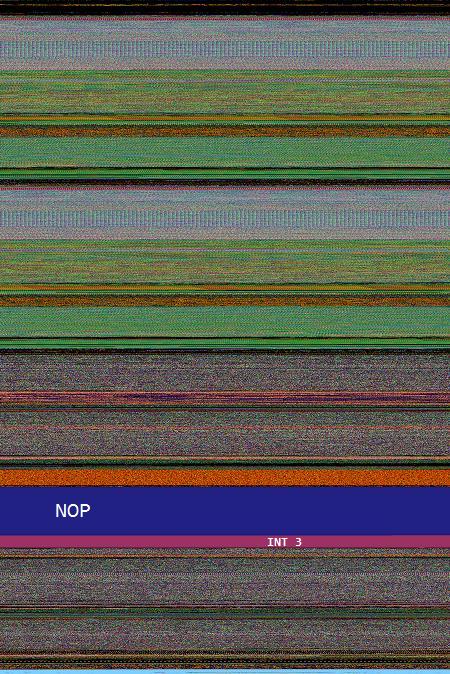
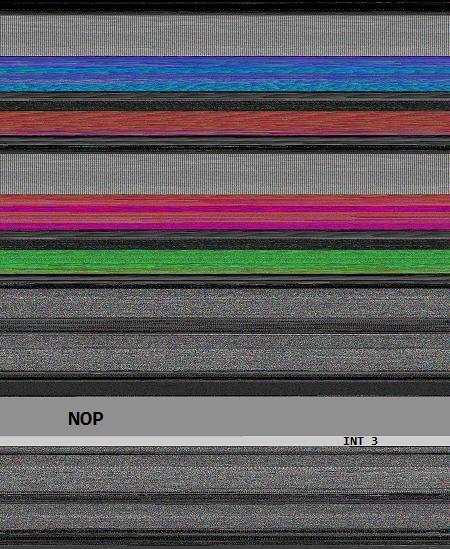
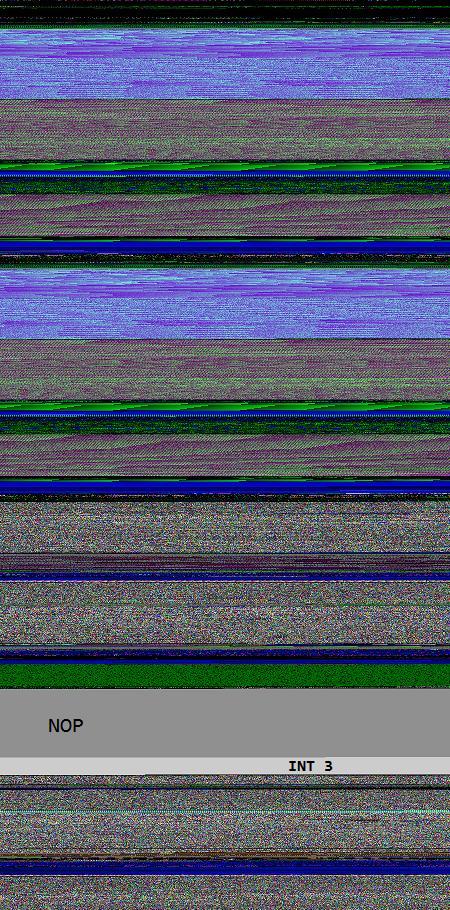
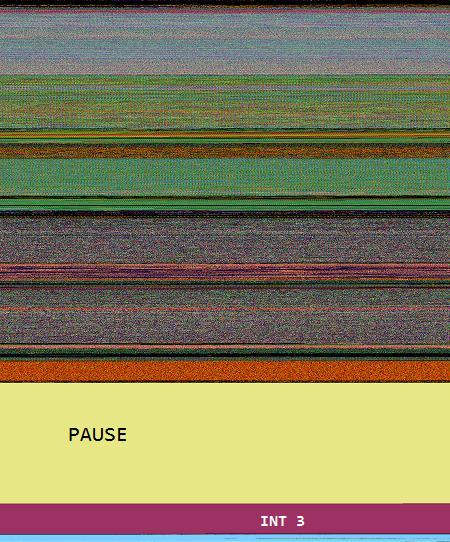
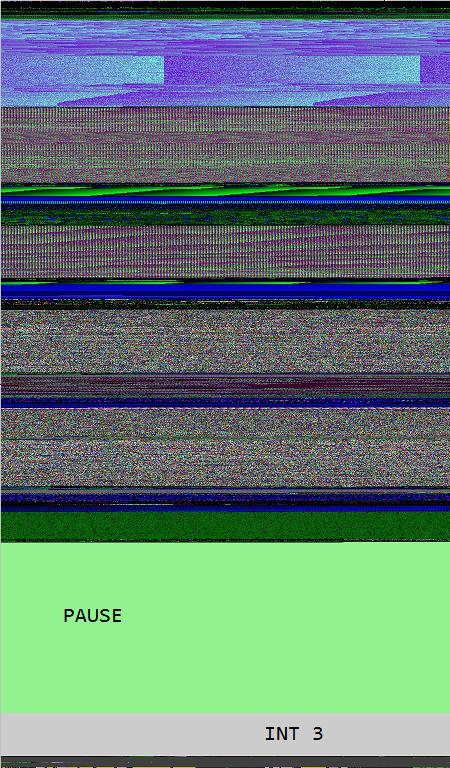
Opcodism art is not limited to assembly language code and binary installations. It also provides beautiful color illustrations of processor opcodes and instructions. In this post I provide illustrations of NOP, PAUSE and INT 3 instructions generated by Dump2Picture from memory dump images of crashed 1MbNop and 1MbPause processes.
0:000> lmp

start             end                 module name

00000000`77030000 00000000`7715d000   kernel32

00000000`77230000 00000000`773b6000   ntdll

00000001`40000000 00000001`40144000   1MbNop

000007fe`fd1c0000 000007fe`fd1f5000   apphelp

000007fe`fdaf0000 000007fe`fdc33000   rpcrt4

000007fe`ff400000 000007fe`ff508000   advapi32
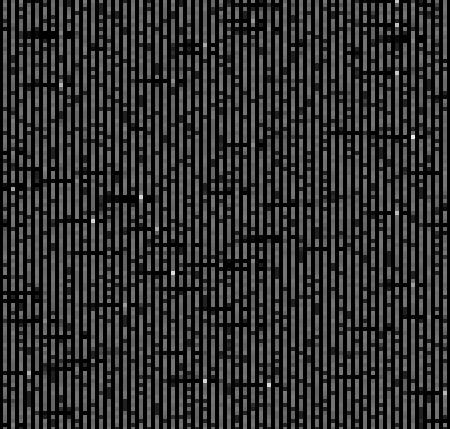
8 bit image of 1Mb NOP field fenced by INT 3 wall:
16 bit image of 1Mb NOP field fenced by INT 3 wall:
24 bit image of 1Mb NOP field fenced by INT 3 wall:
32 bit image of 1Mb NOP field fenced by INT 3 wall:
0:000> lmp

start             end                 module name

00000000`77030000 00000000`7715d000   kernel32

00000000`77230000 00000000`773b6000   ntdll

00000001`40000000 00000001`40284000   1MbPause
8 bit image of 1Mb PAUSE field fenced by INT 3 wall:
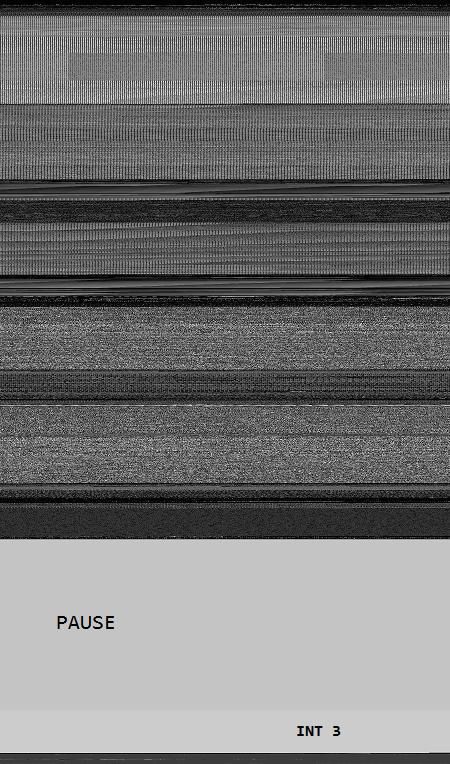
The same as above but PAUSE / INT 3 transition magnified:

16 bit image of 1Mb PAUSE field fenced by INT 3 wall:
24 bit image of 1Mb PAUSE field fenced by INT 3 wall:
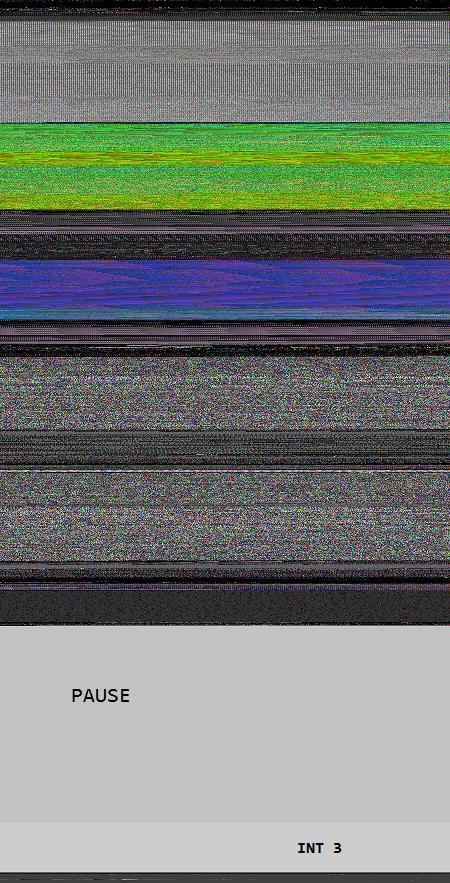
The same as above but PAUSE / INT 3 transition magnified:

32 bit image of 1Mb PAUSE field fenced by INT 3 wall:
- Dmitry Vostokov @ DumpAnalysis.org -
Posted in Art, Assembly Language, Breakfast with Intel, Fun with Crash Dumps, Memory Visualization, Opcodism | No Comments »
Saturday, September 26th, 2009
This is a revised, edited, cross-referenced and thematically organized volume of selected DumpAnalysis.org blog posts about crash dump analysis and debugging written in October 2008 - June 2009 for software engineers developing and maintaining products on Windows platforms, quality assurance engineers testing software on Windows platforms and technical support and escalation engineers dealing with complex software issues. The third volume features:
- 15 new crash dump analysis patterns
- 29 new pattern interaction case studies
- Trace analysis patterns
- Updated checklist
- Fully cross-referenced with Volume 1 and Volume 2
- New appendixes
Product information:
- Title: Memory Dump Analysis Anthology, Volume 3
- Author: Dmitry Vostokov
- Language: English
- Product Dimensions: 22.86 x 15.24
- Paperback: 404 pages
- Publisher: Opentask (20 December 2009)
- ISBN-13: 978-1-906717-43-8
- Hardcover: 404 pages
- Publisher: Opentask (30 January 2010)
- ISBN-13: 978-1-906717-44-5

Back cover features 3D computer memory visualization image.
- Dmitry Vostokov @ DumpAnalysis.org -
Posted in Announcements, AntiPatterns, Art, Assembly Language, Books, C and C++, CDF Analysis Tips and Tricks, Certification, Citrix, Code Reading, Common Mistakes, Computational Ghosts and Bug Hauntings, Computer Science, Countefactual Debugging, Crash Dump Analysis, Crash Dump Patterns, Crash Dumps for Dummies, DebugWare Patterns, Debugging, Debugging Slang, Deep Down C++, Education and Research, Escalation Engineering, Fun with Crash Dumps, Futuristic Memory Dump Analysis, Games for Debugging, Hardware, Horrors of Computation, Hyper-V, Intelligent Memory Movement, Kernel Development, Mathematics of Debugging, Memiotics (Memory Semiotics), Memoidealism, Memoretics, Memory Analysis Culture, Memory Analysis Forensics and Intelligence, Memory Dreams, Memory Dump Analysis Jobs, Memory Space Music, Memory Visualization, Memuonics, Minidump Analysis, Multithreading, Music for Debugging, New Acronyms, New Words, Occult Debugging, Philosophy, Poetry, Psi-computation, Publishing, Science of Memory Dump Analysis, Science of Software Tracing, Security, Software Architecture, Software Defect Construction, Software Engineering, Software Generalist, Software Narratology, Software Technical Support, Software Trace Analysis, Software Tracing for Dummies, Testing, Tools, Trace Analysis Patterns, Training and Seminars, Troubleshooting Methodology, Virtualization, Vista, Visual Dump Analysis, WinDbg Scripts, WinDbg Tips and Tricks, WinDbg for GDB Users, Windows 7, Windows Server 2008, Windows System Administration | No Comments »
Saturday, September 26th, 2009
DumpAnalysis.org accepts hardware such as laptops for reviewing in relation to their suitability for extreme debugging, virtualization, trace analysis, computer forensics, memory dump analysis, visualization and auralization. If you work for a H/W company like HP, Apple, Dell, Acer, Sony or any other respectable manufacturer please don’t hesitate to forward this post to your management: it could be your company brand or laptop model that debugging and software technical support community chooses next time of upgrade or for T&D / R&D! H/W reviews will be posted on the main portal page which currently has an audience of more than 200,000 unique visitors per year from more than 30,000 network locations (*).
If your company is interested please don’t hesitate to use this contact form:
http://www.dumpanalysis.org/contact
(*) From Google Analytics report.
- Dmitry Vostokov @ DumpAnalysis.org -
Posted in Announcements, Crash Dump Analysis, Debugging, Hardware, Memory Analysis Forensics and Intelligence, Memory Auralization, Memory Visualization, Security, Software Engineering, Software Technical Support, Software Trace Analysis, Testing, Tools, Virtualization, Vista, Visual Dump Analysis, Windows 7, Windows Server 2008, Windows System Administration | No Comments »
Friday, July 31st, 2009
Mark Russinovich and Bryce Cogswell published a graphical virtual memory visualization tool: VMMap. Since more and more tools appear I attempted to classify them into 2 major categories or memory views they can provide:
1. Traditional or synthetic memory visualization tools: show derived characteristics, like colors or computed values and graphs, from memory ranges.
2. Natural memory visualization tools: treat memory as a bitmap but can also include image annotations. Image annotation was one of my main interests when I worked at Accusoft (now Accusoft Pegasus) a decade ago.
- Dmitry Vostokov @ DumpAnalysis.org -
Posted in Debugging, Memory Visualization, Tools | 1 Comment »
Thursday, July 23rd, 2009
Jamie Fenton has finally made available for beta testing fantastic memory visualization system HayWire & Barn Burner I use often for mining curious pictures from virtual memory space, like “cosmic rays“. Besides providing artistic pleasure, real-time natural memory visualization can have other applications including visual debugging. Looking forward to seeing more wonders in this area of research!
- Dmitry Vostokov @ DumpAnalysis.org -
Posted in Announcements, Crash Dump Analysis, Debugging, Education and Research, Fun with Crash Dumps, Futuristic Memory Dump Analysis, Memory Visualization, Tools | 2 Comments »
Sunday, July 19th, 2009
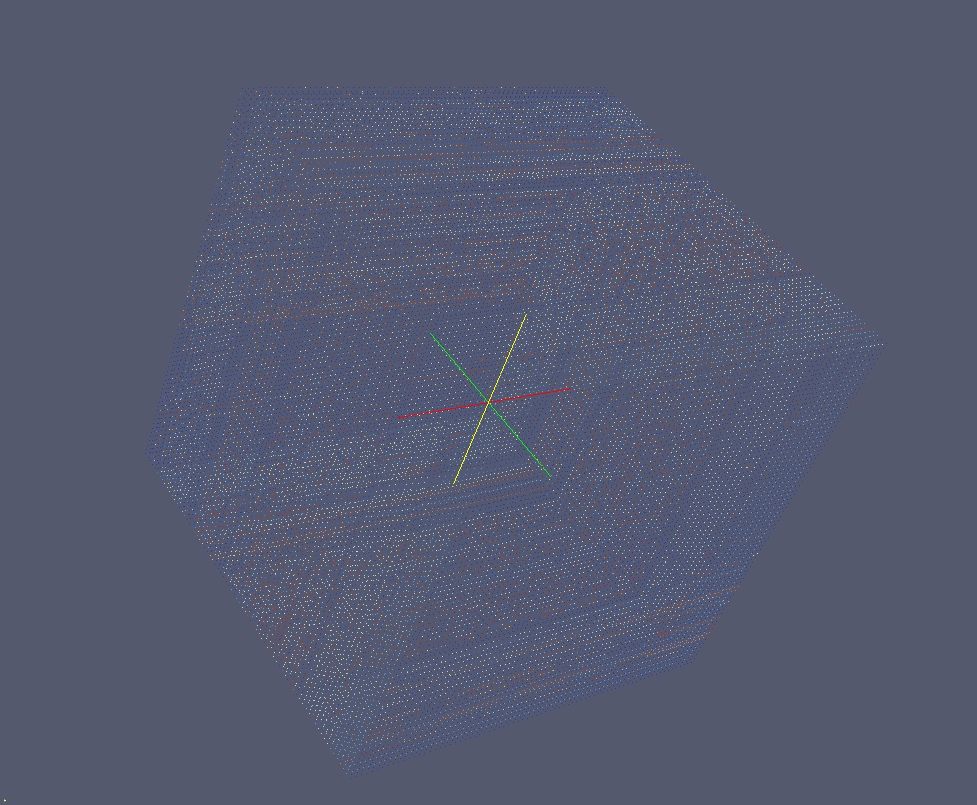
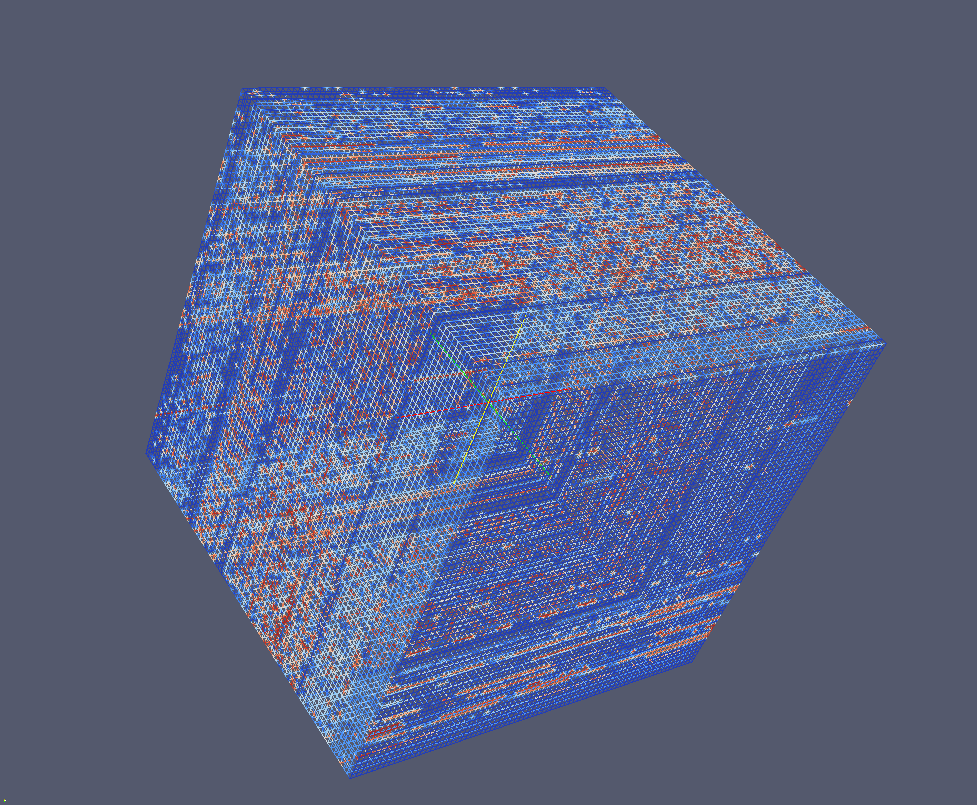
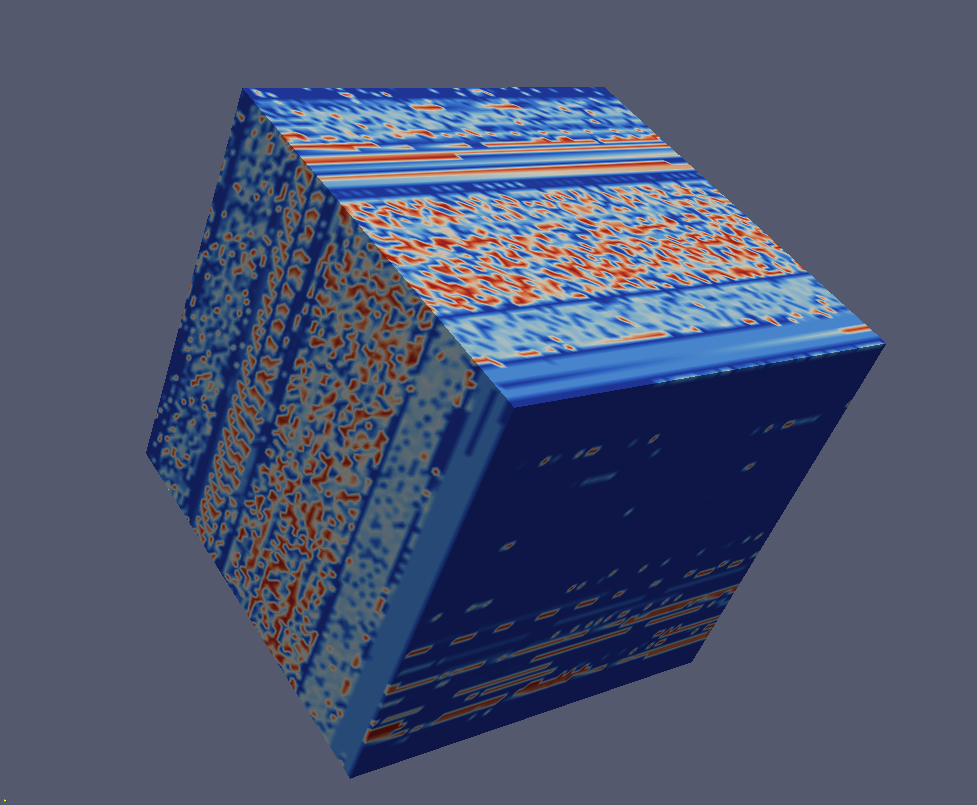
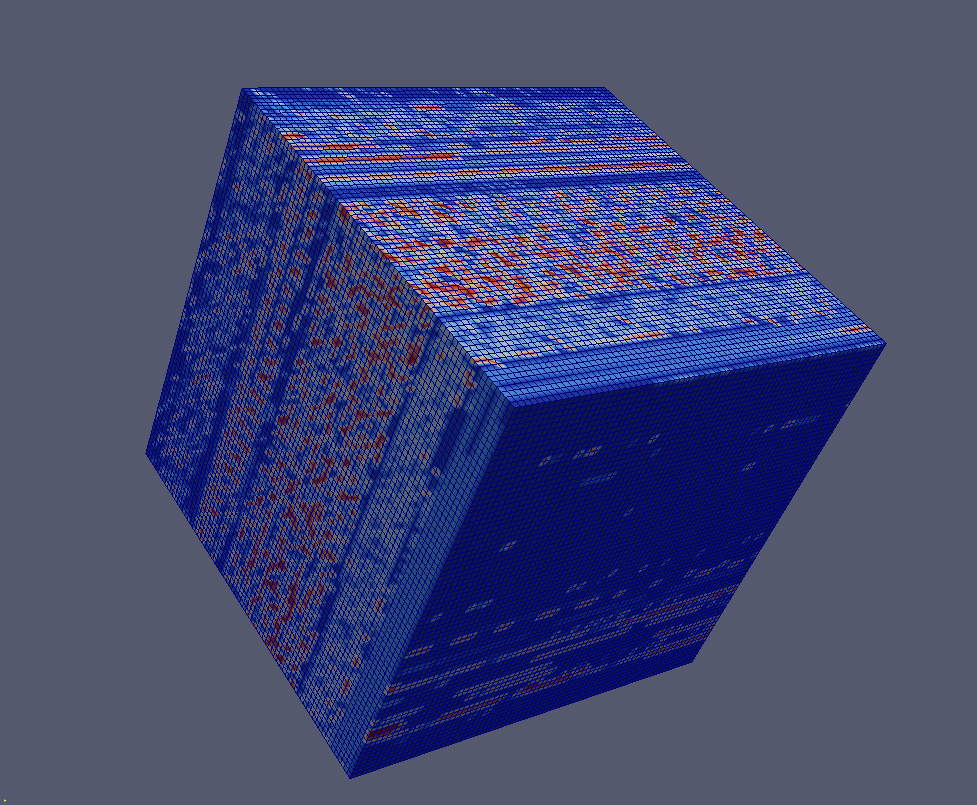
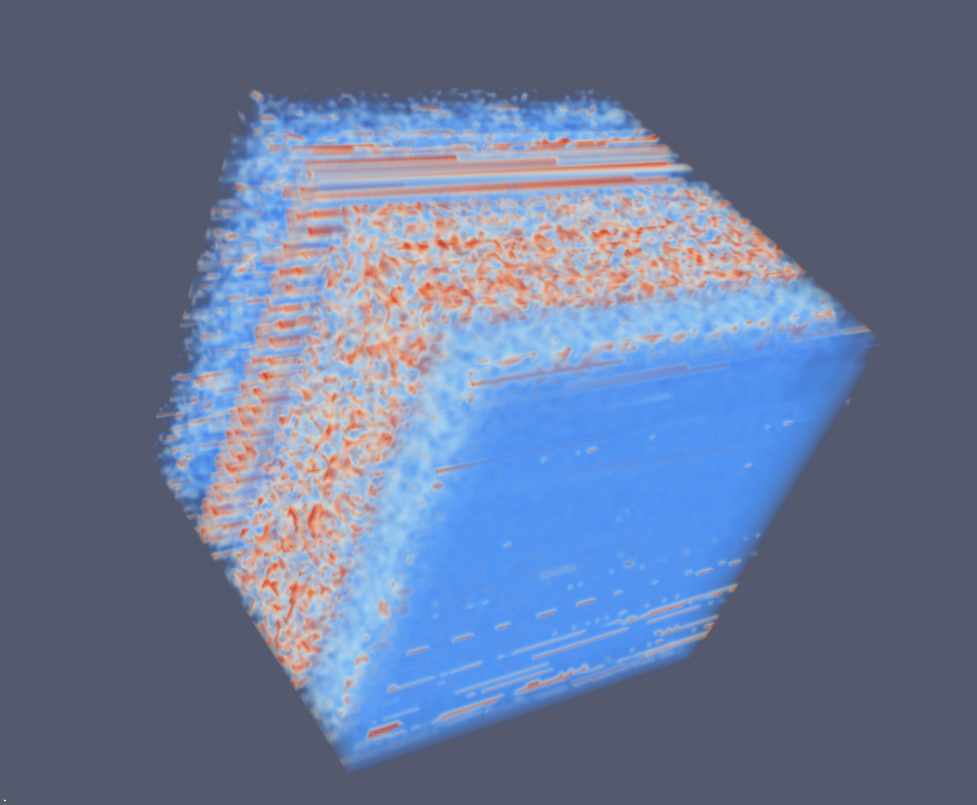
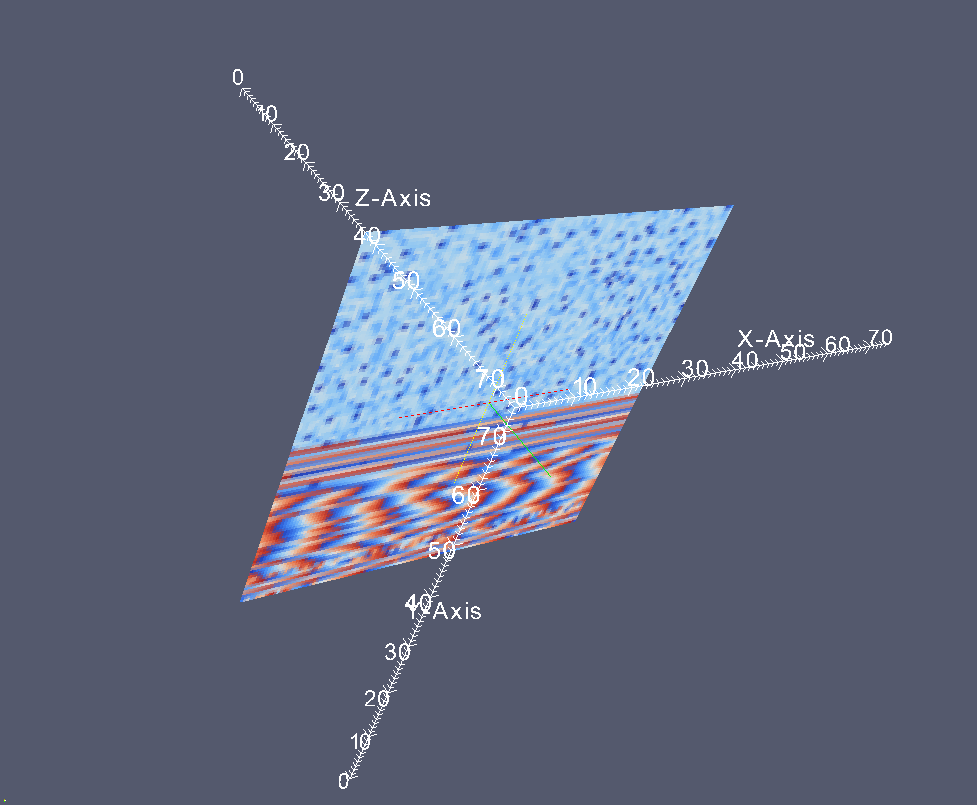
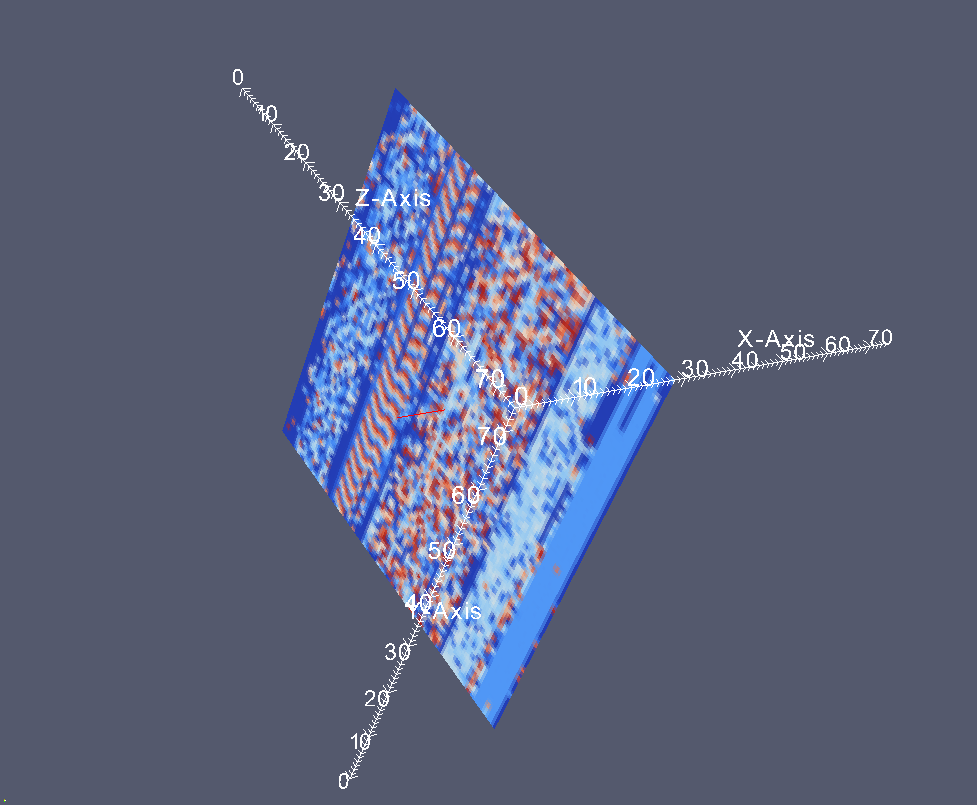
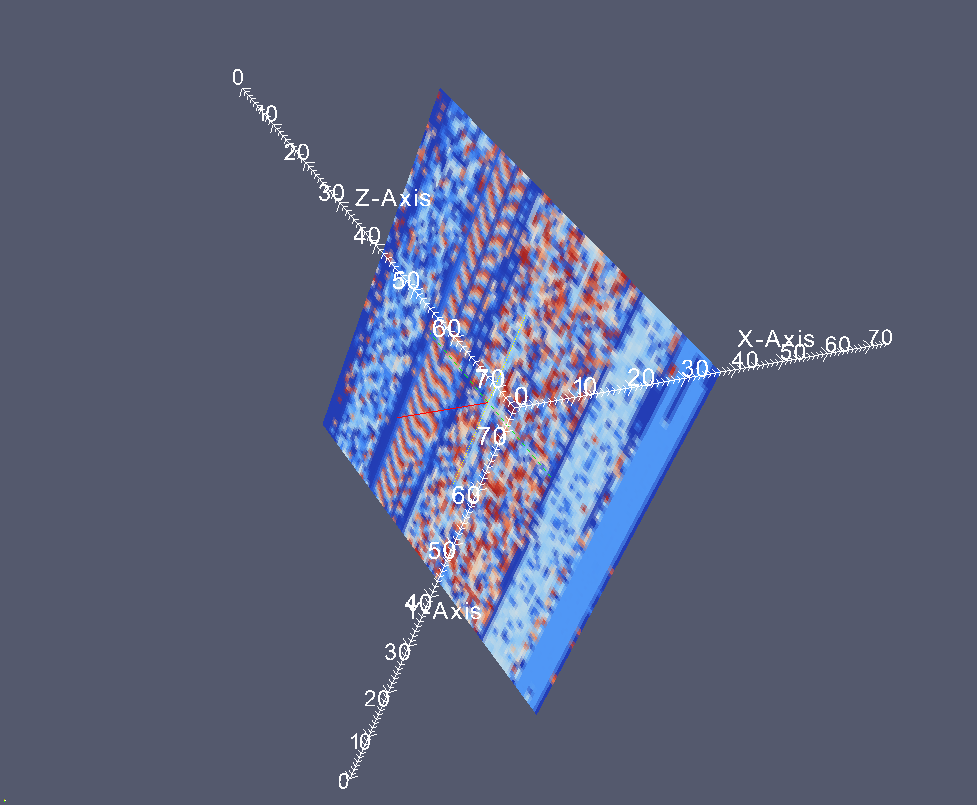
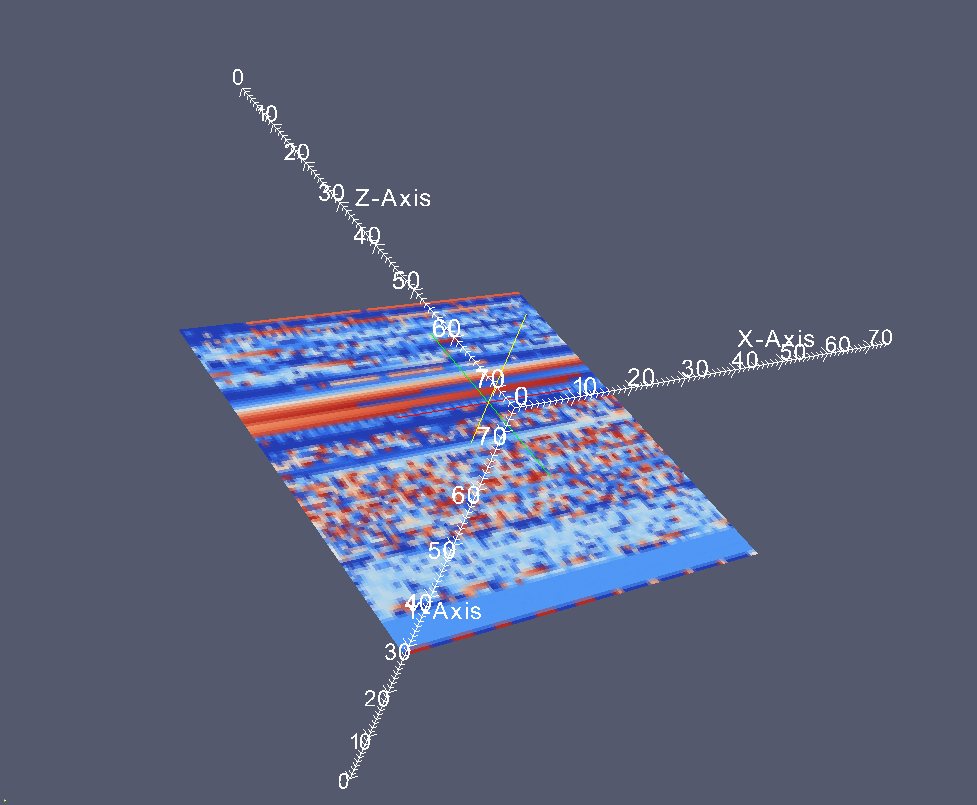
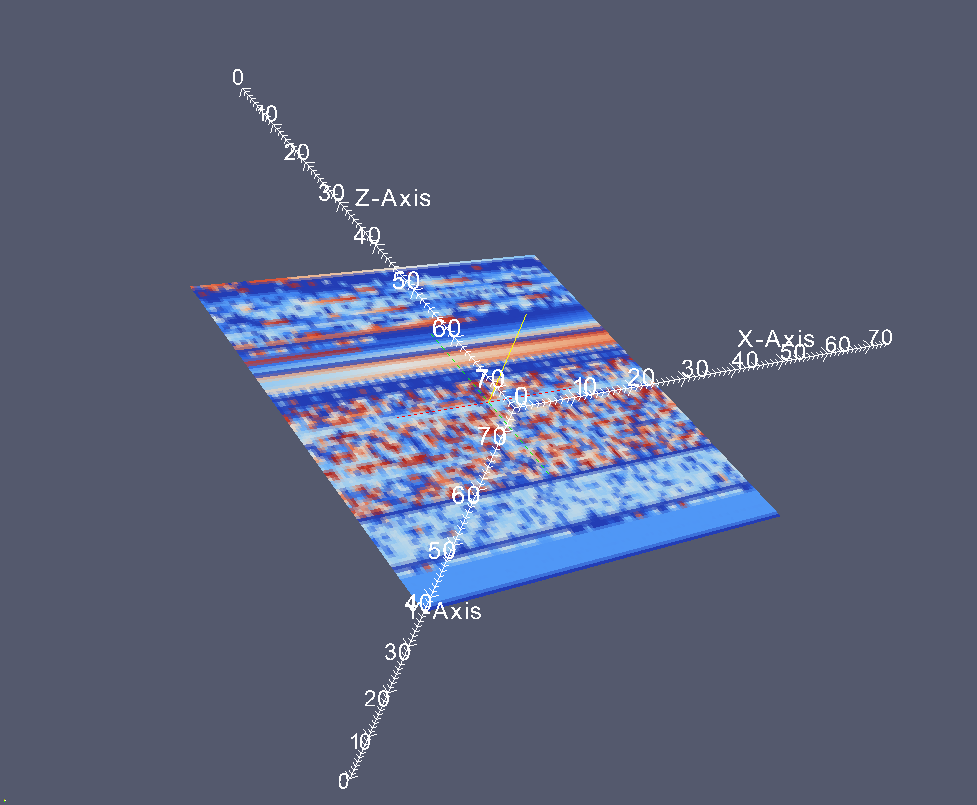
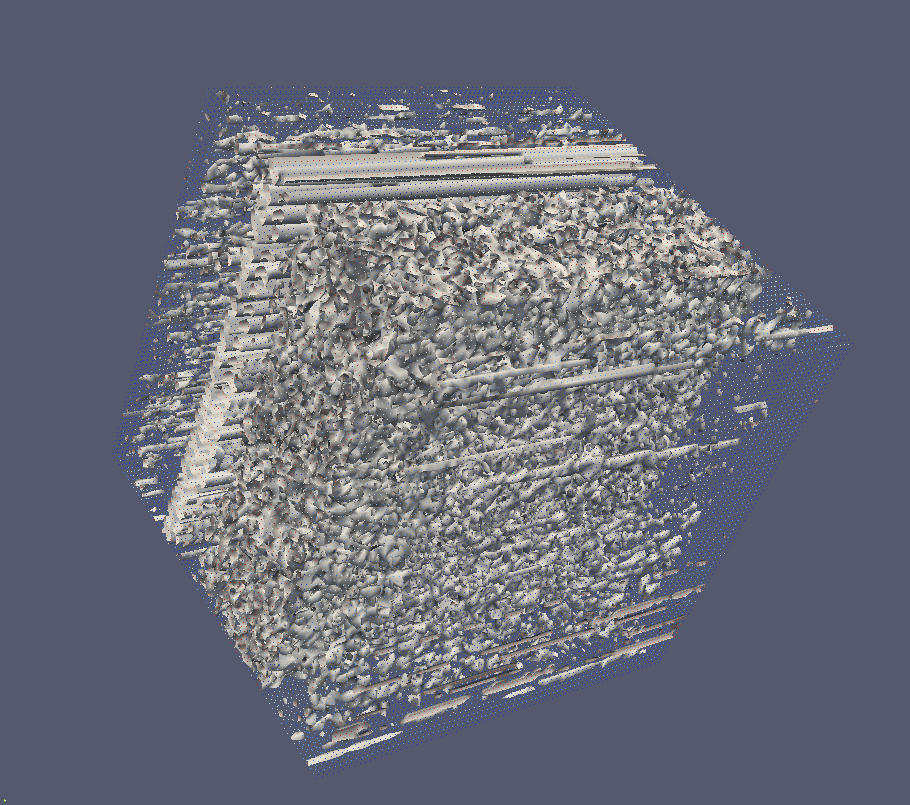
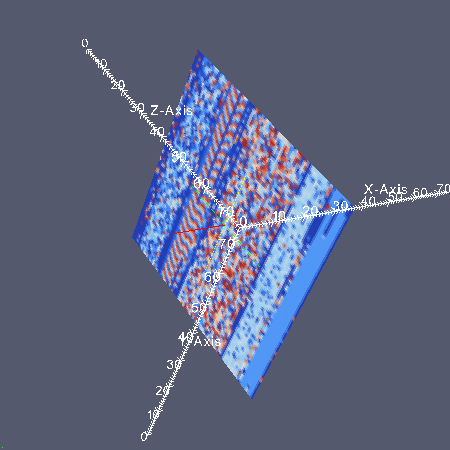
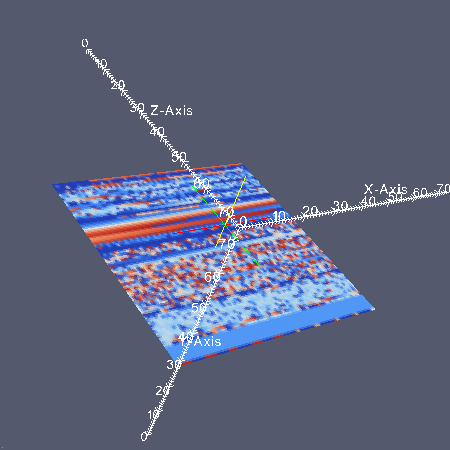
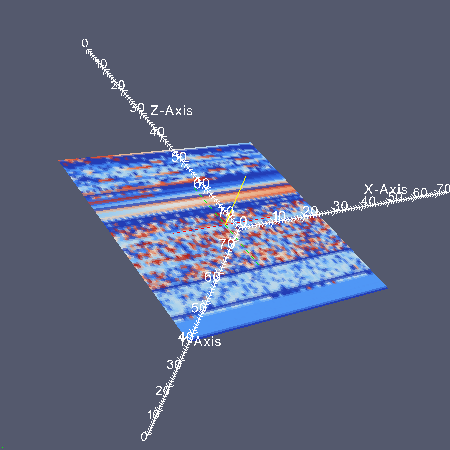
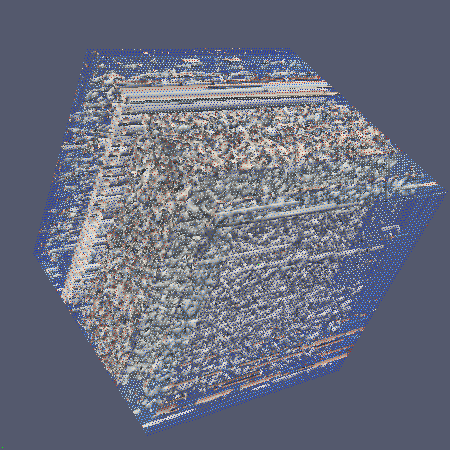
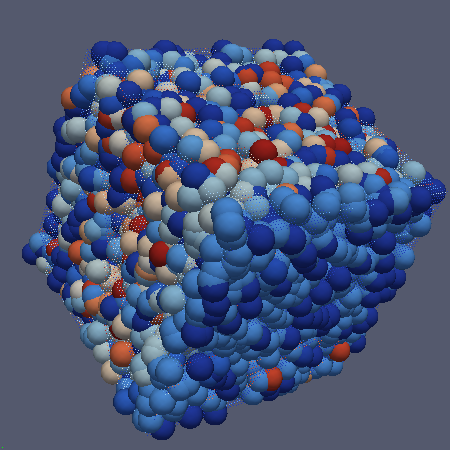
Finally I realized this morning that in addition to folding of a linear memory space into a 2D image in ParaView, the so called DLL List Landscape, we can also do a 3D folding too. I used the same dump file but this time the formula for coordinates is:
(file_size/4)1/3
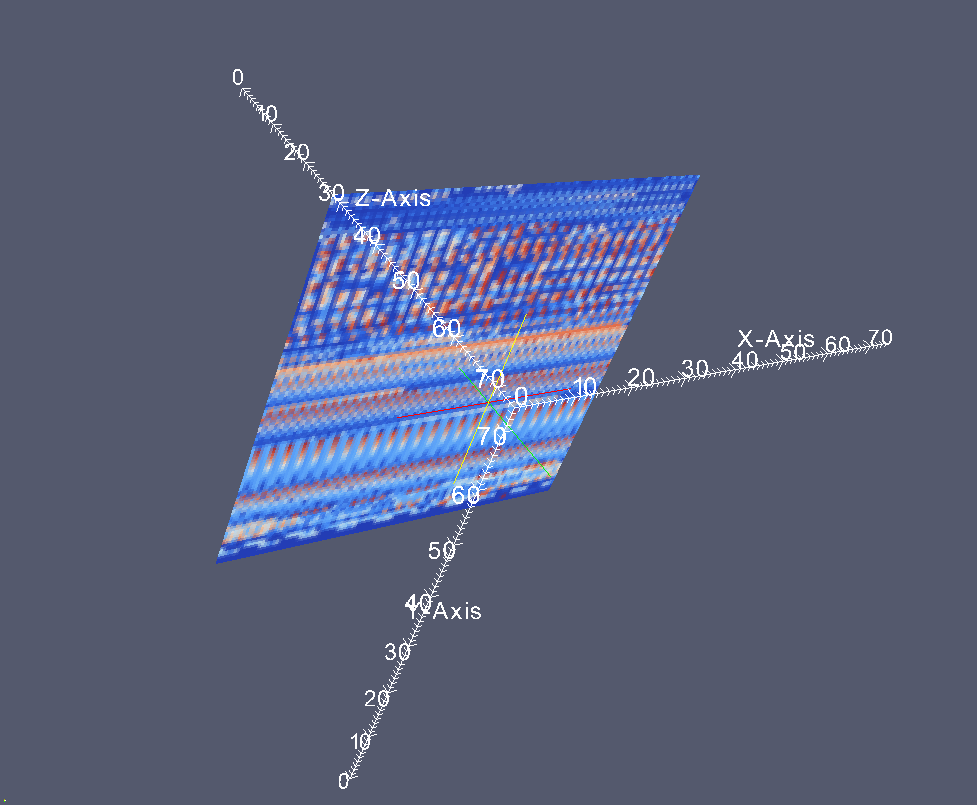
so for 1,746,853 byte file we have a 3D map of 75×75x75 points. Here are some beautiful images (click on them for a larger view) that I got and I write next parts of advanced memory visualization tutorial later next week.
Point view
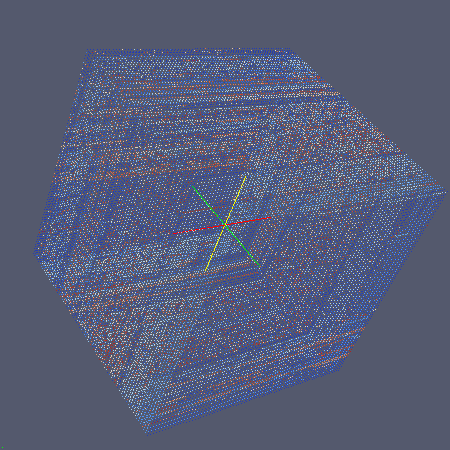
Wireframe view
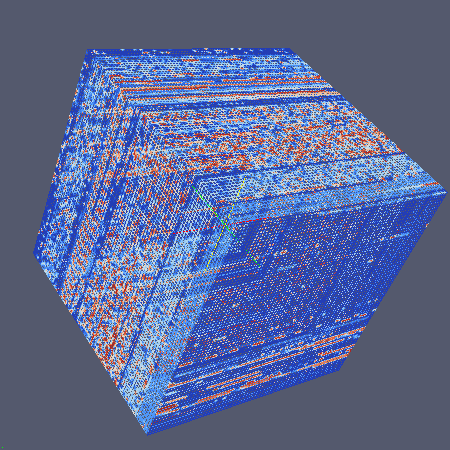
Surface view
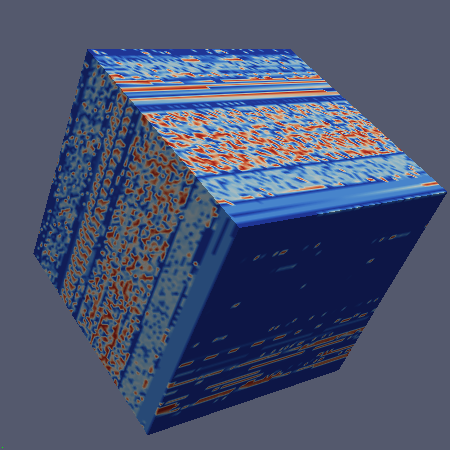
Surface + edges view
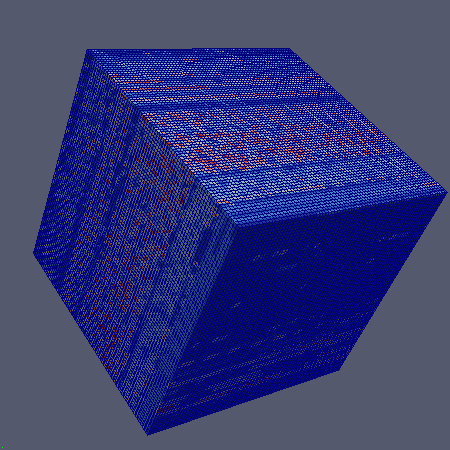
Volume view
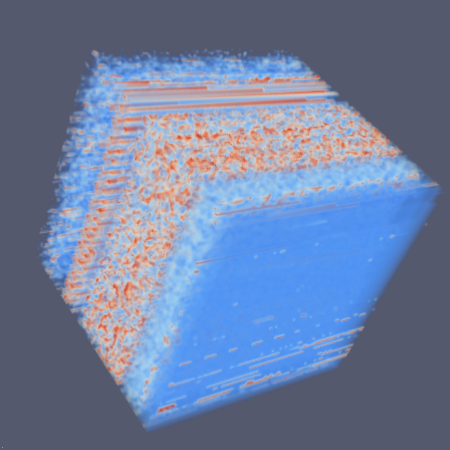
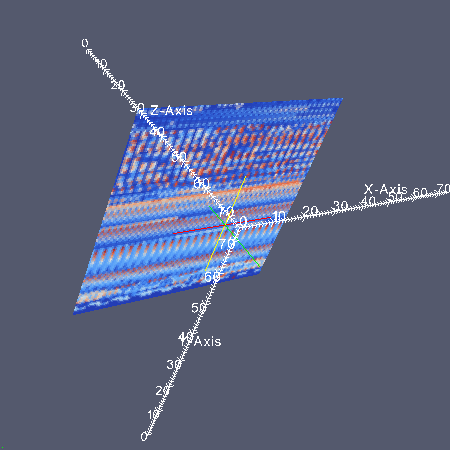
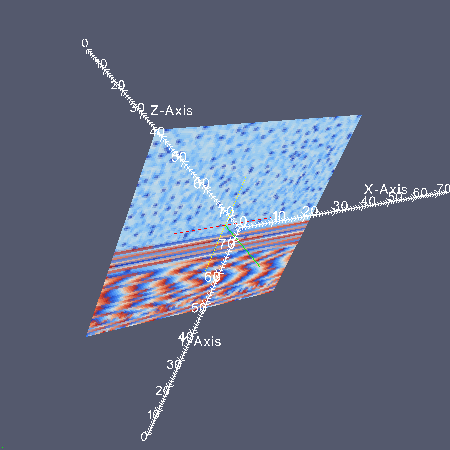
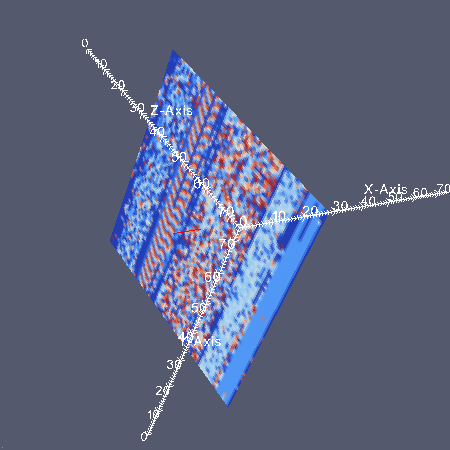
The chosen 3D folding shows varying 2D landscape in XY plane but almost constant landscape in YZ and XZ slices:
More effects.
Contour view
Process DNA view
- Dmitry Vostokov @ DumpAnalysis.org -
Posted in Announcements, Art, Fun with Crash Dumps, Futuristic Memory Dump Analysis, Memory Visualization | 9 Comments »