Archive for the ‘Memory Visualization’ Category
Friday, December 17th, 2010
As the new decade is approaching (2011-2020) we would like to make a few previews and predictions:
- Increased complexity of software will bring more methods from biological, social sciences and humanities in addition to existing methods of automated debugging and computer science techniques
- Focus on first fault software problem solving (when aspect)
- Focus on pattern-driven software problem solving (how aspect)
- Fusion of debugging and malware analysis into a unified structural and behavioral pattern framework
- Visual debugging, memory and software trace visualization techniques
- Software maintenance certification
- Focus on domain-driven troubleshooting and debugging tools as a service (debugware TaaS)
- Focus on security issues related to memory dumps and software traces
- New scripting languages and programming language extensions for debugging
- The maturation of the science of memory snapshots and software traces (memoretics)
Imagining is not not limited to the above and more to come and explain in the forthcoming parts.
- Dmitry Vostokov @ DumpAnalysis.org + TraceAnalysis.org -
Posted in Announcements, Anthropology, Archaeology of Computer Memory, Biology, Certification, Computer Science, Countefactual Debugging, Crash Analysis Report Environment (CARE), Crash Dump Analysis, Crash Dump Patterns, DebugWare Patterns, Debugging, Debugging Industry, Debugging Methodology, Debugging Trends, Dublin School of Security, EasyDbg, Economics, Escalation Engineering, Evolution, First Fault Problem Solving, Futuristic Memory Dump Analysis, General Memory Analysis, General Science, Geography, Hardware, Hermeneutics of Memory Dumps and Traces, History, Humanities, Language, Laws of Troubleshooting and Debugging, Logic, Malware Analysis, Malware Patterns, Mathematics of Debugging, Memiotics (Memory Semiotics), Memoretics, Memory Analysis Forensics and Intelligence, Memory Analysis Report System, Memory Dump Analysis and History, Memory Systems Language, Memory Visualization, Paleo-debugging, Pattern Models, Pattern Prediction, Physics, Psychology, Publishing, Science of Memory Dump Analysis, Science of Software Tracing, Security, Social Media, Social Sciences, Software Architecture, Software Behavior Patterns, Software Chorography, Software Chorology, Software Defect Construction, Software Engineering, Software Generalist, Software Maintenance Institute, Software Narrative Fiction, Software Narratology, Software Technical Support, Software Trace Analysis, Software Trace Analysis and History, Software Trace Deconstruction, Software Trace Linguistics, Software Trace Visualization, Software Troubleshooting Patterns, Software Victimology, Statistics, Structural Memory Analysis and Social Sciences, Structural Memory Patterns, Structural Trace Patterns, Systems Thinking, Testing, Tools, Trace Analysis Patterns, Troubleshooting Methodology, Unified Debugging Patterns, Uses of UML, Victimware, Virtualization, Visual Dump Analysis, Windows System Administration, Workaround Patterns | No Comments »
Monday, November 22nd, 2010
Posted in Aesthetics of Memory Dumps, Announcements, Art, Baby Turing Series, Books, Bugtations, Cartoons, Crash Dump Analysis, Debugging, Fun with Crash Dumps, Fun with Debugging, Memory Space Art, Memory Visualization, Software Engineering | No Comments »
Friday, November 12th, 2010
Five volumes of cross-disciplinary Anthology (dubbed by the author “The Summa Memorianica”) lay the foundation of the scientific discipline of Memoretics (study of computer memory snapshots and their evolution in time) that is also called Memory Dump and Software Trace Analysis.ca
The 5th volume contains revised, edited, cross-referenced, and thematically organized selected DumpAnalysis.org blog posts about crash dump, software trace analysis and debugging written in February 2010 - October 2010 for software engineers developing and maintaining products on Windows platforms, quality assurance engineers testing software on Windows platforms, technical support and escalation engineers dealing with complex software issues, and security researchers, malware analysts and reverse engineers. The fifth volume features:
- 25 new crash dump analysis patterns
- 11 new pattern interaction case studies (including software tracing)
- 16 new trace analysis patterns
- 7 structural memory patterns
- 4 modeling case studies for memory dump analysis patterns
- Discussion of 3 common analysis mistakes
- Malware analysis case study
- Computer independent architecture of crash analysis report service
- Expanded coverage of software narratology
- Metaphysical and theological implications of memory dump worldview
- More pictures of memory space and physicalist art
- Classification of memory visualization tools
- Memory visualization case studies
- Close reading of the stories of Sherlock Holmes: Dr. Watson’s observational patterns
- Fully cross-referenced with Volume 1, Volume 2, Volume 3, and Volume 4
Product information:
- Title: Memory Dump Analysis Anthology, Volume 5
- Author: Dmitry Vostokov
- Language: English
- Product Dimensions: 22.86 x 15.24
- Paperback: 400 pages
- Publisher: Opentask (10 December 2010)
- ISBN-13: 978-1-906717-96-4
- Hardcover: 400 pages
- Publisher: Opentask (10 December 2010)
- ISBN-13: 978-1-906717-97-1

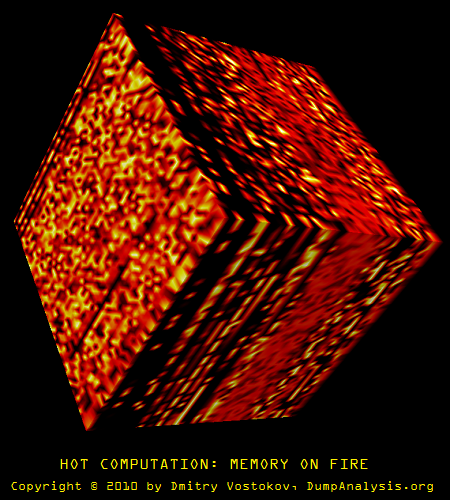
Back cover features memory space art image Hot Computation: Memory on Fire.
- Dmitry Vostokov @ DumpAnalysis.org + TraceAnalysis.org -
Posted in Aesthetics of Memory Dumps, Announcements, Archaeology of Computer Memory, Art, Assembly Language, Books, C and C++, CDF Analysis Tips and Tricks, Categorical Debugging, Common Mistakes, Complete Memory Dump Analysis, Computer Science, Crash Analysis Report Environment (CARE), Crash Dump Analysis, Crash Dump De-analysis, Crash Dump Patterns, Debugging, Debugging Methodology, Debugging Slang, Deep Down C++, Dr. Watson, Dublin School of Security, Education and Research, Escalation Engineering, Fun with Crash Dumps, Fun with Debugging, Fun with Software Traces, General Memory Analysis, Hermeneutics of Memory Dumps and Traces, Images of Computer Memory, Kernel Development, Malware Analysis, Malware Patterns, Mathematics of Debugging, Memiotics (Memory Semiotics), Memoidealism, Memoretics, Memory Analysis Culture, Memory Analysis Forensics and Intelligence, Memory Analysis Report System, Memory Diagrams, Memory Dreams, Memory Dump Analysis Jobs, Memory Dump Analysis Services, Memory Dump Analysis and History, Memory Dumps in Movies, Memory Dumps in Myths, Memory Religion (Memorianity), Memory Space Art, Memory Systems Language, Memory Visualization, Memory and Glitches, Memuonics, Metaphysical Society of Ireland, Minidump Analysis, Movies and Debugging, Multithreading, Museum of Debugging, Music for Debugging, Music of Computation, New Acronyms, New Words, Paleo-debugging, Pattern Models, Pattern Prediction, Philosophy, Physicalist Art, Psychoanalysis of Software Maintenance and Support, Publishing, Science of Memory Dump Analysis, Science of Software Tracing, Security, Software Architecture, Software Behavior Patterns, Software Chorography, Software Chorology, Software Defect Construction, Software Engineering, Software Generalist, Software Maintenance Institute, Software Narratology, Software Technical Support, Software Trace Analysis, Software Trace Analysis and History, Software Trace Deconstruction, Software Trace Reading, Software Trace Visualization, Software Tracing for Dummies, Software Troubleshooting Patterns, Software Victimology, Stack Trace Collection, Structural Memory Analysis and Social Sciences, Structural Memory Patterns, Structural Trace Patterns, Systems Thinking, Testing, Theology, Tool Objects, Tools, Trace Analysis Patterns, Training and Seminars, Troubleshooting Methodology, Uses of UML, Victimware, Virtualization, Vista, Visual Dump Analysis, Webinars, WinDbg Scripts, WinDbg Tips and Tricks, WinDbg for GDB Users, Windows 7, Windows Server 2008, Windows System Administration, Workaround Patterns, x64 Windows | No Comments »
Saturday, November 6th, 2010
I’m pleased to announce that MDAA, Volume 4 is available in PDF format:
www.dumpanalysis.org/Memory+Dump+Analysis+Anthology+Volume+4
It features:
- 15 new crash dump analysis patterns
- 13 new pattern interaction case studies
- 10 new trace analysis patterns
- 6 new Debugware patterns and case study
- Workaround patterns
- Updated checklist
- Fully cross-referenced with Volume 1, Volume 2 and Volume 3
- Memory visualization tutorials
- Memory space art
Its table of contents is available here:
http://www.dumpanalysis.org/MDAA/MDA-Anthology-V4-TOC.pdf
Paperback and hardcover versions should be available in a week or two. I also started working on Volume 5 that should be available in December.
- Dmitry Vostokov @ DumpAnalysis.org + TraceAnalysis.org -
Posted in .NET Debugging, Aesthetics of Memory Dumps, Announcements, AntiPatterns, Art, Assembly Language, Books, C and C++, CDF Analysis Tips and Tricks, Categorical Debugging, Common Mistakes, Complete Memory Dump Analysis, Computer Science, Countefactual Debugging, Crash Dump Analysis, Crash Dump Patterns, DebugWare Patterns, Debugging, Debugging Slang, Deep Down C++, Education and Research, Escalation Engineering, Fun with Crash Dumps, Fun with Debugging, Images of Computer Memory, Kernel Development, Memiotics (Memory Semiotics), Memoidealism, Memoretics, Memory Space Art, Memory Visualization, Memuonics, Metaphysics of Memory Worldview, Multithreading, Opcodism, Philosophy, Physicalist Art, Publishing, Science Fiction, Science of Memory Dump Analysis, Science of Software Tracing, Security, Software Architecture, Software Behavior Patterns, Software Defect Construction, Software Engineering, Software Narratology, Software Technical Support, Software Trace Analysis, Software Trace Reading, Software Victimology, Stack Trace Collection, Testing, Tools, Trace Analysis Patterns, Troubleshooting Methodology, Uses of UML, Victimware, Virtualization, Vista, Visual Dump Analysis, WinDbg Scripts, WinDbg Tips and Tricks, Windows 7, Windows Server 2008, Windows System Administration, Workaround Patterns, x64 Windows | No Comments »
Wednesday, October 13th, 2010
In addition to software narratology we would like to introduce another 2 branches of memoretics (borrowed from “geographical” chorography and chorology), the science of memory snapshots:
Software Chorography
The study and visualization of small memory regions compared to the full memory dumps.
Software Chorology
The spacial equivalent of software narratology where the latter is considered in chronological terms. Studies spatial distribution and causal relations between software behavioral and structural phenomena inside particular memory regions.
To give a perspective where usual software traces and memory dumps reside in terms narrativity and non-narrativity (spatiality) we created this diagram:
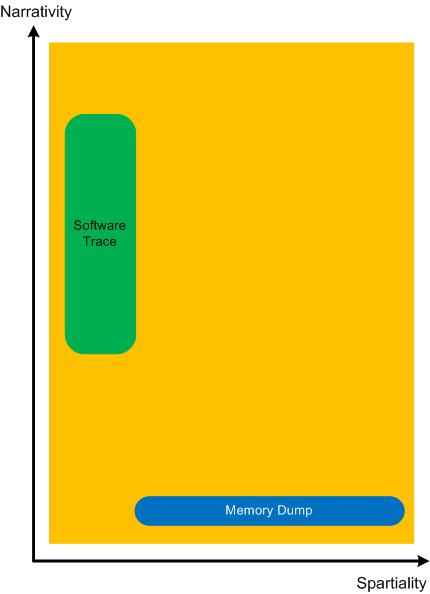
Memory dumps have some extension in the dimension of narrativity because it is possible to get stack traces and other execution residue from them that provide partial fragments of a software narrative.
- Dmitry Vostokov @ DumpAnalysis.org + TraceAnalysis.org -
Posted in Memoretics, Memory Visualization, Software Chorography, Software Chorology, Software Narratology | No Comments »
Thursday, September 30th, 2010
While browsing architecture books on Amazon I found one with a glitch when you use look inside feature (at the time of this writing):
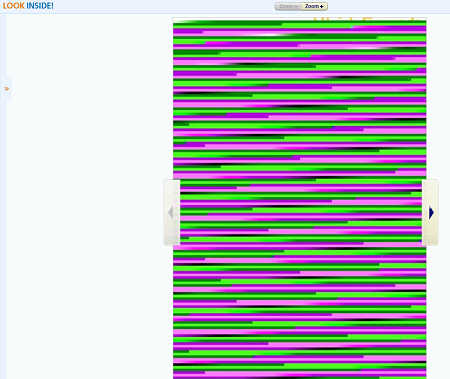
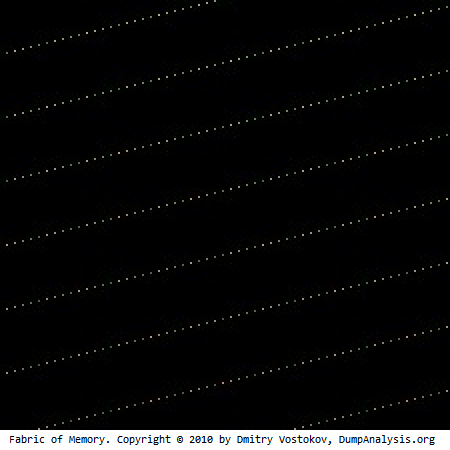
All this reminds me of fragments I see in naturally visualized computer memory that prompts me to conjecture that most all (if not all) computer glitches stem from memory restructuring (a postmodern term for memory corruption).
The book with search inside glitch: Programs and Manifestoes on 20th-Century Architecture

- Dmitry Vostokov @ DumpAnalysis.org + TraceAnalysis.org -
Posted in Aesthetics of Memory Dumps, Art, Fun with Crash Dumps, Memory Space Art, Memory Visualization, Memory and Glitches | No Comments »
Thursday, September 23rd, 2010
When I was a child I experienced dreams where I was carried by a huge wave that was transforming to a torus completely absorbing me up to a breakpoint of my wake up. A year ago I got the book Memory Evolutive Systems because of my interest in applying category theory to memory analysis and debugging and immediately recalled my long-time forgotten childhood dreams while staring at its front cover:

- Dmitry Vostokov @ DumpAnalysis.org + TraceAnalysis.org -
Posted in Books, Categorical Debugging, History, Mathematics, Memoretics, Memory Dreams, Memory Visualization, Science of Memory Dump Analysis | No Comments »
Wednesday, September 1st, 2010
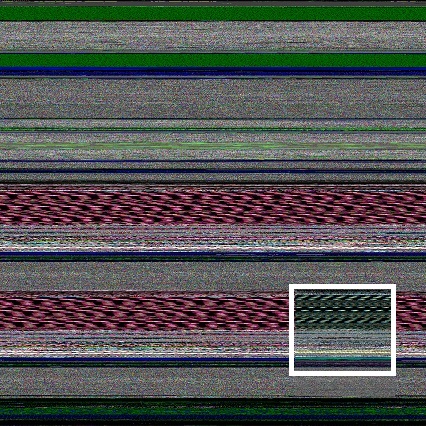
If you attended Fundamentals of Complete Crash and Hang Memory Dump Analysis you probably remember the memory dump visualization question that I repeat here on this slide fragment:
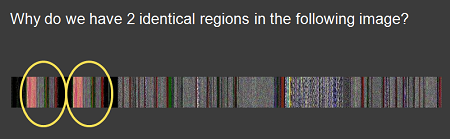
I got a few responses:
“Unfortunately they are not identical - visual inspection shows that. I tried differencing the relevant sub-images in Photoshop and I can’t get zero. Of course this can be due to compression artifacts and, more likely, the fact that the duplication is not required to be aligned to the borders. A stronger confirmation/refutation would require unrolling the bitmap to one dimension and sliding it back and forth until maximum correlation is found. Since I have not done the examples step by step, I am left guessing about just what the dump you show illustrates. An aliased memory mapped area is my first guess, and a flip/flop garbage collector is my second.”
“perhaps some module such as a .NET assembly is getting loaded twice in a .NET app, pre .NET 4, such as is dicsussed in this thread:
http://forum.sysinternals.com/why-some-net-assemblies-are-duplicated-in-memory_topic15279_post121591.html“
Initially I also thought that there was the same module loaded twice from different location like in Duplicated Module pattern. Unfortunately lm command didn’t show any duplicated loaded and unloaded modules as well as any hidden modules. So I looked at address information and found two identical relatively large regions at the beginning:
0:000> !address

[...]

BaseAddress EndAddress+1 RegionSize Type       State      Protect       Usage

[...]

0`00470000  0`007f0000   0`00380000 MEM_MAPPED MEM_COMMIT PAGE_READONLY <unclassified>

[…]

0`01f10000  0`02290000   0`00380000 MEM_MAPPED MEM_COMMIT PAGE_READONLY <unclassified>

[…]
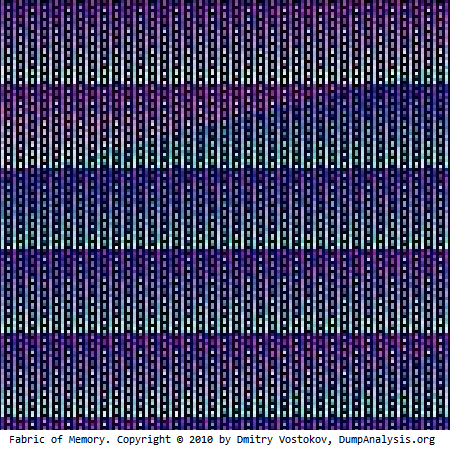
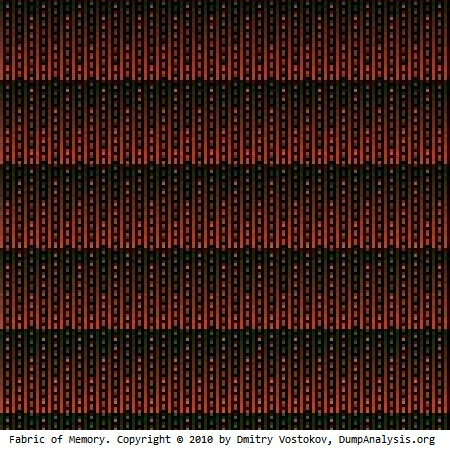
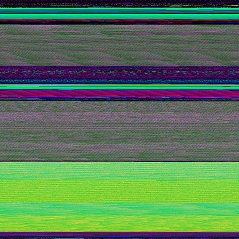
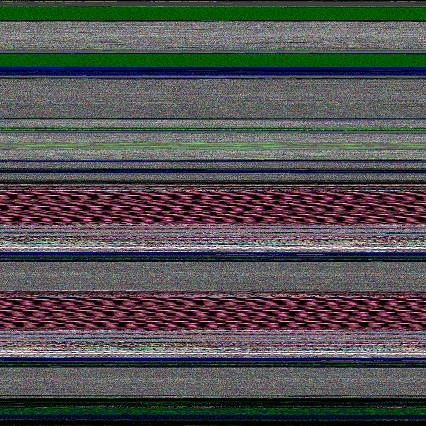
The image above was scaled by ImageMagic from a bitmap generated by Dump2Picture:
The original image from Dump2Picture had different colors:
I quickly checked the colorimetric structure of those regions: 0`00470000 0`007f0000 and 0`01f10000 0`02290000 using MemPicture WinDbg script and they seem to conform with the magnified picture above:
0:000> $$>a< d:\Dump2Picture\mempicture.txt 0`00470000 L?0`007f0000-0`00470000

Writing 380000 bytes
C:\Program Files\Debugging Tools for Windows (x64)>dump2picture d2p-range.bin d2p-range.bmp
Dump2Picture version 1.1

Written by Dmitry Vostokov, 2007
d2p-range.bmp

d2p-range.bin

        1 file(s) copied.
C:\Program Files\Debugging Tools for Windows (x64)>d2p-range.bmp

.shell: Process exited
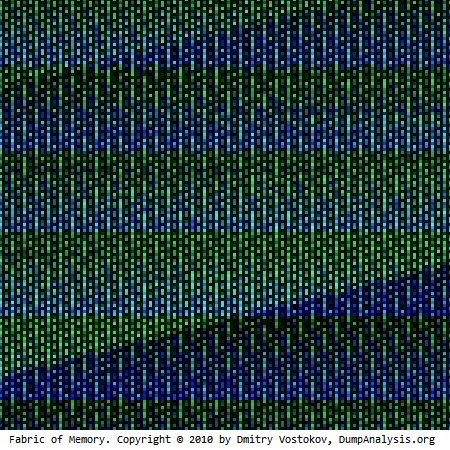
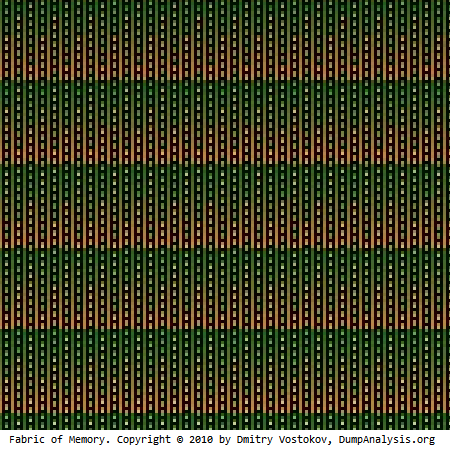
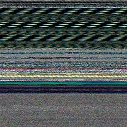
Here is the magnified slice from the original picture:
We see the same partitioning if we juxtapose the original picture and the picture of the address region:
Also these regions are completely identical if we compare their data:
0:000> c 0`00470000 L?(0`007f0000-0`00470000)/8 0`01f10000
So it looks like some file was mapped twice. Inspected via dc command it shows remarkable regularity not seen in executable modules. This regularity also manifests itself in color:
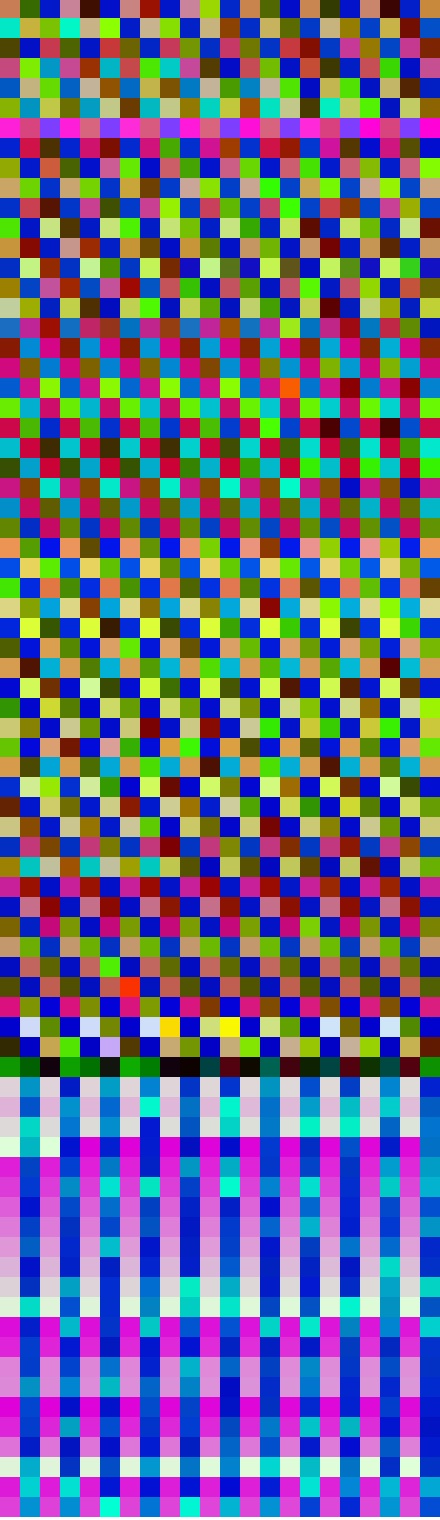
In order to verify I modeled this by writing a simple program that maps a file twice passed as a command line parameter:
int _tmain(int argc, _TCHAR* argv[])

{

 if (argc < 2)

 {

  puts("Usage: MappedFiles.exe <File_Name_To_Map>\n");

  return -1;

 }
 HANDLE hf = CreateFile(argv[1], GENERIC_READ, FILE_SHARE_READ, NULL, OPEN_EXISTING, FILE_ATTRIBUTE_NORMAL, NULL);

 HANDLE hm = CreateFileMapping(hf, NULL, PAGE_READONLY, 0, 0, NULL);

 MapViewOfFile(hm, FILE_MAP_READ, 0, 0, 0);
 hf = CreateFile(argv[1], GENERIC_READ, FILE_SHARE_READ, NULL, OPEN_EXISTING, FILE_ATTRIBUTE_NORMAL, NULL);

 hm = CreateFileMapping(hf, NULL, PAGE_READONLY, 0, 0, NULL);

 MapViewOfFile(hm, FILE_MAP_READ, 0, 0, 0);
 DebugBreak();

 return 0;

}
I ran it and chose to map explorer.exe because it was a sufficiently large image file:
C:\MappedFiles\Release>MappedFiles.exe c:\windows\explorer.exe
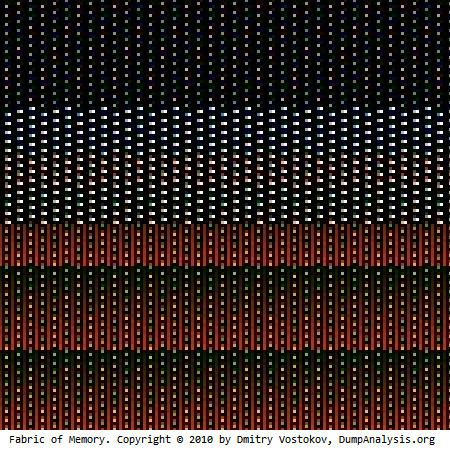
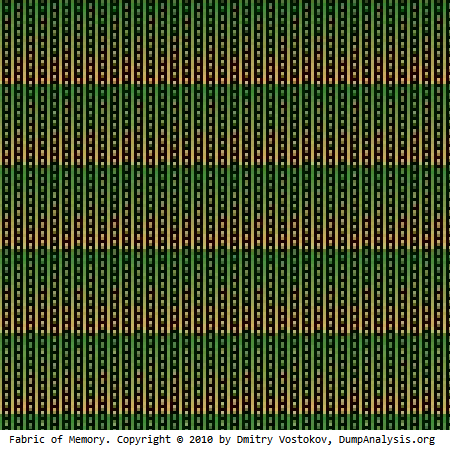
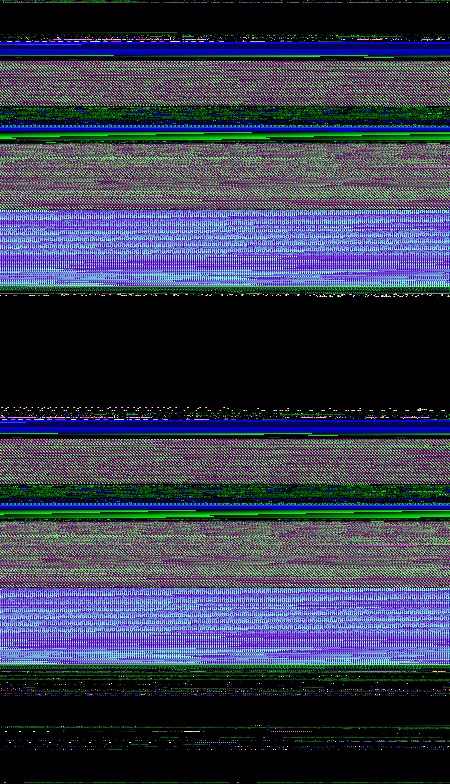
The dump file was saved and its processing shows this picture:
We clearly see identical regions and double check them from the dump file:
0:000> !address

BaseAddr EndAddr+1 RgnSize Type       State         Protect       Usage

[...]

a60000   d1d000    2bd000  MEM_MAPPED MEM_COMMIT    PAGE_READONLY <unclassified>

d1d000   d20000    3000    MEM_FREE   PAGE_NOACCESS Free

d20000   fdd000    2bd000  MEM_MAPPED MEM_COMMIT    PAGE_READONLY <unclassified>

[…]
0:000> $$>a< d:\Dump2Picture\mempicture.txt 0`00470000 L?0`007f0000-0`00470000

Writing 380000 bytes
C:\Program Files\Debugging Tools for Windows (x64)>dump2picture d2p-range.bin d2p-range.bmp
Dump2Picture version 1.1

Written by Dmitry Vostokov, 2007
d2p-range.bmp

d2p-range.bin

        1 file(s) copied.
C:\Program Files\Debugging Tools for Windows (x64)>d2p-range.bmp

.shell: Process exited
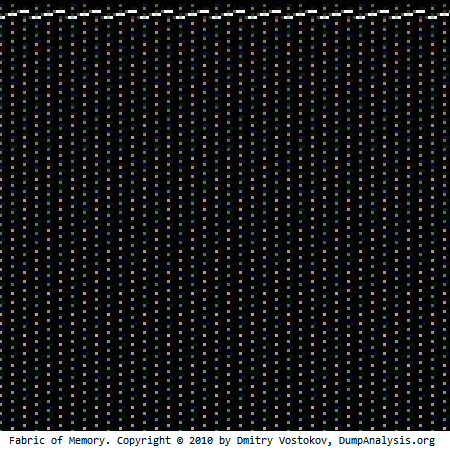
We see the same partitioning if we juxtapose results:
The application can be downloaded from here: MappedFiles.zip
- Dmitry Vostokov @ DumpAnalysis.org + TraceAnalysis.org -
Posted in Aesthetics of Memory Dumps, Crash Dump Analysis, Crash Dump Patterns, Memory Visualization, Webinars | No Comments »
Monday, August 30th, 2010
Just noticed this little book and ordered it to browse and write a review later Glitch: Designing Imperfection

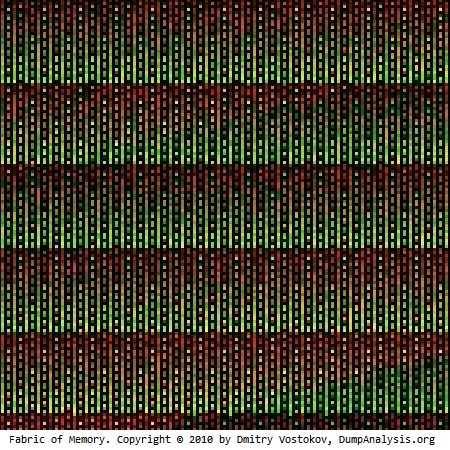
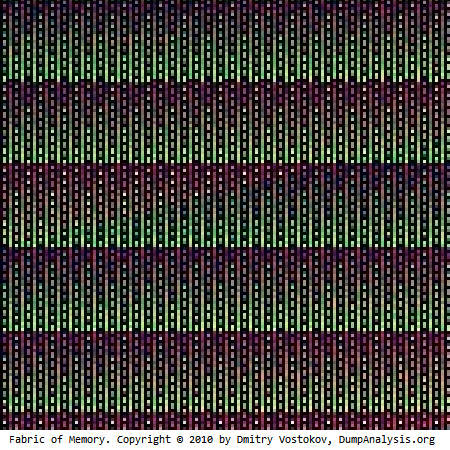
Notice the patterns with glitches on the cover similar to the fabric of memory and some pictures from inside remind me natural memory visualization images you can find in the print form in DLL List Landscape: The Art from Computer Memory Space book. I would therefore welcome the fact that the memory space art has more and more followers (and becomes the true art movement according to the institutional theory of art). There are more art books coming later this year:
Patterns of Computer Memory (ISBN: 978-1906717711)
Spikes, Hangs, Crashes, Leaks and Dumps of Imagination: The Art of the Debugging Art (ISBN: 978-1906717841)
Also the museum of debugging and memory dumps will hold an exhibition soon.
In a few days the following book about glitches (as negative business impact annoyances) will be released:
Glitch: The Hidden Impact of Faulty Software

“Search inside the book” on Amazon suggests that the latter book doesn’t consider the positive impact of glitches including art but, anyway, because of my speciality in software debugging and maintenance I would like to review that book too.
- Dmitry Vostokov @ DumpAnalysis.org + TraceAnalysis.org -
Posted in Art, Books, Memory Space Art, Memory Visualization | No Comments »
Wednesday, August 11th, 2010
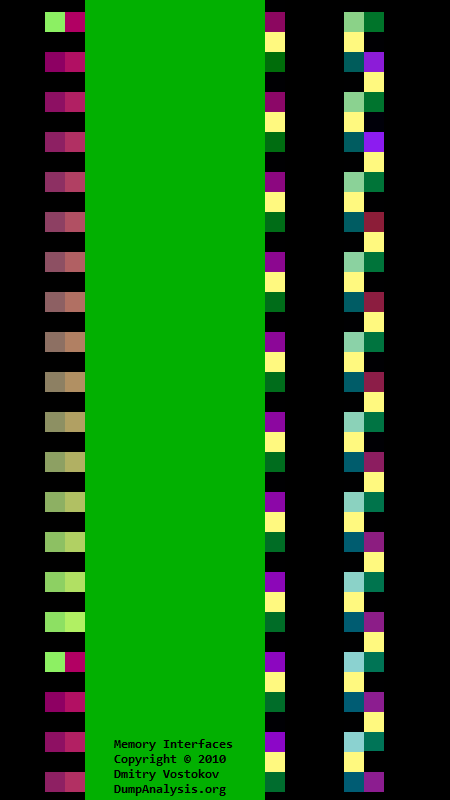
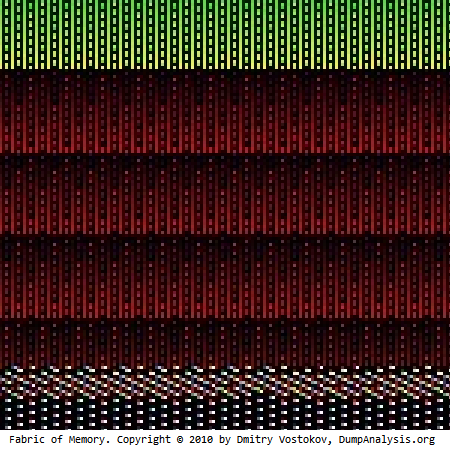
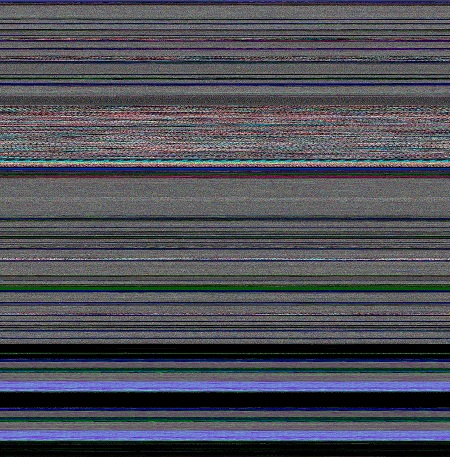
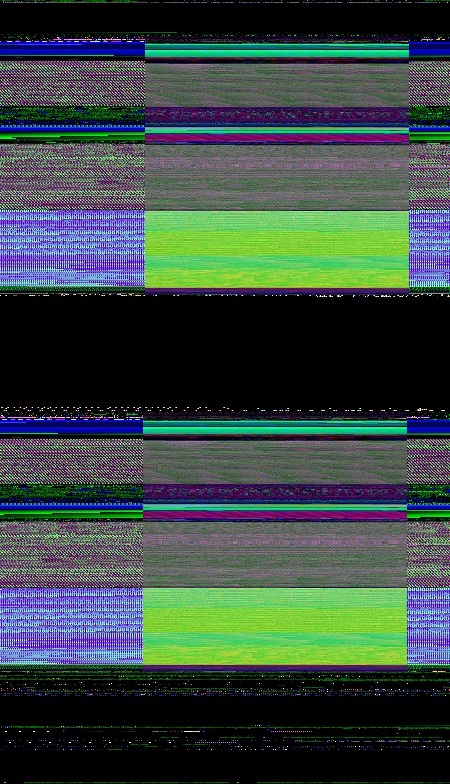
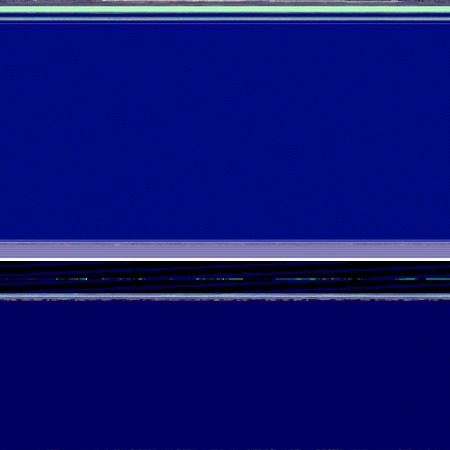
There are many different approaches to illustrate virtual to physical memory mapping on systems with paging like Windows. Here is another approach that uses natural memory visualization. An image of a user process was generated and juxtaposed to an image of kernel memory dump generated afterwards to produce the combined picture of the full virtual space. Of course, uncommited regions were not included in it as they were not present in user and kernel dumps. Then, after reboot, the same application was launched again and an image of a complete memory dump was generated. Finally, both images were juxtaposed to produce this approximate picture:
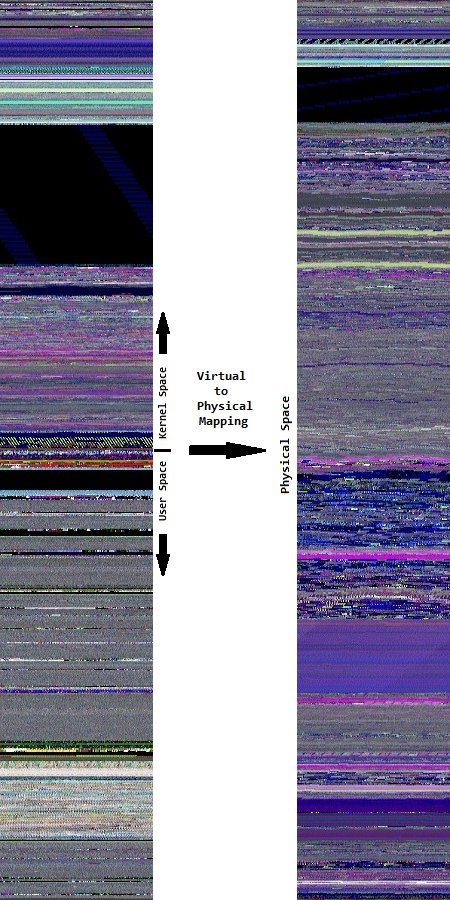
In the virtual memory space to the left we see much more granularity. On the contrary, the physical memory space to the right is more uniform and has a different coloring.
- Dmitry Vostokov @ DumpAnalysis.org + TraceAnalysis.org -
Posted in Computer Science, Fun with Crash Dumps, Memoretics, Memory Diagrams, Memory Space Art, Memory Visualization, Science of Memory Dump Analysis, Training and Seminars | No Comments »
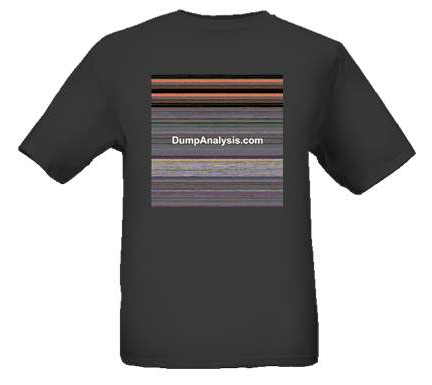
Saturday, July 31st, 2010
Started testing marketing materials to increase Dublin people awareness of memory dump analysis. Here are the first exemplars of what I’m going to wear by the end of this week while commuting and in local pubs 

- Dmitry Vostokov @ DumpAnalysis.org + TraceAnalysis.org -
Posted in Announcements, Crash Dump Analysis, Debugging, Fun with Crash Dumps, Memory Dump Analysis Services, Memory Visualization, Training and Seminars | No Comments »
Tuesday, July 27th, 2010
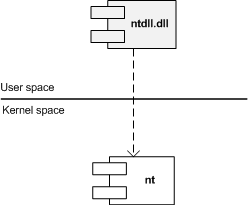
Similar to different C/C++ styles like where to put the right brace we have User/Kernel Space/Mode architecture diagramming styles. Some prefer to put User part on top (Windows Internals team) and some prefer to put Kernel on top (like me). Marc Sherman in the comment here explains the former style as “calling down into the kernel”. Originally I thought about a psychological explanation where you put on top what you value the most or use the most. However, the reason I put Kernel on top is because I value Space over Mode in depicting memory and dependencies. In stack traces from complete memory dumps you have kernel portions on top as well. Also Google and Bing favour “stack grows down” slightly over “stack grows up” and I prefer “down” as well. Additionally, if you value User on top you would be forced to put Managed on top as well. If you put Kernel on top than Managed is at the bottom like on this flag that became a logo of Memory Dump Analysis Services. So here are two diagrams where I prefer the first (Kernel on top) with any stack growing down (in address decrement sense) and any stack trace from WinDbg having Kernel on top too:
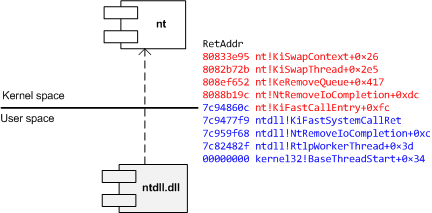
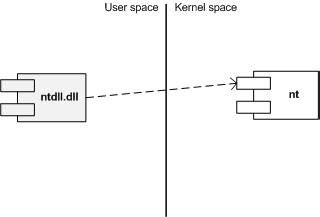
The second diagram has any stack growing up:
I also suggest this variant (but people who write and read from right to left may prefer its reflection):
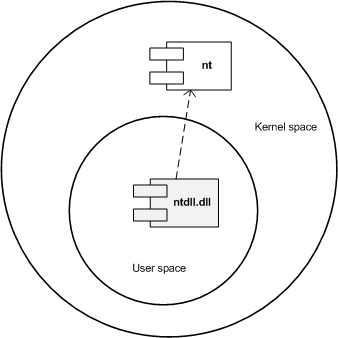
Another diagram style that is consistent with the traditional depiction of Privilege Mode rings (here Kernel is also on top but can be put in any direction):
What style do you favour? Please let me know.
- Dmitry Vostokov @ DumpAnalysis.org + TraceAnalysis.org -
Posted in Memory Diagrams, Memory Visualization, Pattern Icons, Software Architecture, Training and Seminars, Visual Dump Analysis | 2 Comments »
Sunday, July 18th, 2010
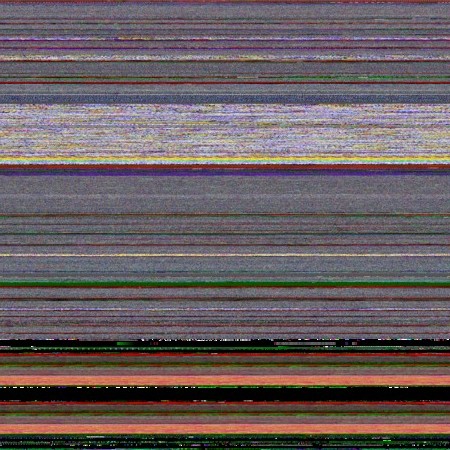
Yes, it can. Here’s the Dump2Picture image of a kernel memory dump (3 GB) from a 128 GB system:
Now it’s time to listen to Klaus Schulze album In Blue again.

- Dmitry Vostokov @ DumpAnalysis.org + TraceAnalysis.org -
Posted in Aesthetics of Memory Dumps, Fun with Crash Dumps, Images of Computer Memory, Memory Visualization, Music for Debugging | No Comments »