New TestDefaultDebugger Tool
It often happens that Citrix support advises customers to change their default postmortem debugger to NTSD. But there is no way to test new settings unless some application crashes again. And some customers come back saying dumps are not saved despite new settings and we don’t know whether dumps were not saved because a crash hadn’t yet happened or default debugger hadn’t been configured properly or something else happened.
In addition the arrival of 64-bit Windows brings another problem: there are 2 default postmortem debuggers on 64-bit Windows (for 32-bit and 64-bit applications respectively):
The new tool TestDefaultDebugger forces a crash on itself to test the presence and configuration of default postmortem debugger (Dr. Watson, NTSD or other). Then if the default postmortem debugger is configured properly OS will launch it to save a dump of TestDefaultDebugger.exe process.
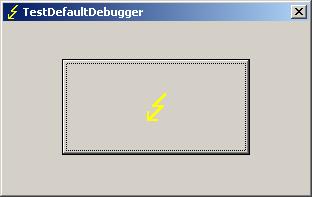
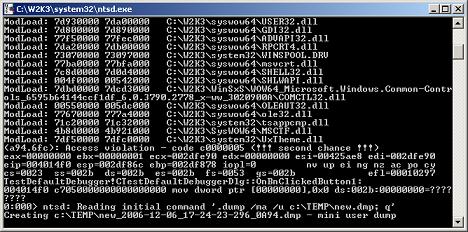
If you enabled NTSD as a default postmortem debugger (CTX105888) the following console window will briefly appear:
Postmortem debuggers are explained here:
On 64-bit Windows you can run both 32-bit TestDefaultDebugger.exe and 64-bit TestDefaultDebugger64.exe applications and then open crash dumps to see whether both postmortem debuggers have been configured properly. The tool has also command line interface so you can use it remotely:
c:\>TestDefaultDebugger.exe now
You can download the tool from Citrix support web site:
TestDefaultDebugger v1.0 for 32-bit and 64-bit platforms
- Dmitry Vostokov @ DumpAnalysis.org -
November 7th, 2008 at 4:25 pm
[…] process displaying a message box with “error” in its title. Here is an example using TestDefaultDebugger64 to simulate an application fault message where the following instance of CtxHideEx32 was setup to […]
February 4th, 2010 at 11:52 pm
[…] So I created two “Time Arrow” diagrams aiming to depict two exception scenarios using TestDefaultDebugger tool and the following simplified commands on x64 W2K3 […]
February 27th, 2010 at 2:50 am
[…] a filtering example I used TestDefaultDebugger64 to generate a process user memory dump. It was converted to a BMP file by […]
April 13th, 2010 at 2:06 pm
[…] cr(a)ushed. When I saw the title of a book “Tender Buttons” I immediately recalled TestDefaultDebugger and similar programs. Apartment is from COM […]