Archive for the ‘Announcements’ Category
Wednesday, September 15th, 2010
The first annual competition was held between 7/7/2010 and 8/8/2010 and the following winners were selected (in alphabetical order):
- Tavis Ormandy
nominated for “windows” story:
https://docs.google.com/View?id=dfqd62nk_228h28szgz
- Andrey Permamedov
selected entries from “Diary of war with bugs”:
http://bugswar.blogspot.com/
- Sathish Venkataraman
sent the tough enterprise debugging story:
to be published in the next issue of Debugged! magazine
All winners will get 3 volumes of Memory Dump Analysis Anthology + Color Supplement all signed by the author.
- Dmitry Vostokov @ DumpAnalysis.org + TraceAnalysis.org -
Posted in Announcements, Competitions and Awards, Debugging | No Comments »
Friday, September 3rd, 2010
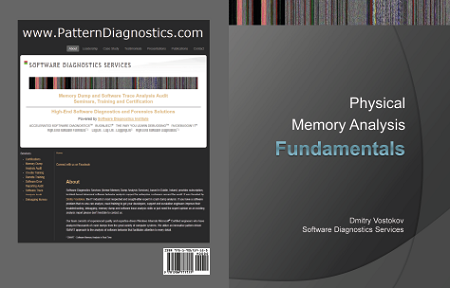
This forthcoming full color book is the complete transcript of a Webinar organized by Memory Dump Analysis Services (www.DumpAnalysis.com).
It discusses user vs. kernel vs. physical (complete) memory space, challenges of complete memory dump analysis, common WinDbg commands, patterns and pattern-driven analysis methodology, common mistakes, fiber bundles, DumpAnalysis.org case studies and illustrates step by step a hands-on exercise in a complete memory dump analysis.
- Title: Fundamentals of Complete Crash and Hang Memory Dump Analysis
- Author: Dmitry Vostokov
- Publisher: OpenTask (October 2010)
- Language: English
- Product Dimensions: 28.0 x 21.6
- Paperback: 48 pages
- ISBN-13: 978-1906717155
- Dmitry Vostokov @ DumpAnalysis.org + TraceAnalysis.org -
Posted in Announcements, Assembly Language, Books, Common Mistakes, Complete Memory Dump Analysis, Crash Analysis Report Environment (CARE), Crash Dump Analysis, Crash Dump Patterns, Debugging, Escalation Engineering, Software Technical Support, Stack Trace Collection, Tools, Training and Seminars, Webinars, WinDbg Tips and Tricks, Windows 7, Windows Server 2008, x64 Windows | No Comments »
Tuesday, August 31st, 2010
Finally I compiled a Questions and Answers page with all necessary links and examples during the weekend:
http://www.dumpanalysis.com/FCMDA-Q-A
I also added text versions of logs (in addition to zip files) to a Webinar materials page:
http://www.dumpanalysis.com/FCMDA-materials
- Dmitry Vostokov @ DumpAnalysis.org + TraceAnalysis.org -
Posted in Announcements, Complete Memory Dump Analysis, Crash Dump Analysis, Crash Dump Patterns, Debugging, Escalation Engineering, Software Technical Support, Training and Seminars, Webinars | No Comments »
Monday, August 23rd, 2010
The presentation materials from the webinar (18th and 23rd of August, 2010) are available for download:
http://www.dumpanalysis.com/FCMDA-materials
Thanks to everyone who registered and attended!
- Dmitry Vostokov @ DumpAnalysis.org + TraceAnalysis.org -
Posted in Announcements, Complete Memory Dump Analysis, Crash Dump Analysis, Crash Dump Patterns, Escalation Engineering, Software Technical Support, Training and Seminars, Webinars | 1 Comment »
Wednesday, August 18th, 2010
Do to the attendee limit not all registered for the first session were able to attend. The second session is available:
Date: 23rd of August 2010
Time: 19:00 (BST) 14:00 (Eastern) 11:00 (Pacific)
Duration: 90 minutes
Space is limited.
Reserve your Webinar seat now at:
https://www1.gotomeeting.com/register/823155577
After the second session webinar slides will be published and later a Q&A page will be compiled.
- Dmitry Vostokov @ DumpAnalysis.org + TraceAnalysis.org -
Posted in Announcements, Complete Memory Dump Analysis, Crash Dump Analysis, Memory Dump Analysis Services, Training and Seminars, Webinars | 1 Comment »
Saturday, August 14th, 2010
Today I celebrated 4 years of blogging that resulted in more than 2,000 posts across 8 blogs. I would like to thank everyone for their continuing support!
The updated timeline
This blog post belongs to the 5th year of blogging.
- Dmitry Vostokov @ DumpAnalysis.org + TraceAnalysis.org -
Posted in Announcements, Crash Dump Analysis, Debugging, History, Publishing, Software Trace Analysis | 2 Comments »
Saturday, July 31st, 2010
Started testing marketing materials to increase Dublin people awareness of memory dump analysis. Here are the first exemplars of what I’m going to wear by the end of this week while commuting and in local pubs 


- Dmitry Vostokov @ DumpAnalysis.org + TraceAnalysis.org -
Posted in Announcements, Crash Dump Analysis, Debugging, Fun with Crash Dumps, Memory Dump Analysis Services, Memory Visualization, Training and Seminars | No Comments »
Thursday, July 22nd, 2010
I’m pleased to announce that my book Windows Debugging: Practical Foundations is available on Amazon Kindle platform. It has been reformatted and edited to make it fit into the smallest Kindle device and pictures were specifically tailored to improve their viewing experience. The price has dropped to $9.99 (excluding possible VAT and international delivery if any). Please let me know if you have any problems with the content and I make any changes as soon as possible.
Windows Debugging: Practical Foundations (Kindle Edition)


- Dmitry Vostokov @ DumpAnalysis.org + TraceAnalysis.org -
Posted in Announcements, Books, Debugging, Kindle Platform, Publishing | No Comments »
Sunday, July 18th, 2010

Memory Dump Analysis Services (DumpAnalysis.com) organizes a free webinar
Date: 18th of August 2010
Time: 21:00 (BST) 16:00 (Eastern) 13:00 (Pacific)
Duration: 90 minutes
Topics include:
- User vs. kernel vs. physical (complete) memory space
- Challenges of complete memory dump analysis
- Common WinDbg commands
- Patterns
- Common mistakes
- Fiber bundles
- Hands-on exercise: a complete memory dump analysis
- A guide to DumpAnalysis.org case studies
Prerequisites: working knowledge of basic user process and kernel memory dump analysis or live debugging using WinDbg
The webinar link will be posted before 18th of August on DumpAnalysis.com
- Dmitry Vostokov @ DumpAnalysis.org + TraceAnalysis.org -
Posted in Announcements, Common Mistakes, Common Questions, Complete Memory Dump Analysis, Crash Dump Analysis, Crash Dump Patterns, Debugging, Escalation Engineering, Memory Dump Analysis Services, Pattern Models, Security, Software Architecture, Software Behavior Patterns, Software Defect Construction, Software Engineering, Software Technical Support, Stack Trace Collection, Testing, Tools, Training and Seminars, Troubleshooting Methodology, Virtualization, Vista, Webinars, WinDbg Scripts, WinDbg Tips and Tricks, Windows 7, Windows Server 2008, Windows System Administration, x64 Windows | 1 Comment »
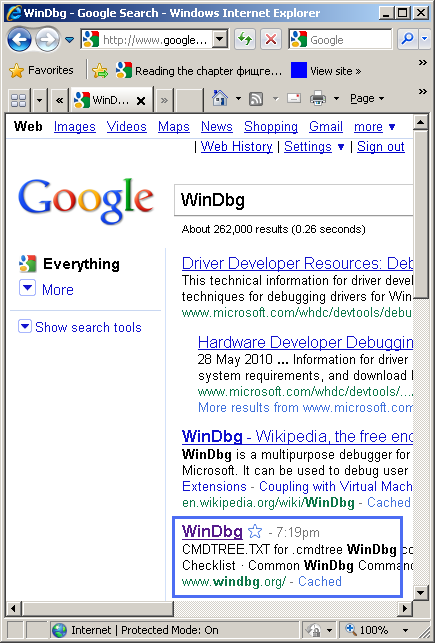
Tuesday, July 13th, 2010
After the previous announcement of WinDbg.org 3rd ranging place I see it moved to the 2nd first level ranking leaving Wikipedia behind. I think it would be impossible to go ahead of WHDC so I calm down and continue to monitor ranking from time to time only :-)
- Dmitry Vostokov @ DumpAnalysis.org + TraceAnalysis.org -
Posted in Announcements, History | 3 Comments »
Sunday, July 11th, 2010
Our future sponsor has been registered in Ireland and has its own independent website and logo: DumpAnalysis.com

More information will be available later this month.
- Dmitry Vostokov @ DumpAnalysis.org + TraceAnalysis.org -
Posted in Announcements, Crash Analysis Report Environment (CARE), Crash Dump Analysis, Crash Dump De-analysis, Debugging, Education and Research, Escalation Engineering, Hardware, Kernel Development, Linux Crash Corner, Mac Crash Corner, Memory Analysis Forensics and Intelligence, Memory Dump Analysis Services, Minidump Analysis, Security, Software Engineering, Software Technical Support, Software Trace Analysis, Testing, Tools, Training and Seminars, Vista, Windows 7, Windows Server 2008, Windows System Administration, x64 Windows | No Comments »
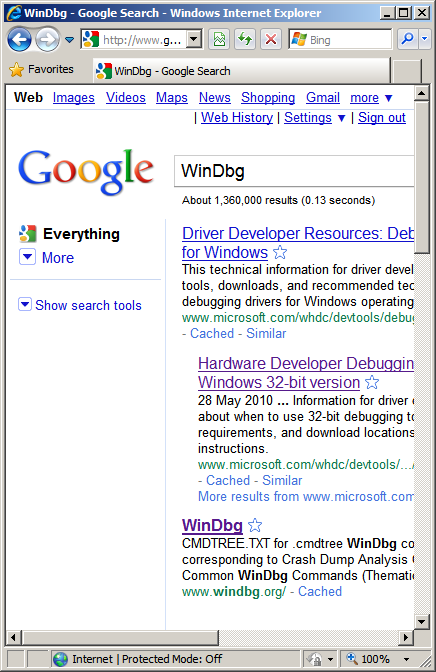
Saturday, July 10th, 2010
More than 2 years ago I set up WinDbg.org domain to test how quickly I could move up in Google ranking if I search for “WinDbg”. Today I noticed the great progress despite the fact that it is difficult to beat Microsoft and Wikipedia in search ranking As you can see from the screenshot below it achieved the 3rd position in the 1st level ranking:
- Dmitry Vostokov @ DumpAnalysis.org + TraceAnalysis.org -
Posted in Announcements, History | 1 Comment »
Saturday, July 10th, 2010
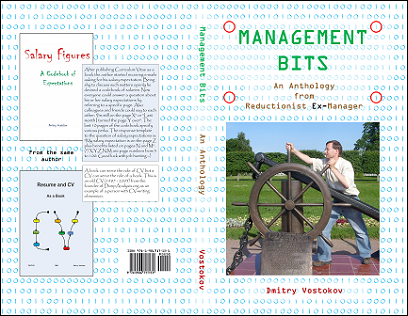
Being a software engineer, the author penetrated a software technical support department of a major software company rising to a management position. There he started collecting various management bits and tips promising everyone to write a management book. After moving back to engineering he became a director of several software research, education, publishing and software behavior analysis consultancy institutions including a museum. This book is an anthology of selected and edited blog posts from his Management Bits and Tips blog.
What this book has to do with the crash dump analysis then? Considering metaphorically an organization as a software machine, teams as processes and individuals as threads the author had applied his unique knowledge of software crashes and hangs to organizational project failures.
- Title: Management Bits: An Anthology from Reductionist Manager
- Author: Dmitry Vostokov
- Publisher: OpenTask (September 2010)
- Language: English
- Product Dimensions: 19.8 x 12.9
- Paperback: 100 pages
- ISBN-13: 978-1906717131
- Dmitry Vostokov @ DumpAnalysis.org + TraceAnalysis.org -
Posted in Announcements, Books, Crash Dump Analysis, Crash Dump Patterns, Escalation Engineering, Fun with Crash Dumps, Management Bits and Tips, Publishing, Software Engineering, Software Technical Support | No Comments »
Wednesday, July 7th, 2010
The rules of the previously announced competition have been changed. You can now also nominate someone by sending a debugging story link. Please send your story or a nomination using this page: http://www.dumpanalysis.org/contact or dmitry dot vostokov at dumpanalysis dot org (if a story is with pictures).

- Dmitry Vostokov @ DumpAnalysis.org + TraceAnalysis.org -
Posted in Announcements, Competitions and Awards, Crash Dump Analysis, Debugging, Escalation Engineering, Security, Software Engineering, Software Technical Support | No Comments »
Wednesday, June 23rd, 2010
Looks like reading Darwin biography influenced me in the direction of founding a museum. So I did and here’s its draft logo:

This multi-dimensional museum will show exhibitions dedicated to the history of debugging, memory dump artifacts and art. Stay tuned. The first exhibition opens very soon.
If you would like to donate an exhibit (for example, an old memory dump or a picture related to debugging) please use this page: http://www.dumpanalysis.org/contact. Any donations are greatly appreciated!
- Dmitry Vostokov @ DumpAnalysis.org + TraceAnalysis.org -
Posted in Announcements, Crash Dump Analysis, Debugging, History, Memorian Art, Memory Analysis Culture, Memory Auralization, Memory Dumps in Movies, Memory Dumps in Myths, Memory Space Art, Memory Space Music, Memory Visualization, Movies and Debugging, Museum of Debugging, Opcodism, Paleo-debugging, Physicalist Art, Software Trace Visualization, Stack Trace Collection | 2 Comments »
Monday, June 21st, 2010
Mad about debugging? Join the annual competition by telling your Windows debugging story (*) after 7/7/2010 and before 8/8/2010 (**). The first prize is 3 volumes of Memory Dump Analysis Anthology + Color Supplement all signed by the author. There are also 2nd, 3rd, 4th and 5th level prizes.
Please send your story using this page: http://www.dumpanalysis.org/contact or dmitry dot vostokov at dumpanalysis dot org (if your story is formatted with pictures)
(*) DumpAnalysis.org reserves the right to publish your story (in a modified form if necessary) in OpenTask magazines and books with full credit.
(**) 7/7 and 8/8 are originally proposed Memory Analysts and Debuggers Days. Other proposed days are 7/8 and 8/7.
- Dmitry Vostokov @ DumpAnalysis.org + TraceAnalysis.org -
Posted in Announcements, Competitions and Awards, Crash Dump Analysis, Debugging | 1 Comment »
Wednesday, June 16th, 2010
Adding AI. Analysis Improvement.
After reading earlier today Windows Internals pages about system audit an idea came to my mind in the evening to provide audit services for memory dump and software trace analysis. One mind is good but two are better, especially if the second is a pattern-driven AI. Here are possible problem scenarios:
Problem: You are not satisfied with a crash report.
Problem: Your critical issue is escalated to the VP level. Engineers analyze memory dumps and software traces. No definite conclusion so far. You want to be sure that nothing has been omitted from the analysis.
Problem: You analyze a system dump or a software trace. You need a second pair of eyes but don’t want to send your memory dump due to your company security policies.
Other scenarios (use cases) will be added as soon as I see the service fit to the realities of software technical support.
I plan to make this service operational in July - August, 2010. Prices to be announced soon.
- Dmitry Vostokov @ DumpAnalysis.org + TraceAnalysis.org -
Posted in .NET Debugging, Announcements, Common Mistakes, Complete Memory Dump Analysis, Crash Analysis Report Environment (CARE), Crash Dump Analysis, Crash Dump De-analysis, Crash Dump Patterns, Debugging, Escalation Engineering, Minidump Analysis, Software Behavior Patterns, Software Engineering, Software Technical Support, Software Trace Analysis, Software Troubleshooting Patterns, Tools, Trace Analysis Patterns | 1 Comment »
Sunday, May 30th, 2010
Finally, after careful consideration, I’ve come up with the topic that has been neglected so far but at the same time important for both camps (kernel space and user space, including managed space): complete memory dump and software trace analysis. I plan to publish the first webinar agenda early in July and deliver the webinar in August (the date should be finalized by mid July).
PS. Sailing memory spaces under an RGB flag

- Dmitry Vostokov @ DumpAnalysis.org + TraceAnalysis.org -
Posted in Announcements, CDF Analysis Tips and Tricks, Crash Analysis Report Environment (CARE), Crash Dump Analysis, Crash Dump Patterns, Debugging, DumpAnalysis and TraceAnalysis Logos, Escalation Engineering, Software Behavior Patterns, Software Technical Support, Software Trace Analysis, Software Troubleshooting Patterns, Tools, Trace Analysis Patterns, Training and Seminars, WinDbg Scripts, WinDbg Tips and Tricks | 2 Comments »
Tuesday, May 25th, 2010
Finally Citrix has published a tool (written by my colleague Colm Naish, lead escalation engineer) that allows controlled injection of events into CDF (ETW) trace message stream. This is useful in many troubleshooting scenarios where we need to rely on Significant Event and Anchor Message analysis patterns to partition traces into artificial Activity Regions to start our analysis with. This is also analogous for the imposition of the external time on the stream of tracing events from software narratology perspective:
CDFMarker On Demand - For XenApp and XenDesktop
- Dmitry Vostokov @ DumpAnalysis.org + TraceAnalysis.org -
Posted in Announcements, CDF Analysis Tips and Tricks, Citrix, Debugging, Escalation Engineering, Software Engineering, Software Narratology, Software Technical Support, Software Trace Analysis, Software Trace Reading, Tools, Trace Analysis Patterns | 1 Comment »