NULL data pointer, stack trace, inline function optimization and platformorphic fault: pattern cooperation

July 27th, 2009

We have the following crash pointing to Driver.sys 

7: kd> KL
Child-SP          RetAddr           Call Site
fffffadd`7671a678 fffff800`0102e5f4 nt!KeBugCheckEx
fffffadd`7671a680 fffff800`0102d587 nt!KiBugCheckDispatch+0x74
fffffadd`7671a800 fffffadd`88e5dbf3 nt!KiPageFault+0x207
fffffadd`7671a998 fffffadd`88df63f5 Driver!memcpy+0×83
fffffadd`7671a9a0 fffffadd`88dfe97b Driver!ItemCopyTo+0×85

fffffadd`7671a9e0 fffffadd`88e45bd1 Driver!CallbackEx+0×3cb
fffffadd`7671aa80 fffffadd`88dfb130 Driver!Callback+0×131
fffffadd`7671ab90 fffffadd`88dfaef3 Driver!Reply+0×1a0
fffffadd`7671ac40 fffffadd`88de9e23 Driver!OnDataReceive+0×1a3
fffffadd`7671acc0 fffff800`0124e932 Driver!ReaderThread+0×553
fffffadd`7671ad70 fffff800`010202b6 nt!PspSystemThreadStartup+0×3e
fffffadd`7671add0 00000000`00000000 nt!KxStartSystemThread+0×16

7: kd> !analyze -v
[...]
DRIVER_IRQL_NOT_LESS_OR_EQUAL (d1)
An attempt was made to access a pageable (or completely invalid) address at an interrupt request level (IRQL) that is too high.  This is usually caused by drivers using improper addresses. If kernel debugger is available get stack backtrace.
Arguments:
Arg1: 0000000000000007, memory referenced
Arg2: 0000000000000002, IRQL
Arg3: 0000000000000001, value 0 = read operation, 1 = write operation
Arg4: fffffadd88e5dbf3, address which referenced memory
[...]
TRAP_FRAME:  fffffadd7671a800 -- (.trap 0xfffffadd7671a800)
[...]

7: kd> .trap 0xfffffadd7671a800
[...]
NOTE: The trap frame does not contain all registers.
Some register values may be zeroed or incorrect

7: kd> r
Last set context:
rax=0000000000001000 rbx=0000000000000000 rcx=0000000000000007
rdx=fffffadda17d001d rsi=0000000000000000 rdi=0000000000000000
rip=fffffadd88e5dbf3 rsp=fffffadd7671a998 rbp=0000000000000001
 r8=0000000000000001  r9=fffffadda254f2f0 r10=0000000000000000
r11=0000000000000007 r12=0000000000000000 r13=0000000000000000
r14=0000000000000000 r15=0000000000000000
iopl=0 nv up ei pl nz na pe nc
cs=0010 ss=0018 ds=0006 es=0000 fs=fadf gs=ffff efl=00010202
Driver!memcpy+0×83:
fffffadd`88e5dbf3 8801  mov byte ptr [rcx],al ds:0006:0007=??

.trap warning above perhaps explains why we have non-standard values in ds, fs and gs. Typical expected values in kernel mode are these (ds is ignored in 64-bit mode anyway):

cs=0010 ss=0018 ds=002b es=002b fs=0053 gs=002b efl=00010202

7: kd> kL
Child-SP          RetAddr           Call Site
fffffadd`7671a998 fffffadd`88df63f5 Driver!memcpy+0×83
fffffadd`7671a9a0 fffffadd`88dfe97b Driver!ItemCopyTo+0×85
fffffadd`7671a9e0 fffffadd`88e45bd1 Driver!CallbackEx+0×3cb
fffffadd`7671aa80 fffffadd`88dfb130 Driver!Callback+0×131
fffffadd`7671ab90 fffffadd`88dfaef3 Driver!Reply+0×1a0
fffffadd`7671ac40 fffffadd`88de9e23 Driver!OnDataReceive+0×1a3
fffffadd`7671acc0 fffff800`0124e932 Driver!ReaderThread+0×553
fffffadd`7671ad70 fffff800`010202b6 nt!PspSystemThreadStartup+0×3e
fffffadd`7671add0 00000000`00000000 nt!KxStartSystemThread+0×16

We clearly have an instance of a NULL pointer data access. If we try to match this stack trace to known faults in database we would probably find many entries because memcpy is a generic function from C library. So we should try with ItemCopyTo. Indeed, we find a few matches but with slightly different stack traces:

b7535c7c b75931fa Driver!ItemCopyTo+0×6a
b7535ca4 b75c24c4 Driver!CallbackEx+0×23a
b7535d04 b7590c79 Driver!Callback+0xd4
b7535d44 b7590b41 Driver!Reply+0xe9
b7535d68 b7584b87 Driver!OnDataReceive+0×111
b7535dac 8094bea4 Driver!ReaderThread+0×397
b7535ddc 8088f61e nt!PspSystemThreadStartup+0×2e
00000000 00000000 nt!KiThreadStartup+0×16

Offsets are different but the function names are the same. We also don’t see memcpy call but if we look at the faulted instruction we suspect it was inlined memcpy call:

eax=88642870 ebx=00000005 ecx=00000001 edx=00000005 esi=88f3f9a4 edi=00000029
eip=b758d3ca esp=b7535c6c ebp=b7535c7c iopl=0 nv up ei pl nz ac po nc
cs=0008 ss=0010 ds=0023 es=0023 fs=0030 gs=0000 efl=00010212
Driver!ItemCopyTo+0×6a:
b758d3ca f3a5  rep movs dword ptr es:[edi],dword ptr [esi]

We also notice that the found stack trace is from x86 32-bit Windows but ours is from x64 Windows so we suspect the platformorphic fault here and check if we have a fix for x64 binaries.

- Dmitry Vostokov @ DumpAnalysis.org -
Memoidealism as Monistic Aspect Pluralism

July 27th, 2009

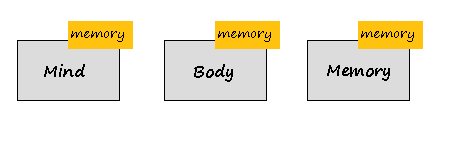
If memory is the basis of everything we might think that memoidealism is a kind of dual aspect monism or plural aspect monism, where mind, body and perhaps many other aspects are manifestations of one single memory substance. Or perhaps, memory is the same as matter or the realm of ideas (materialism or some sort of idealism), and memoidealism is the kind of monism. Or memory is the same or not the same as mind or matter and can be associated with one side of dualism. Not at all, memory is the aspect or attribute of mind, body and other substances, possibly itself. This can be illustrated on the following picture:


If there are only 2 substances then we have monistic aspect dualism as an extension of monism, for example, the extension of idealism:

or the extension of materialism (memuonic theory, memuonics):

Therefore, Memory is a substance and an aspect (attribute) at the same time. This is the essence of MAP (Monistic Aspect Pluralism).

- Dmitry Vostokov @ DumpAnalysis.org -

Epistemic Troubleshooting and Debugging (Part 1)

July 26th, 2009

Paraphrasing “Knowing about knowing about knowing” (Side-box 0.1, Consciousness, David Rose) as “Knowing about knowing about problem solving”, I would suggest the following references to raise the level of awareness from meta-troubleshooting and meta-debugging, the subject of various general purpose debugging books to the next epistemic level. I’m currently reading the following books and let you know about my progress along the journey:

Toward a Unified Theory of Problem Solving: Views From the Content Domains

Buy from Amazon

The Psychology of Problem Solving

Buy from Amazon

The Cambridge Handbook of Expertise and Expert Performance

Buy from Amazon

- Dmitry Vostokov @ DumpAnalysis.org -

MDAA V1 is still a debugging bestseller

July 25th, 2009

Noticed today that it is still one of the top bestselling debugging books on Amazon:

- Dmitry Vostokov @ DumpAnalysis.org -

Deadlocks in iPhone

July 24th, 2009

One of the authors of June Debugged! MZ/PE issue, Kapildev Ramlal, published a short article about XCode debugging of multithreaded deadlocks and a few GDB commands:

Episode 1 of XCode iPhone Debugging Adventures

- Dmitry Vostokov @ DumpAnalysis.org -

Debugged! MZ/PE June issue is out

July 23rd, 2009

Finally the issue is available on Amazon and through other sellers:

Debugged! MZ/PE: Modeling Software Defects

Buy from Amazon

I’m now planning the September issue and post details later. 

- Dmitry Vostokov @ DumpAnalysis.org -

Real-time Memory Visualization System

July 23rd, 2009

Jamie Fenton has finally made available for beta testing fantastic memory visualization system HayWire & Barn Burner I use often for mining curious pictures from virtual memory space, like “cosmic rays“. Besides providing artistic pleasure, real-time natural memory visualization can have other applications including visual debugging. Looking forward to seeing more wonders in this area of research!

- Dmitry Vostokov @ DumpAnalysis.org -

Trace Analysis Patterns (Part 5)

July 22nd, 2009

Sometimes we have several disjoint Periodic Errors and possible false positives. We wonder where should we start or assign relative priorities for troubleshooting suggestions. Here Statement Density and Current pattern can help. The statement or message density is simply the ratio of the number of occurrences of the specific trace statement (message) in the trace to the total number of all different recorded messages.

Consider this software trace with two frequent messages:

N     PID  TID
21    5928 8092 LookupAccountSid failed. Result = -2146238462
[...]
1013  5928 1340 SQL execution needs a retry. Result = 0

We have approx. 7,500 statements for the former and approx. 1,250 statements for the latter. The total number of trace statements is 185,700, so we have the corresponding approx. trace densities: 0.04 and 0.0067. Their relative ratio 7,500 / 1,250 is 6.

Another trace for the same problem was collected at a different time with the same errors. It has 71,100 statements and only 160 and 27 statements counted for messages above. We have a ratio 160 / 27 approx. the same, 5.93, that suggests that messages are correlated. However statement density is much lower, 0,002 and 0.00038 approx. and this suggests the closer look at the second trace to see whether these problems started at some time later after the start of the recording.

We can also check the statement current as the number of messages per unit of time. The first trace was recorded over the period of 195 seconds and the second over the period of 650 seconds. Therefore, we have 952 msg/s and 109 msg/s respectively. This suggests that the problem might have started at some time during the second trace or there were more modules selected for the first trace. To make sure, we adjust the total number of messages for these two traces. We find the first occurrence of the error and subtract its message number from the total number of messages. For our first trace we see that messages start from the very beginning, and in our second trace they also almost start from the beginning. So such adjustment shouldn’t give much better results here. Also these statements continue to be recorded till the very end of these traces.

To avoid being lost in this discusssion I repeat main results:

           Density             Relative Density   Current,
                                                  all msg/s
Trace 1    0.04 / 0.0067       6                  952
Trace 2    0.002 / 0.00038     5.93               109

The possibility that much more was traced that resulted in lower density for the second trace should be discarded because we have much lower current. Perhaps environment was not quite the same for the second tracing. However the same relative density for two different errors suggest that they are correlated and the higher density of the first error suggests that we should start our investigation from it.

The reason why I came up with this statistical trace analysis pattern is because 2 different engineers analyzed the same trace and both were suggesting different troubleshooting paths based on selected error messages from software traces. So I did a statistical analysis to prioritize their suggestions.

- Dmitry Vostokov @ TraceAnalysis.org -

The Origin of Software Engineering Notebooks

July 21st, 2009

The idea to have a reading notebook online came to me after I recalled that at school I heard that Lenin had Philosophical Notebooks. You can find them in Lenin Internet Library, volume 38 of his Collected Works. As a schoolboy, I was curious about Lenin’s notebooks and even borrowed them from the school library to see how they looked like inside. I wasn’t impressed though due to the lack of philosophical knowledge on my side but the idea stuck to my mind. At my school age I read his biography several times and my favourite episode was an assassination attempt by socialist revolutionary Fanny Kaplan.

- Dmitry Vostokov @ DumpAnalysis.org -

Hot-Chopped MDAA Volumes

July 21st, 2009

Found today on Amazon that one seller sells cheap chopped copies of Memory Dump Analysis Anthology:

“The LOWEST PRICE because the spine binding & glue has been CHOPPED OFF; the binding is MISSING; this makes the loose pages suitable for photocopying or for hole punching to place into a 3-ring notebook. The pages have no marks or highlights. I also have Volume 2 with a cut spine for cheap.”

The seller has been contacted to stop this advertisement because the page number 2 in both volumes says:

You must not circulate this book in any other binding or cover and you must impose the same condition on any acquirer.

There is also the standard clause about reproduction and storage.

- Dmitry Vostokov @ DumpAnalysis.org -

3D Memory Visualization

July 19th, 2009

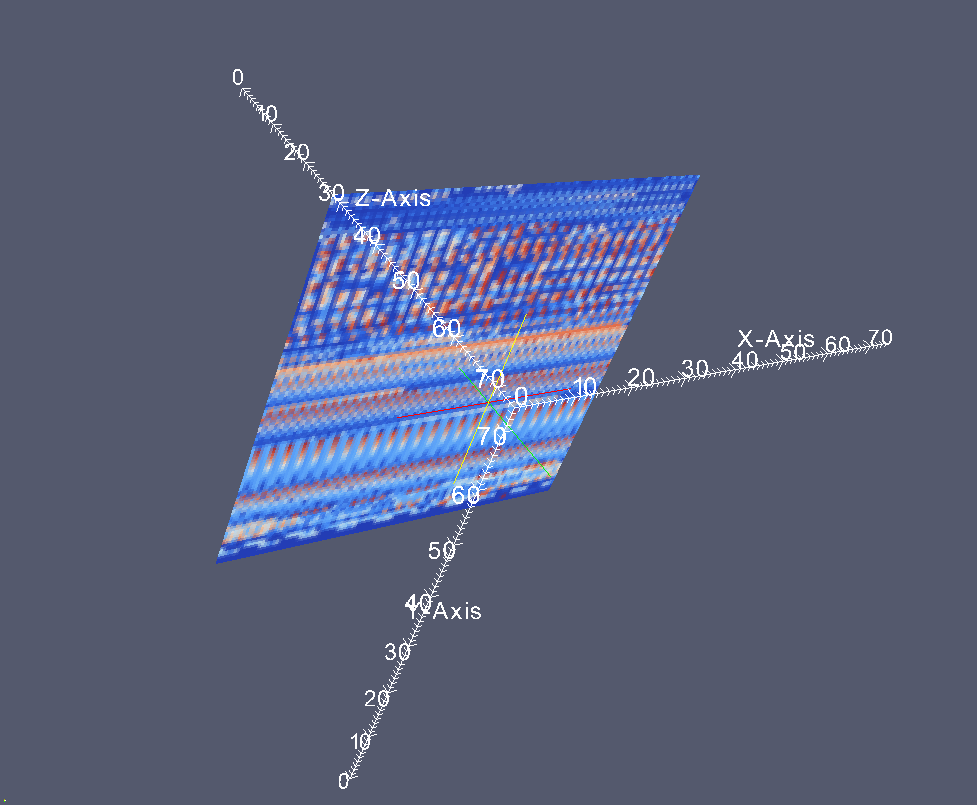
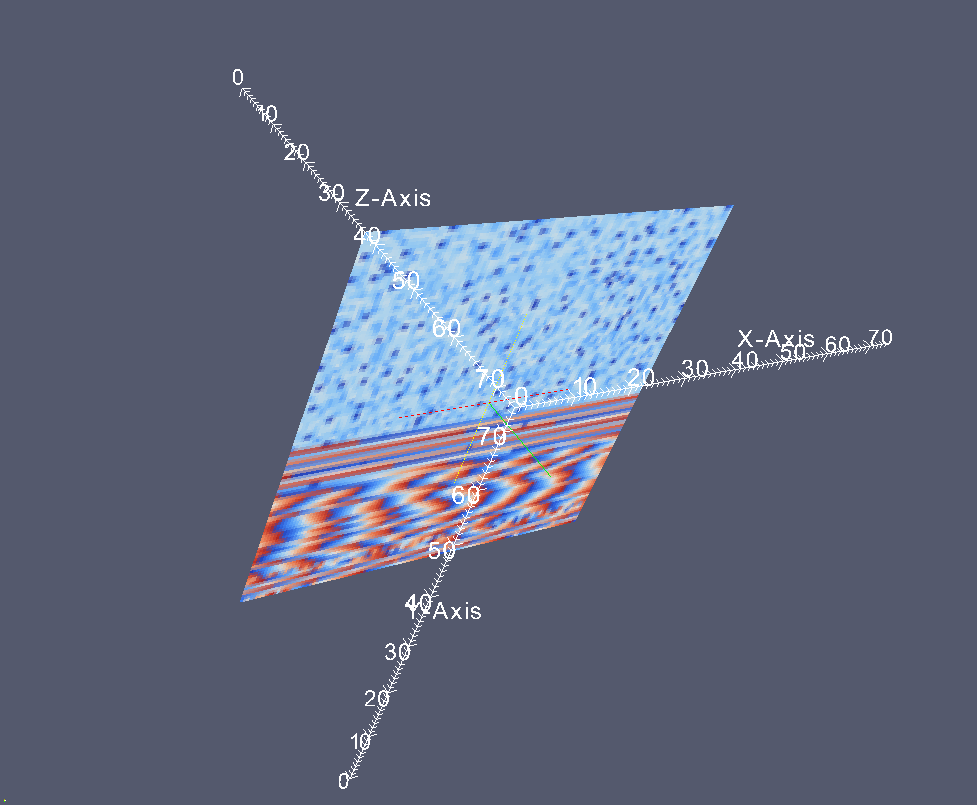
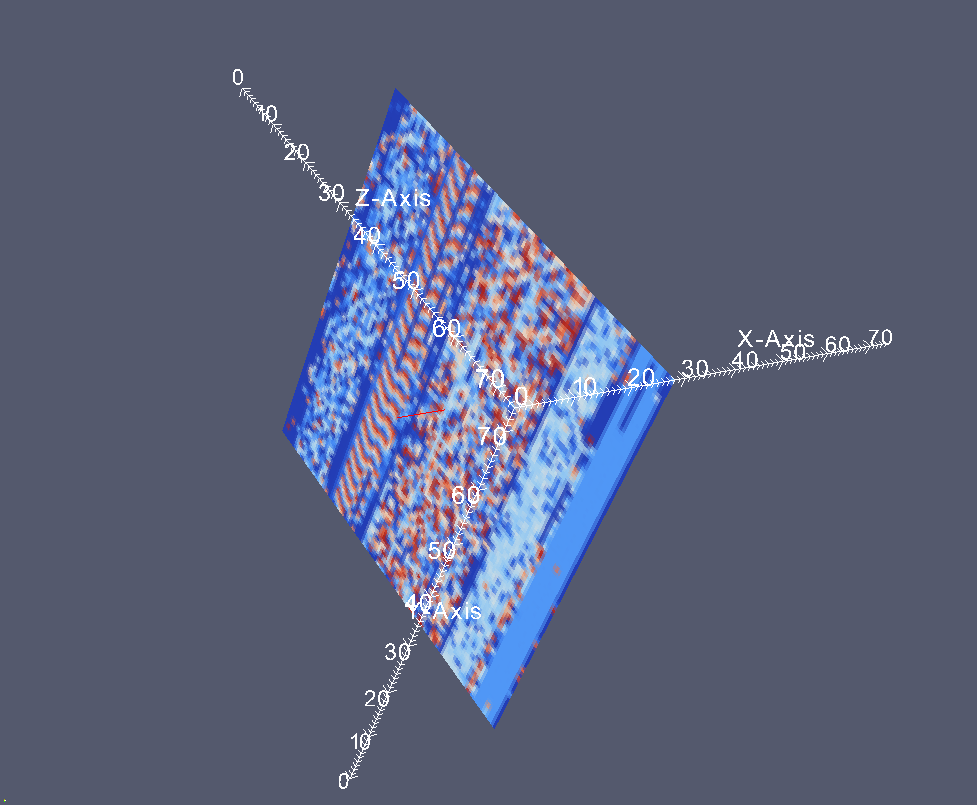
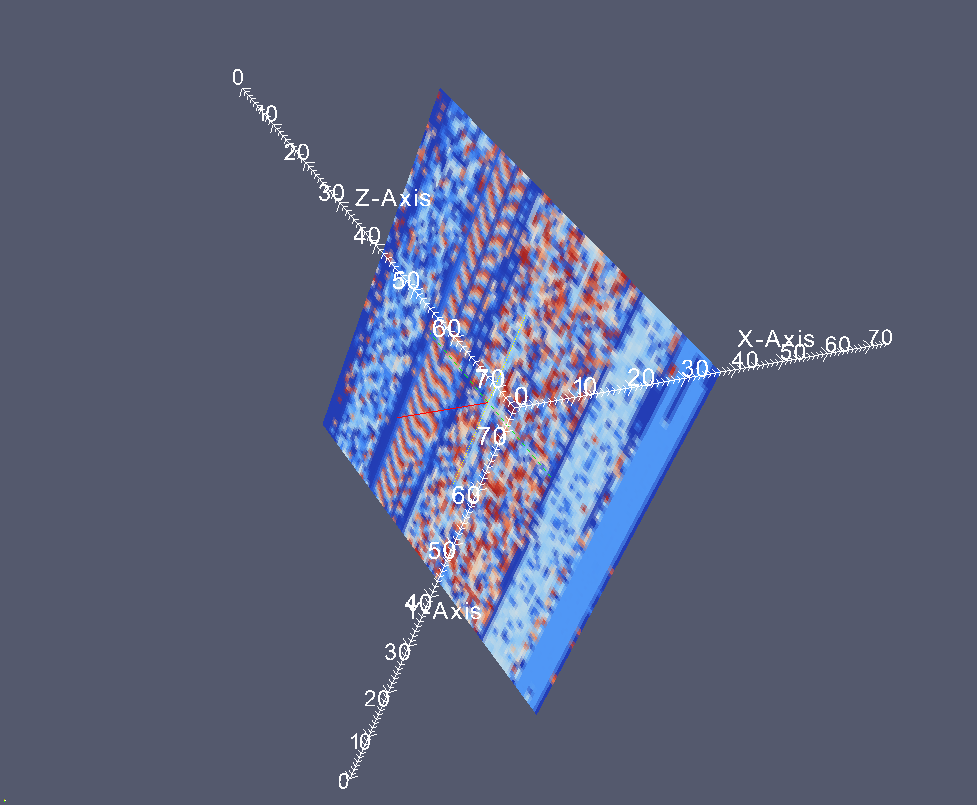
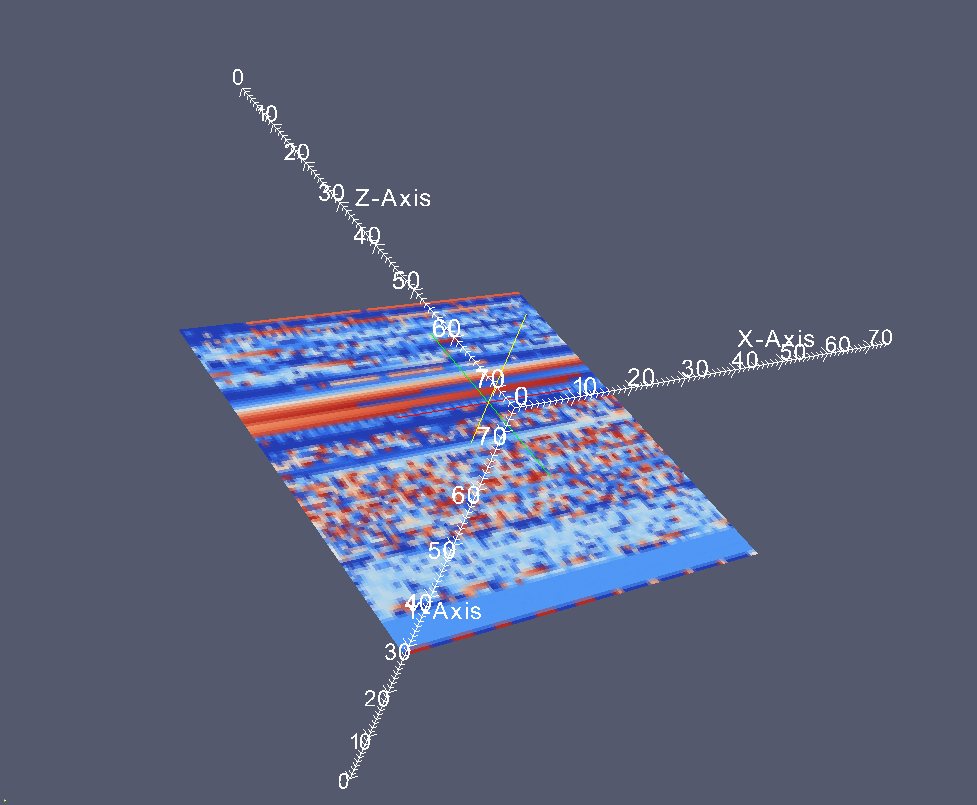
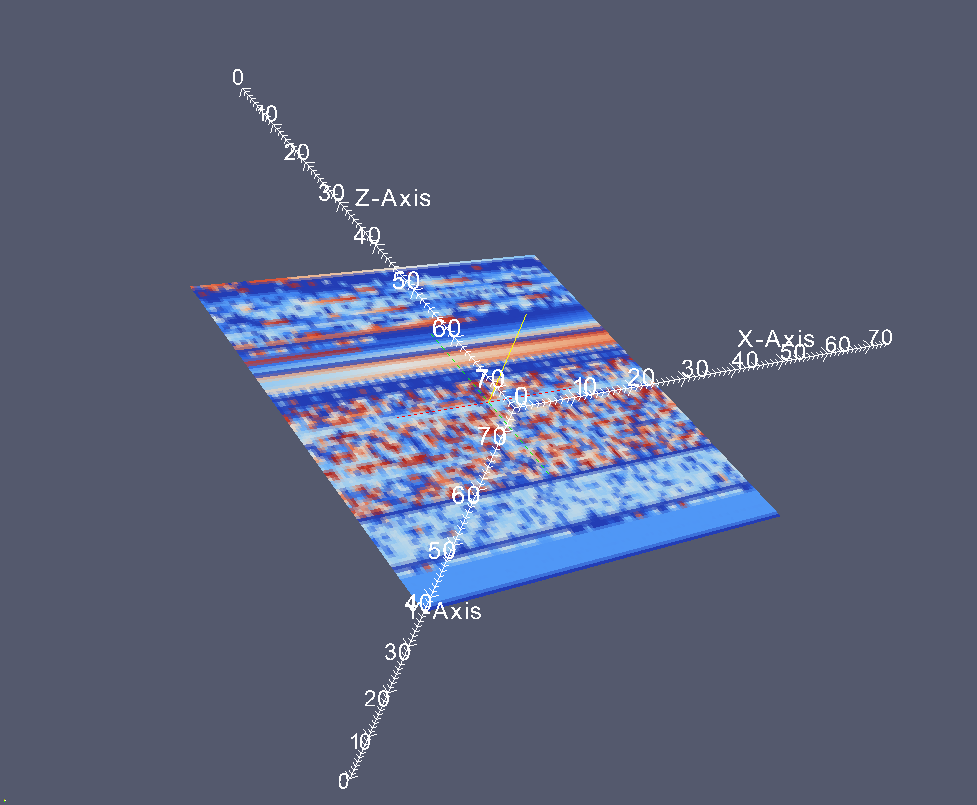
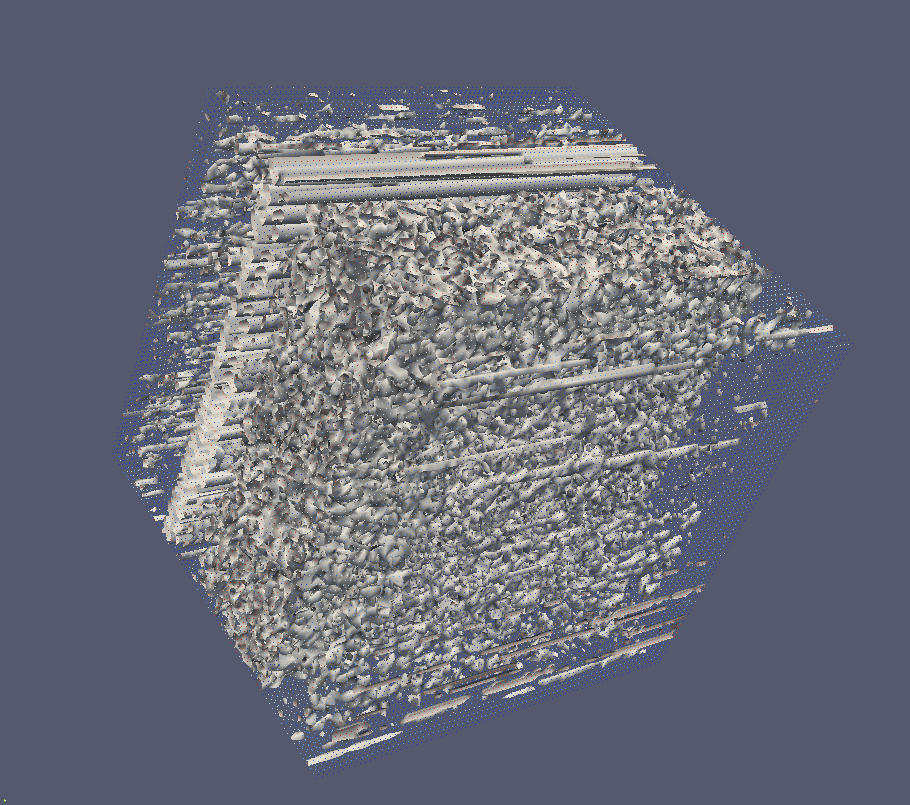
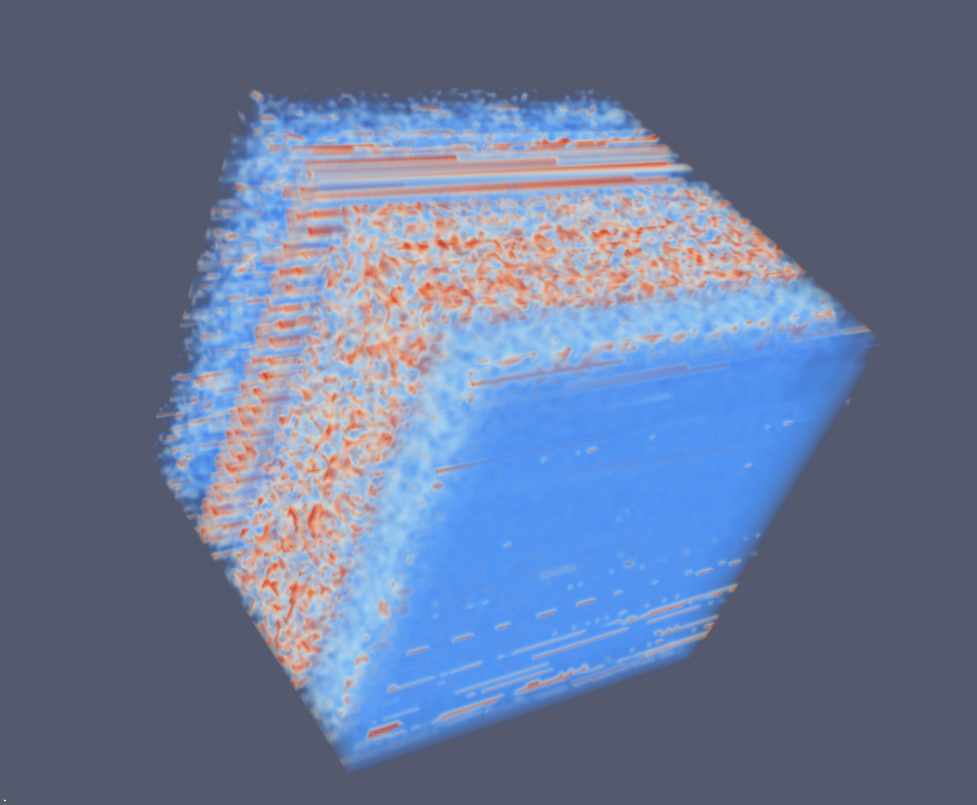
Finally I realized this morning that in addition to folding of a linear memory space into a 2D image in ParaView, the so called DLL List Landscape, we can also do a 3D folding too. I used the same dump file but this time the formula for coordinates is:

(file_size/4)1/3

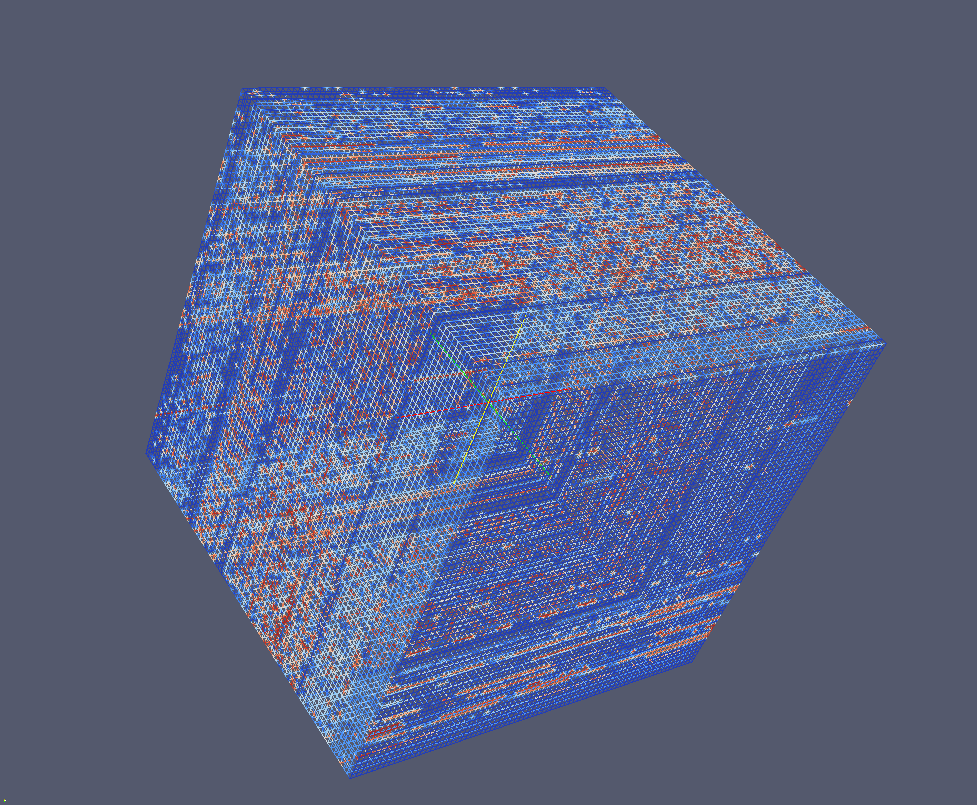
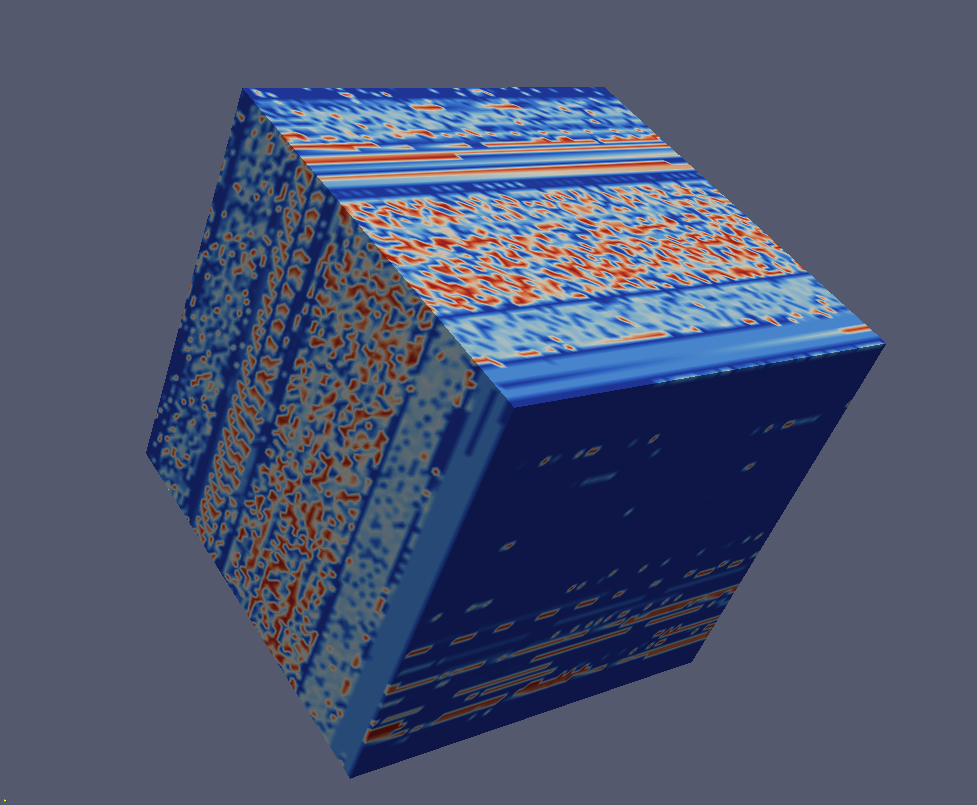
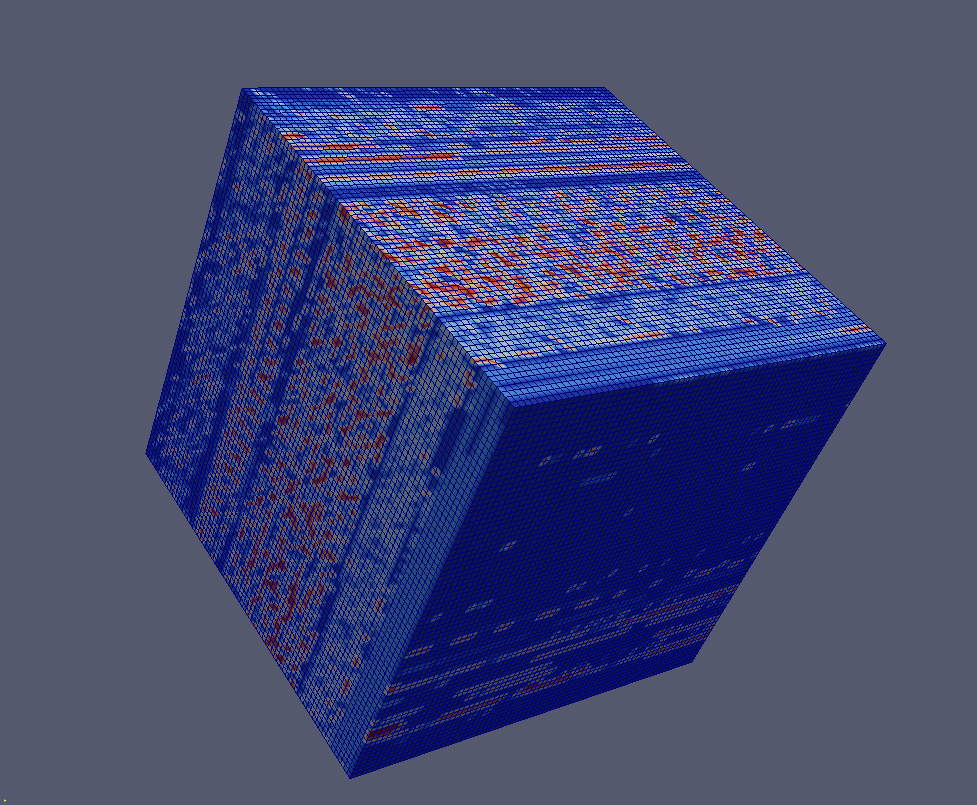
so for 1,746,853 byte file we have a 3D map of 75×75x75 points. Here are some beautiful images (click on them for a larger view) that I got and I write next parts of advanced memory visualization tutorial later next week.

Point view

Click to enlarge

Wireframe view

Click to enlarge

Surface view

Click to enlarge

Surface + edges view

Click to enlarge

Volume view

Click to enlarge

The chosen 3D folding shows varying 2D landscape in XY plane but almost constant landscape in YZ and XZ slices:

Click to enlarge

Click to enlarge

Click to enlarge

Click to enlarge

Click to enlarge

Click to enlarge

More effects.

Contour view

Click to enlarge

Process DNA view

Click to enlarge

- Dmitry Vostokov @ DumpAnalysis.org -

Anatomy of Analogy of Anthology of Memory

July 18th, 2009

Here is a bit of history of Memory Dump Analysis Anthology. Back in 2008, in January-February I was in search of the title name and was focused on variations of Crash Dump Analysis until one day I stumbled across this book in the local book shop (UK version was available earlier in February before US and you can still buy it on Amazon UK):

Memory: An Anthology

Buy from Amazon

I immediately understood how I needed to name the collection of blog posts. Thus Memory Dump Analysis Anthology, Volume 1 was born.

- Dmitry Vostokov @ DumpAnalysis.org -

Realtime Reading of Windows Internals

July 17th, 2009

I resumed this week my reading notebook on Software Generalist blog with a top priority book to read every working day: Windows Internals, 5th edition. In reading notes I put what I find interesting for me (at this time) or related to Windows memory dump analysis or debugging and troubleshooting in general. For the latter case, sometimes I put additional references or even WinDbg examples from user, kernel and complete memory dumps in full color. Hope you find these notes useful too.

- Dmitry Vostokov @ DumpAnalysis.org -

On Space and Mode

July 17th, 2009

Sometimes I see engineers use memory “space” and protection “mode” terms interchangeably although, in my opinion, there is a big difference between them. They are independent from each other (orthogonal). For example, a thread may access a user space address but be running in a kernel protected mode. Even it is possible to call a user space function from a kernel space thread (that function shouldn’t try to call Windows API). The following combinations are possible:

user space / user mode
kernel space / kernel mode
user space / kernel mode

Most of the time space and mode coincide (blue - user, red - kernel):

ChildEBP RetAddr 
b6046c50 80833e95 nt!KiSwapContext+0×26
b6046c7c 8082b72b nt!KiSwapThread+0×2e5
b6046cc4 808ef652 nt!KeRemoveQueue+0×417
b6046d48 8088b19c nt!NtRemoveIoCompletion+0xdc
b6046d48 7c94860c nt!KiFastCallEntry+0xfc
00bfff70 7c9477f9 ntdll!KiFastSystemCallRet
00bfff74 7c959f68 ntdll!NtRemoveIoCompletion+0xc
00bfffb8 7c82482f ntdll!RtlpWorkerThread+0×3d
00bfffec 00000000 kernel32!BaseThreadStart+0×34

I personally prefer to talk about ”spaces” when I analyze complete memory dumps and almost never talk about “modes”. 

- Dmitry Vostokov @ DumpAnalysis.org -

Memory Space Music

July 16th, 2009

I was trying hard to name the music style or genre related to memory dumps and computer memory (physical and virtual). The problem is that in this area of electronic and electroacoustic music most good names were already taken. Some candidates that came to my mind were just MUSIC (My User Space IC) or IRQL Music. Finally I decided to name it simply: Memory Space Music. Stay tuned to future samples dug out from memory spaces.

- Dmitry Vostokov @ DumpAnalysis.org -
A book is better than a cigarette

July 16th, 2009

I’d been smoking since I was 18 and quit a few years ago. I found that numerous books become my substitute for previous cigarette breaks. This might have different side effects but because I read mostly paper books and magazines it is much better, I believe, than switching from one computer screen to another.

- Dmitry Vostokov @ LiterateScientist.com -

Memory Dump View of Artificial Intelligence

July 15th, 2009

“Life is too short not to believe in Memory.”

Founding Farther of Memorianity

Imagine someone wrote an AI program and fit it into 4Gb. Imagine that it becomes intelligent indeed after some execution time (learning?). At some point when we admit its true intelligence we save a complete memory dump. Conclusion: we successfully reduced AI to a memory dump (out of memorillion of them). If AI requires a distributed network we still have the more complex dump (but still the dump). If AI program requires storage for its learning database we just concatenate it to the complete memory dump and we have the dump file again. Would advocates of AI or even Artificial General Intelligence agree with me?

- Dmitry Vostokov @ DumpAnalysis.org -
Breakfast with Intel Manuals (1st)

July 15th, 2009

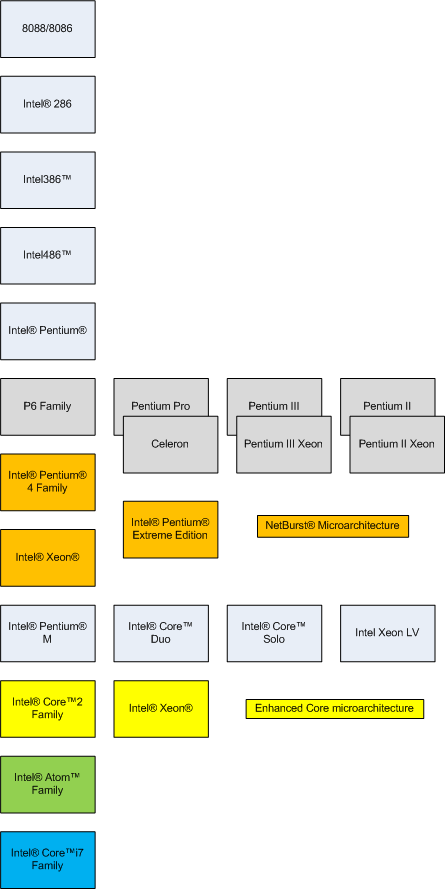
I’ve decided to spend a few hours every week reading and / or re-reading various Intel 64 and IA-32 Architectures manuals to keep myself informed in differences between x64 and x86, revive Asmpedia and perhaps even apply gained insights to memory dump analysis. Today I read 2.1 - 2.2.5 sections from Volume 1 and here’s a rough picture of processor families that I assembled after reading:


Most of these models and their hardware architecture are discussed in this popular book that I read more than a year ago and still recommend without hesitation:

Inside the Machine 

- Dmitry Vostokov @ DumpAnalysis.org -
On Self Dumps of Secure String API

July 14th, 2009

Sometimes we get crashes with the following stack trace pattern:

0:000> kv 100
ChildEBP RetAddr  Args to Child             
0012cecc 7c91df4a 7c8094fe 00000002 0012cef8 ntdll!KiFastSystemCallRet
0012ced0 7c8094fe 00000002 0012cef8 00000001 ntdll!ZwWaitForMultipleObjects+0xc
0012cf6c 7c80a085 00000002 0012d09c 00000000 kernel32!WaitForMultipleObjectsEx+0x12c
0012cf88 6990763c 00000002 0012d09c 00000000 kernel32!WaitForMultipleObjects+0x18
0012d91c 699082b1 0012f090 00000001 00198312 faultrep!StartDWException+0×5df
0012e990 7c8635d1 0012f090 00000001 00000000 faultrep!ReportFault+0×533
0012f030 78138a09 0012f090 00000022 c000000d kernel32!UnhandledExceptionFilter+0×587
0012f368 781443d1 00000000 00000000 00000000 msvcr80!_invoke_watson+0xc4

0012f38c 0040b02f 0012f538 00000104 004f80a0 msvcr80!strcat_s+0×29
WARNING: Stack unwind information not available. Following frames may be wrong.
0012f39c 0012f538 00000104 00430848 0012f538 Application+0xb020

0:000> .exptr 0012f090

----- Exception record at 0012f040:
ExceptionAddress: 781443d1 (msvcr80!strcat_s+0x00000029)
   ExceptionCode: c000000d
  ExceptionFlags: 00000000
NumberParameters: 0

----- Context record at 0012f098:
eax=f2c4dacf ebx=00000000 ecx=00000002 edx=7c91e514 esi=00000022 edi=00000000
eip=781443d1 esp=0012f36c ebp=004f7658 iopl=0 nv up ei ng nz na pe nc
cs=001b ss=0023 ds=0023 es=0023 fs=003b gs=0000 efl=00000286
msvcr80!strcat_s+0x29:
781443d1 83c414          add     esp,14h

0:000> !error c000000d
Error code: (NTSTATUS) 0xc000000d (3221225485) - An invalid parameter was passed to a service or function.

We clearly see that the crash involved strcat_s but we don’t see any invalid instruction or access violation call. The ADD instruction is perfectly valid above. However, if we disassemble EIP backwards we would see the call to _invalid_parameter function and it looks like it has a name association with Dr. Watson:

0:000> ub 781443d1
msvcr80!strcat_s+0×1c:
781443c4 5e              pop     esi
781443c5 8930            mov     dword ptr [eax],esi
781443c7 53              push    ebx
781443c8 53              push    ebx
781443c9 53              push    ebx
781443ca 53              push    ebx
781443cb 53              push    ebx
781443cc e89f46ffff      call    msvcr80!_invalid_parameter (78138a70)

0:000> uf 78138a70
Flow analysis was incomplete, some code may be missing
msvcr80!_invoke_watson:
78138945 55              push    ebp
78138946 8dac2458fdffff  lea     ebp,[esp-2A8h]
7813894d 81ec28030000    sub     esp,328h

[...]

msvcr80!_invalid_parameter:
78138a70 55              push    ebp
78138a71 8bec            mov     ebp,esp
78138a73 ff3528401c78    push    dword ptr [msvcr80!__pInvalidArgHandler (781c4028)]
78138a79 e85ba1ffff      call    msvcr80!_decode_pointer (78132bd9)
78138a7e 85c0            test    eax,eax
78138a80 59              pop     ecx
78138a81 7403            je      msvcr80!_invalid_parameter+0×16 (78138a86)

msvcr80!_invalid_parameter+0x13:
78138a83 5d              pop     ebp
78138a84 ffe0            jmp     eax

msvcr80!_invalid_parameter+0x16:
78138a86 6a02            push    2
78138a88 e806330000      call    msvcr80!_crt_debugger_hook (7813bd93)
78138a8d 59              pop     ecx
78138a8e 5d              pop     ebp
78138a8f e9b1feffff      jmp     msvcr80!_invoke_watson (78138945)

According to MSDN documentation, _s secure functions by default use a postmortem debugger mechanism:

Secure-enhanced CRT parameter validation

So we have something that is similar to Self-Dump pattern here. The same parameter checking is seen in the case of C++ STL exceptions. In case of custom unhandled exception filters not resorting to WER faulrep.dll other stacks can show process termination, for example, with wcscpy_s:

0:000> kL 100
ChildEBP RetAddr 
0111cb64 7c947c39 ntdll!KiFastSystemCallRet
0111cb68 7c80202b ntdll!ZwTerminateProcess+0xc
0111cb78 78138a2b kernel32!TerminateProcess+0×20
0111ceb4 78144ba1 MSVCR80!_invoke_watson+0xe6

0111ced8 67dbb47d MSVCR80!wcscpy_s+0×29
0111cf00 67dbc93b Application!CopyName+0×5d
[…]

Here the specified size of the destination buffer was smaller than the size of source NULL-terminated strings, which was a good thing anyway: old strcpy or strcat function would definitely caused buffer overflow effects. Now we have a nice side effect too, the dump is saved, ready for a postmortem analysis and subsequent code improvement.

- Dmitry Vostokov @ DumpAnalysis.org -
Memory Exponentiation (PowerSet)

July 14th, 2009

What gives rise to intelligence in memory medium? Apparently the drive towards infinity via power set or the so called exponentiation, where patterns, subsets of memory, are combined in their totality to form even bigger memory space. Imagine how many subsets can be formed from just one complete 4Gb memory dump?

We have 232 unique byte pairs (address, value)

so we have 2232 possible subsets.

- Dmitry Vostokov @ DumpAnalysis.org -