May 19th, 2012
Recently I observed a few occurrences of a rare No Current Thread pattern in a large set of process memory dumps:
0:???> k

WARNING: The debugger does not have a current process or thread

WARNING: Many commands will not work

^ Illegal thread error in ‘k’
0:???> ~

WARNING: The debugger does not have a current process or thread

WARNING: Many commands will not work

0  Id: 95f4.6780 Suspend: 1 Teb: 7efdd000 Unfrozen
Setting a current thread helps:
0:???> ~0s

WARNING: The debugger does not have a current process or thread

WARNING: Many commands will not work

eax=037d0010 ebx=0002bda0 ecx=03b1a010 edx=00000007 esi=037d0010 edi=03b069fc

eip=0397939f esp=0018fd98 ebp=0018fdd8 iopl=0  nv up ei pl nz na po nc

cs=0023  ss=002b  ds=002b  es=002b  fs=0053  gs=002b  efl=00200202

DllA+0×939f:

0397939f 8b10 mov edx,dword ptr [eax] ds:002b:037d0010=03b1a010
0:000> k

ChildEBP RetAddr

WARNING: Stack unwind information not available. Following frames may be wrong.

0018fdd8 03975257 DllA+0x939f

0018fdf8 03975577 DllA+0x5257

0018fe58 772bb9a0 DllA+0x5577

0018fe78 772d9b96 ntdll!LdrpCallInitRoutine+0x14

0018ff1c 772d9a38 ntdll!LdrShutdownProcess+0x1aa

0018ff30 752279f4 ntdll!RtlExitUserProcess+0x74

0018ff44 0040625d kernel32!ExitProcessStub+0x12

0018ff5c 012528e5 Application+0x625d

0018ff88 7522339a Application!foo+0xdc88f1

0018ff94 772bbf42 kernel32!BaseThreadInitThunk+0xe

0018ffd4 772bbf15 ntdll!__RtlUserThreadStart+0x70

0018ffec 00000000 ntdll!_RtlUserThreadStart+0x1b
However, EIP of the new current thread doesn’t point to any access violation and the dereferenced address is valid:
0:000> !address 037d0010

Usage:                  <unclassified>

Allocation Base:        037d0000

Base Address:           037d0000

End Address:            038dd000

Region Size:            0010d000

Type:                   00020000 MEM_PRIVATE

State:                  00001000 MEM_COMMIT

Protect:                00000004 PAGE_READWRITE
Also, if we inspect the raw stack data we won’t find any hidden exceptions there. So we conclude that the missing thread was exceptional. Indeed, there is a saved exception context in the process memory dump:
0:000> .exr -1

ExceptionAddress: 08a9ae18 (<Unloaded_DllB.dll>+0x001cae18)

ExceptionCode: c0000005 (Access violation)

ExceptionFlags: 00000001

NumberParameters: 1

Parameter[0]: 00000008
- Dmitry Vostokov @ DumpAnalysis.org + TraceAnalysis.org -
Posted in Crash Dump Analysis, Crash Dump Patterns, Debugging | No Comments »
May 18th, 2012
Comments in italics are mine and express my own views, thoughts and opinions
Mac OS X Internals by A. Singh:
kextstat command (p. 49) - here’s the output from my system:
MacBook-Air:~ DumpAnalysis$ kextstat

Index Refs Address            Size       Wired      Name (Version) <Linked Against>

1   78 0xffffff7f80739000 0x683c     0x683c     com.apple.kpi.bsd (11.3.0)

2    6 0xffffff7f807de000 0x3d0      0x3d0      com.apple.kpi.dsep (11.3.0)

3  104 0xffffff7f80744000 0x1b9d8    0x1b9d8    com.apple.kpi.iokit (11.3.0)

4  109 0xffffff7f8072f000 0x9b54     0x9b54     com.apple.kpi.libkern (11.3.0)

5   93 0xffffff7f80740000 0x88c      0x88c      com.apple.kpi.mach (11.3.0)

6   37 0xffffff7f80760000 0x4938     0x4938     com.apple.kpi.private (11.3.0)

7   53 0xffffff7f80741000 0x22a0     0x22a0     com.apple.kpi.unsupported (11.3.0)

8   19 0xffffff7f80bc6000 0x7000     0x7000     com.apple.iokit.IOACPIFamily (1.4) <7 6 4 3>

9   27 0xffffff7f80765000 0x1e000    0x1e000    com.apple.iokit.IOPCIFamily (2.6.8) <7 6 5 4 3>

10    2 0xffffff7f81ba4000 0x58000    0x58000    com.apple.driver.AppleACPIPlatform (1.4) <9 8 7 6 5 4 3 1>

11    1 0xffffff7f809cc000 0xc000     0xc000     com.apple.driver.AppleKeyStore (28.18) <7 6 5 4 3 1>

12    9 0xffffff7f807e2000 0x25000    0x25000    com.apple.iokit.IOStorageFamily (1.7) <7 6 5 4 3 1>

13    0 0xffffff7f80c4c000 0x19000    0x19000    com.apple.driver.DiskImages (331.3) <12 7 6 5 4 3 1>

14    0 0xffffff7f818e6000 0x2a000    0x2a000    com.apple.driver.AppleIntelCPUPowerManagement (167.3.0) <7 6 5 4 3 1>

15    0 0xffffff7f807df000 0x3000     0x3000     com.apple.security.TMSafetyNet (7) <7 6 5 4 2 1>

16    2 0xffffff7f80846000 0x4000     0x4000     com.apple.kext.AppleMatch (1.0.0d1) <4 1>

17    1 0xffffff7f8084a000 0x11000    0x11000    com.apple.security.sandbox (177.3) <16 7 6 5 4 3 2 1>

18    0 0xffffff7f8085b000 0x5000     0x5000     com.apple.security.quarantine (1.1) <17 16 7 6 5 4 2 1>

19    0 0xffffff7f81c0b000 0x8000     0x8000     com.apple.nke.applicationfirewall (3.2.30) <7 6 5 4 3 1>

20    0 0xffffff7f818e2000 0x3000     0x3000     com.apple.driver.AppleIntelCPUPowerManagementClient (167.3.0) <7 6 5 4 3 1>

21    0 0xffffff7f81b81000 0x3000     0x3000     com.apple.driver.AppleAPIC (1.5) <4 3>

22    3 0xffffff7f80b62000 0x4000     0x4000     com.apple.iokit.IOSMBusFamily (1.1) <5 4 3>

23    0 0xffffff7f81bfc000 0x7000     0x7000     com.apple.driver.AppleACPIEC (1.4) <22 10 8 5 4 3>

24    0 0xffffff7f816da000 0x4000     0x4000     com.apple.driver.AppleSMBIOS (1.7) <7 4 3>

25    0 0xffffff7f81918000 0x3000     0x3000     com.apple.driver.AppleHPET (1.6) <8 7 5 4 3>

26    0 0xffffff7f816ff000 0x7000     0x7000     com.apple.driver.AppleRTC (1.4) <8 5 4 3 1>

27    6 0xffffff7f809d8000 0x6b000    0x6b000    com.apple.iokit.IOHIDFamily (1.7.1) <11 7 6 5 4 3 2 1>

28    0 0xffffff7f81c05000 0x4000     0x4000     com.apple.driver.AppleACPIButtons (1.4) <27 10 8 7 6 5 4 3 1>

29    1 0xffffff7f81b57000 0x4000     0x4000     com.apple.driver.AppleEFIRuntime (1.5.0) <7 6 5 4 3>

30   13 0xffffff7f80783000 0x4f000    0x4f000    com.apple.iokit.IOUSBFamily (4.5.8) <9 7 5 4 3 1>

32    0 0xffffff7f80a8e000 0x17000    0x17000    com.apple.driver.AppleUSBEHCI (4.5.8) <30 9 7 5 4 3 1>

33    2 0xffffff7f80dc8000 0xa000     0xa000     com.apple.iokit.IOAHCIFamily (2.0.7) <5 4 3 1>

34    0 0xffffff7f81b85000 0x18000    0x18000    com.apple.driver.AppleAHCIPort (2.2.0) <33 9 5 4 3 1>

35    0 0xffffff7f816df000 0x8000     0x8000     com.apple.driver.AppleSmartBatteryManager (161.0.0) <22 8 5 4 3 1>

36    0 0xffffff7f81b5b000 0x7000     0x7000     com.apple.driver.AppleEFINVRAM (1.5.0) <29 7 5 4 3>

37    5 0xffffff7f80986000 0x29000    0x29000    com.apple.iokit.IONetworkingFamily (2.0) <7 6 5 4 3 1>

38    1 0xffffff7f80dfb000 0x38000    0x38000    com.apple.iokit.IO80211Family (412.2) <37 7 5 4 3 1>

39    0 0xffffff7f80e33000 0x1e0000   0x1e0000   com.apple.driver.AirPort.Brcm4331 (513.20.19) <38 37 9 7 5 4 3 1>

40    0 0xffffff7f809c9000 0x3000     0x3000     com.apple.iokit.IOUSBUserClient (4.5.8) <30 7 5 4 3 1>

41    0 0xffffff7f80a79000 0x11000    0x11000    com.apple.driver.AppleUSBHub (4.5.0) <30 5 4 3 1>

42    4 0xffffff7f80ab2000 0x9e000    0x9e000    com.apple.iokit.IOThunderboltFamily (1.7.4) <5 4 3 1>

43    0 0xffffff7f8163e000 0x12000    0x12000    com.apple.driver.AppleThunderboltNHI (1.3.2) <42 9 8 5 4 3 1>

44    0 0xffffff7f80dde000 0x15000    0x15000    com.apple.iokit.IOAHCIBlockStorage (2.0.1) <33 12 5 4 3 1>

45    0 0xffffff7f815b2000 0x4000     0x4000     com.apple.driver.XsanFilter (403) <12 5 4 3 1>

46    0 0xffffff7f81342000 0x9000     0x9000     com.apple.BootCache (33) <7 6 5 4 3 1>

47    0 0xffffff7f81b46000 0x5000     0x5000     com.apple.AppleFSCompression.AppleFSCompressionTypeZlib (1.0.0d1) <6 4 3 2 1>

48    0 0xffffff7f81b4d000 0x5000     0x5000     com.apple.AppleFSCompression.AppleFSCompressionTypeDataless (1.0.0d1) <7 6 4 3 2 1>

49    1 0xffffff7f807d2000 0x6000     0x6000     com.apple.driver.AppleUSBComposite (4.5.8) <30 4 3 1>

50    0 0xffffff7f807d8000 0x6000     0x6000     com.apple.driver.AppleUSBMergeNub (4.5.3) <49 30 4 3 1>

51    3 0xffffff7f80a43000 0x8000     0x8000     com.apple.iokit.IOUSBHIDDriver (4.4.5) <30 27 5 4 3 1>

52    0 0xffffff7f815de000 0x4000     0x4000     com.apple.driver.AppleUSBTCKeyboard (225.2) <51 30 27 7 6 5 4 3 1>

55    2 0xffffff7f80cc1000 0x76000    0x76000    com.apple.iokit.IOBluetoothFamily (4.0.3f12) <7 5 4 3 1>

56    1 0xffffff7f80d57000 0xe000     0xe000     com.apple.driver.AppleUSBBluetoothHCIController (4.0.3f12) <55 30 7 5 4 3>

57    0 0xffffff7f80d6d000 0x9000     0x9000     com.apple.driver.BroadcomUSBBluetoothHCIController (4.0.3f12) <56 55 30 5 4 3>

58    0 0xffffff7f81632000 0x4000     0x4000     com.apple.driver.AppleThunderboltPCIDownAdapter (1.2.1) <42 9 4 3>

59    0 0xffffff7f815e7000 0x13000    0x13000    com.apple.driver.AppleUSBMultitouch (227.1) <51 30 27 6 5 4 3 1>

60    1 0xffffff7f81650000 0x8000     0x8000     com.apple.driver.AppleThunderboltDPAdapterFamily (1.5.9) <42 9 8 5 4 3>

61    0 0xffffff7f81658000 0x4000     0x4000     com.apple.driver.AppleThunderboltDPInAdapter (1.5.9) <60 42 9 8 5 4 3>

62    0 0xffffff7f815e3000 0x3000     0x3000     com.apple.driver.AppleUSBTCButtons (225.2) <51 30 27 7 6 5 4 3 1>

64    3 0xffffff7f80861000 0x2b000    0x2b000    com.apple.iokit.IOSCSIArchitectureModelFamily (3.0.3) <5 4 3 1>

65    1 0xffffff7f809b8000 0x11000    0x11000    com.apple.iokit.IOUSBMassStorageClass (3.0.1) <64 30 12 5 4 3 1>

67   14 0xffffff7f80c02000 0x38000    0x38000    com.apple.iokit.IOGraphicsFamily (2.3.2) <9 7 5 4 3>

68    0 0xffffff7f817a8000 0x3a000    0x3a000    com.apple.driver.AppleIntelSNBGraphicsFB (7.1.8) <67 9 8 7 6 5 4 3 1>

72    7 0xffffff7f80c3a000 0x12000    0x12000    com.apple.iokit.IONDRVSupport (2.3.2) <67 9 7 5 4 3>

73    1 0xffffff7f81b1c000 0x3000     0x3000     com.apple.driver.AppleBacklightExpert (1.0.3) <72 67 9 5 4 3>

74    0 0xffffff7f81b71000 0x5000     0x5000     com.apple.driver.AppleBacklight (170.1.9) <73 72 67 9 5 4 3>

75    1 0xffffff7f81b0a000 0x3000     0x3000     com.apple.driver.AppleGraphicsControl (3.0.16) <72 67 9 8 7 5 4 3 1>

77    0 0xffffff7f8179b000 0x3000     0x3000     com.apple.driver.AppleLPC (1.5.3) <9 5 4 3>

78    0 0xffffff7f816c9000 0x3000     0x3000     com.apple.driver.AppleSMBusPCI (1.0.10d0) <9 5 4 3>

79    1 0xffffff7f80bcd000 0x13000    0x13000    com.apple.driver.IOPlatformPluginFamily (4.7.5d4) <8 7 6 5 4 3>

80    3 0xffffff7f80be0000 0xc000     0xc000     com.apple.driver.AppleSMC (3.1.1d8) <8 7 5 4 3>

81    0 0xffffff7f80bec000 0x11000    0x11000    com.apple.driver.ACPI_SMC_PlatformPlugin (4.7.5d4) <80 79 9 8 7 6 5 4 3>

82    0 0xffffff7f81b0d000 0xf000     0xf000     com.apple.driver.ApplePolicyControl (3.0.16) <75 72 67 9 8 7 5 4 3 1>

83    2 0xffffff7f8135c000 0x6000     0x6000     com.apple.kext.OSvKernDSPLib (1.3) <5 4>

84    4 0xffffff7f81362000 0x2a000    0x2a000    com.apple.iokit.IOAudioFamily (1.8.6fc6) <83 5 4 3 1>

85    0 0xffffff7f8138c000 0x4000     0x4000     com.apple.driver.AudioIPCDriver (1.2.2) <84 5 4 3 1>

86    0 0xffffff7f812a6000 0x5000     0x5000     com.apple.Dont_Steal_Mac_OS_X (7.0.0) <80 7 4 3 1>

87    2 0xffffff7f81931000 0xc000     0xc000     com.apple.iokit.IOHDAFamily (2.1.7f9) <5 4 3 1>

88    1 0xffffff7f8196c000 0x1a000    0x1a000    com.apple.driver.AppleHDAController (2.1.7f9) <87 67 9 6 5 4 3 1>

89    1 0xffffff7f80d76000 0x5000     0x5000     com.apple.iokit.IOEthernetAVBController (1.0.0d5) <37 5 4 3 1>

90    0 0xffffff7f80d7b000 0x9000     0x9000     com.apple.iokit.IOAVBFamily (1.0.0d22) <89 37 5 4 3 1>

91    1 0xffffff7f80b66000 0xe000     0xe000     com.apple.iokit.IOSerialFamily (10.0.5) <7 6 5 4 3 1>

92    0 0xffffff7f80d49000 0xe000     0xe000     com.apple.iokit.IOBluetoothSerialManager (4.0.3f12) <91 7 5 4 3 1>

93    0 0xffffff7f816c2000 0x5000     0x5000     com.apple.driver.AppleSMCLMU (2.0.1d2) <80 67 5 4 3>

94    0 0xffffff7f80b50000 0x12000    0x12000    com.apple.iokit.IOSurface (80.0) <7 5 4 3 1>

95    0 0xffffff7f809af000 0x6000     0x6000     com.apple.iokit.IOUserEthernet (1.0.0d1) <37 6 5 4 3 1>

96    0 0xffffff7f817e2000 0xe1000    0xe1000    com.apple.driver.AppleIntelHD3000Graphics (7.1.8) <72 67 9 7 5 4 3 1>

97    1 0xffffff7f816cc000 0xe000     0xe000     com.apple.driver.AppleSMBusController (1.0.10d0) <22 9 8 5 4 3>

98    0 0xffffff7f81afb000 0xb000     0xb000     com.apple.driver.AGPM (100.12.42) <72 67 9 5 4 3>

100    0 0xffffff7f8174b000 0x4000     0x4000     com.apple.driver.ApplePlatformEnabler (2.0.4d2) <7 5 4 3>

101    0 0xffffff7f81392000 0x5000     0x5000     com.apple.driver.AudioAUUC (1.59) <84 67 9 8 7 5 4 3 1>

102    0 0xffffff7f81b77000 0xa000     0xa000     com.apple.driver.AppleAVBAudio (1.0.0d11) <5 4 3 1>

103    0 0xffffff7f8176c000 0xa000     0xa000     com.apple.driver.AppleMCCSControl (1.0.26) <67 9 7 5 4 3 1>

104    0 0xffffff7f81601000 0x5000     0x5000     com.apple.driver.AppleUpstreamUserClient (3.5.9) <67 9 8 7 5 4 3 1>

105    0 0xffffff7f8193d000 0x22000    0x22000    com.apple.driver.AppleMikeyDriver (2.1.7f9) <97 8 5 4 3 1>

106    1 0xffffff7f81986000 0xa4000    0xa4000    com.apple.driver.DspFuncLib (2.1.7f9) <84 83 5 4 3 1>

107    0 0xffffff7f81a2a000 0xaf000    0xaf000    com.apple.driver.AppleHDA (2.1.7f9) <106 88 87 84 72 67 6 5 4 3 1>

109    0 0xffffff7f81761000 0x3000     0x3000     com.apple.driver.AppleMikeyHIDDriver (122) <27 7 4 3 1>

110    1 0xffffff7f8134c000 0x5000     0x5000     com.apple.kext.triggers (1.0) <7 6 5 4 3 1>

111    0 0xffffff7f81351000 0x9000     0x9000     com.apple.filesystems.autofs (3.0) <110 7 6 5 4 3 1>

116    3 0xffffff7f80b8a000 0xd000     0xd000     com.apple.iokit.IOCDStorageFamily (1.7) <12 5 4 3 1>

117    2 0xffffff7f80b97000 0xb000     0xb000     com.apple.iokit.IODVDStorageFamily (1.7) <116 12 5 4 3 1>

118    1 0xffffff7f80ba2000 0xa000     0xa000     com.apple.iokit.IOBDStorageFamily (1.6) <117 116 12 5 4 3 1>

119    0 0xffffff7f80bac000 0x1a000    0x1a000    com.apple.iokit.IOSCSIMultimediaCommandsDevice (3.0.3) <118 117 116 64 12 5 4 3 1>

121    0 0xffffff7f81911000 0x5000     0x5000     com.apple.driver.AppleHWSensor (1.9.4d0) <5 4 3>

122    7 0xffffff7f81c20000 0x46000    0x46000    com.apple.iokit.AppleProfileFamily (85.2) <9 7 6 5 4 3 1>

123    0 0xffffff7f81c66000 0x7000     0x7000     com.apple.driver.AppleIntelProfile (85.2) <122 6 4 3>

124    0 0xffffff7f81c6f000 0x4000     0x4000     com.apple.driver.AppleProfileCallstackAction (85.2) <122 6 5 4 3 1>

125    0 0xffffff7f81c73000 0x3000     0x3000     com.apple.driver.AppleProfileKEventAction (85.2) <122 4 3 1>

126    0 0xffffff7f81c76000 0x4000     0x4000     com.apple.driver.AppleProfileReadCounterAction (85.2) <122 6 4 3>

127    0 0xffffff7f81c7a000 0x3000     0x3000     com.apple.driver.AppleProfileRegisterStateAction (85.2) <122 4 3 1>

128    0 0xffffff7f81c7d000 0x4000     0x4000     com.apple.driver.AppleProfileThreadInfoAction (85.2) <122 6 4 3 1>

129    0 0xffffff7f81c81000 0x4000     0x4000     com.apple.driver.AppleProfileTimestampAction (85.2) <122 5 4 3 1>

130    0 0xffffff7f80807000 0xc000     0xc000     com.apple.nke.ppp (1.7) <7 6 5 4 3 1>

313    0 0xffffff7f808ff000 0x2000     0x2000     com.apple.driver.AppleUSBODD (3.0.1) <65 64 30 12 5 4 3 1>

315    0 0xffffff7f8147b000 0x35000    0x35000    com.apple.filesystems.udf (2.2) <7 5 4 1>
XNU is not a microkernel (p. 50) - Windows Internals book also mentions that about itself at the beginning
u-area (p. 52) - in Windows the equivalent can be TEB and PEB structures
UBC (p. 52) - looks like in Windows we have the same unification of file cache and virtual memory subsystems
Posted in Notes on Mac OS X Internals, Reading Notebook | No Comments »
May 10th, 2012
Memorandum - when memory ran dump.
Examples: We got a few memorandums from that market leader.
- Dmitry Vostokov @ DumpAnalysis.org + TraceAnalysis.org -
Posted in Debugging, Debugging Slang, Fun with Crash Dumps, Fun with Debugging | No Comments »
May 9th, 2012
This is a Mac OS X / GDB counterpart to Spiking Thread pattern previously described for Windows platforms:
(gdb) info threads

4 0×00007fff85b542df in sqrt$fenv_access_off ()

3 0×00007fff8616ee42 in __semwait_signal ()

2 0×00007fff8616ee42 in __semwait_signal ()

* 1 0×00007fff8616ee42 in __semwait_signal ()
We notice a non-waiting thread and switch to it:
(gdb) thread 4

[Switching to thread 4 (core thread 3)]

0x00007fff85b542df in sqrt$fenv_access_off ()
(gdb) bt

#0  0x00007fff85b542df in sqrt$fenv_access_off ()

#1  0×000000010cc85dc9 in thread_three (arg=0×7fff6c884ac0)

#2  0×00007fff8fac68bf in _pthread_start ()

#3  0×00007fff8fac9b75 in thread_start ()
If we disassemble the return address for thread_three function to come back from sqrt call we see an infinite loop:
(gdb) disass 0x000000010cc85dc9

Dump of assembler code for function thread_three:

0x000000010cc85db0 <thread_three+0>:	push   %rbp

0×000000010cc85db1 <thread_three+1>:	mov    %rsp,%rbp

0×000000010cc85db4 <thread_three+4>:	sub    $0×10,%rsp

0×000000010cc85db8 <thread_three+8>:	mov    %rdi,-0×10(%rbp)

0×000000010cc85dbc <thread_three+12>:	mov    -0×10(%rbp),%ax

0×000000010cc85dc0 <thread_three+16>:	movsd  (%rax),%xmm0

0×000000010cc85dc4 <thread_three+20>:	callq  0×10cc85eac <dyld_stub_sqrt>

0×000000010cc85dc9 <thread_three+25>:	mov    -0×10(%rbp),%rax

0×000000010cc85dcd <thread_three+29>:	movsd  %xmm0,(%rax)

0×000000010cc85dd1 <thread_three+33>:	jmpq   0×10cc85dbc <thread_three+12>

End of assembler dump.
Here’s the source code of the modeling application:
void * thread_one (void *arg)
{
while (1)
{
sleep (1);
}
return 0;
}
void * thread_two (void *arg)
{
while (1)
{
sleep (2);
}
return 0;
}
void * thread_three (void *arg)
{
while (1)
{
*(double*)arg=sqrt(*(double *)arg);
}
return 0;
}
int main(int argc, const char * argv[])
{
pthread_t threadID_one, threadID_two, threadID_three;
double result = 0xffffffff;
pthread_create (&threadID_one, NULL, thread_one, NULL);
pthread_create (&threadID_two, NULL, thread_two, NULL);
pthread_create (&threadID_three, NULL, thread_three,
&result);
pthread_join(threadID_three, NULL);
return 0;
}
- Dmitry Vostokov @ DumpAnalysis.org + TraceAnalysis.org -
Forthcoming Training: Accelerated Mac OS X Core Dump Analysis
Posted in Assembly Language, Core Dump Analysis, Crash Dump Analysis, Crash Dump Patterns, Debugging, GDB for WinDbg Users, Mac Crash Corner, Mac OS X, Software Defect Construction, x64 Mac OS X | No Comments »
May 3rd, 2012
This is a Mac OS X / GDB counterpart to NULL Pointer (code) pattern previously described for Windows platforms:
(gdb) bt

#0  0×0000000000000000 in ?? ()

#1  0×000000010e8cce73 in bar (ps=0×7fff6e4cbac0)

#2  0×000000010e8cce95 in foo (ps=0×7fff6e4cbac0)

#3  0×000000010e8cced5 in main (argc=1, argv=0×7fff6e4cbb08)
(gdb) disass  0×000000010e8cce73-3  0×000000010e8cce73

Dump of assembler code from 0×10e8cce70 to 0×10e8cce73:

0×000000010e8cce70 :	callq  *0×8(%rdi)

End of assembler dump.
(gdb) info r rdi

rdi            0x7fff6e4cbac0	140735043910336
(gdb) x/2 0x7fff6e4cbac0

0x7fff6e4cbac0:	0x0000000a	0×00000000
(gdb) p/x *($rdi+8)

$7 = 0×0
(gdb) bt

#0  0x0000000000000000 in ?? ()

#1  0x000000010e8cce73 in bar (ps=0×7fff6e4cbac0)

#2  0×000000010e8cce95 in foo (ps=0×7fff6e4cbac0)

#3  0×000000010e8cced5 in main (argc=1, argv=0×7fff6e4cbb08)
(gdb) ptype MYSTRUCT

type = struct _MyStruct_tag {

int data;

PFUNC pfunc;

}
(gdb) print {MYSTRUCT}0×7fff6e4cbac0

$2 = {data = 10, pfunc = 0}
Here’s the source code of the modeling application:
typedef void (*PFUNC)(void);
typedef struct _MyStruct_tag
{
int data;
PFUNC pfunc;
} MYSTRUCT;
void bar(MYSTRUCT *ps)
{
ps->pfunc();
}
void foo(MYSTRUCT *ps)
{
bar(ps);
}
int main(int argc, const char * argv[])
{
MYSTRUCT pstruct = {10, NULL};
foo(&pstruct);
return 0;
}
- Dmitry Vostokov @ DumpAnalysis.org + TraceAnalysis.org -
Forthcoming Training: Accelerated Mac OS X Core Dump Analysis
Posted in Assembly Language, Core Dump Analysis, Crash Dump Analysis, Crash Dump Patterns, Debugging, GDB for WinDbg Users, Mac Crash Corner, Mac OS X, Software Defect Construction, x64 Mac OS X | No Comments »
May 1st, 2012
; Composed a verse for today
Labour Day
First of May
Analyze
Today
; Plan to analyze from 32 to 64 dumps
- Dmitry Vostokov @ DumpAnalysis.org + TraceAnalysis.org -
Posted in Fun with Crash Dumps, Fun with Debugging | 2 Comments »
April 30th, 2012
It is hard to write a review of this book because I have been reading it sporadically for more than 2 years and just finished today. When I bought it I didn’t know much about Christianity and it various branches (as being educated in secular Soviet Union) so it was difficult reading due to many historical and theological facts. Now I plan to watch DVD series from the same author and already started reading multi-volume sets such as History of the Christian Church (Schaff, Protestant perspective), Studies in Church History (Parsons, Catholic perspective) and waiting for arrival of 9 volumes of Cambridge History of Christianity bought with a great discount from Folio Society.
Just a small note that the last chapters were brief but very enlightening, for example, last pages about the disappearing of Hell and the appearing of burning (cremation).
Christianity: The First Three Thousand Years

PS. Actually learning about Christian faith helped me to deeply understand my own Memory Religion (Memorianity) with its conception of original memory defect: Memory Religion: A Core Testament of Memorianity (with an old original cover below)

- Dmitry Vostokov @ LiterateScientist.com -
Posted in From Cover To Cover, History, Reading List 2012, Religion, Reviewed on Amazon, Theology | No Comments »
April 30th, 2012
As we started providing memory dump analysis pattern examples for Mac OS X we resume our table of command correspondence between WinDbg and GDB providing some corrections on the way. For example, in the previous version of table we omitted a correspondence to ub WinDbg command. Now we provide such an equivalent:
(gdb) bt

[...]

#1  0×000000010e8cce73 in bar (ps=0×7fff6e4cbac0)

[…]
(gdb) disas 0×000000010e8cce73-10 0×000000010e8cce73

Dump of assembler code from 0×10e8cce69 to 0×10e8cce73:

0×000000010e8cce69 :	mov    %edi,-0×8(%rbp)

0×000000010e8cce6c :	mov    -0×8(%rbp),%rdi

0×000000010e8cce70 :	callq  *0×8(%rdi)

End of assembler dump.
Please note that the beginning of assembly will be dependent on how good we guessed the offset:
(gdb) disas 0x000000010e8cce73-0×10 0×000000010e8cce73

Dump of assembler code from 0×10e8cce63 to 0×10e8cce73:

0×000000010e8cce63 :	in     $0×48,%eax

0×000000010e8cce65 :	sub    $0×10,%esp

0×000000010e8cce68 :	mov    %rdi,-0×8(%rbp)

0×000000010e8cce6c :	mov    -0×8(%rbp),%rdi

0×000000010e8cce70 :	callq  *0×8(%rdi)

End of assembler dump.
(gdb) disas 0x000000010e8cce73-0×13 0×000000010e8cce73

Dump of assembler code from 0×10e8cce60 to 0×10e8cce73:

0×000000010e8cce60 :	push   %rbp

0×000000010e8cce61 :	mov    %rsp,%rbp

0×000000010e8cce64 :	sub    $0×10,%rsp

0×000000010e8cce68 :	mov    %rdi,-0×8(%rbp)

0×000000010e8cce6c :	mov    -0×8(%rbp),%rdi

0×000000010e8cce70 :	callq  *0×8(%rdi)

End of assembler dump.
However, we can ignore that because our goal is to check whether a CPU instruction before a return address is a call.
Additional commands we add are x/<N>bc for db (WinDbg), thread <N> for ~<N>s (WinDbg, process dumps), maintenance info sections for for !address (WinDbg), add-symbol-file for .reload (WinDbg), info r for r (WinDbg).
Action                      | GDB                 | WinDbg
----------------------------------------------------------------
Start the process           | run                 | g
Exit                        | (q)uit              | q
Disassemble (forward)       | (disas)semble       | uf, u
Disassemble N instructions  | x/<N>i              | -
Disassemble (backward)      | disas <a-o> <a>     | ub
Stack trace                 | backtrace (bt)      | k
Full stack trace            | bt full             | kv
Stack trace with parameters | bt full             | kP
Partial trace (innermost)   | bt <N>              | k <N>
Partial trace (outermost)   | bt -<N>             | -
Stack trace for all threads | thread apply all bt | ~*k
Breakpoint                  | break               | bp
Frame numbers               | any bt command      | kn
Select frame                | frame               | .frame
Display parameters          | info args           | dv /t /i /V
Display locals              | info locals         | dv /t /i /V
Dump byte char array        | x/<N>bc             | db
Switch to thread            | thread <N>          | ~<N>s
Sections/regions            | maint info sections | !address
Load symbol file            | add-symbol-file     | .reload
CPU registers               | i(nfo) r            | r
Now an advertisement command:
(gdb) info training

(gdb) Accelerated Mac OS X Core Dump Analysis training
- Dmitry Vostokov @ DumpAnalysis.org + TraceAnalysis.org -
Posted in Core Dump Analysis, Crash Dump Analysis, Debugging, GDB for WinDbg Users, Linux Crash Corner, Mac Crash Corner, Mac OS X, WinDbg for GDB Users | 1 Comment »
April 28th, 2012
This is a special variant of Blocked Thread pattern where we have a timeout value so a thread is potentially blocked only temporarily. For example, this main thread is blocked waiting for beep sound to finish after a minute:
0:000> kvL

ChildEBP RetAddr  Args to Child

0291f354 7c90d21a 7c8023f1 00000001 0291f388 ntdll!KiFastSystemCallRet

0291f358 7c8023f1 00000001 0291f388 7c90d27e ntdll!NtDelayExecution+0xc

0291f3b0 7c837beb 0000ea60 00000001 00000004 kernel32!SleepEx+0×61

0291f404 004952a2 00000370 0000ea60 004d6ae2 kernel32!Beep+0×1b3

0291f410 004d6ae2 00000370 0000ea60 004d6ed4 Application!DoBeep+0×16

[…]

0291ffec 00000000 0045aad0 00e470a0 00000000 kernel32!BaseThreadStart+0×37
0:000> ? ea60/0n1000

Evaluate expression: 60 = 0000003c
- Dmitry Vostokov @ DumpAnalysis.org + TraceAnalysis.org -
Posted in Crash Dump Analysis, Crash Dump Patterns | No Comments »
April 28th, 2012
Sometimes I hear voices saying that Linux, FreeBSD, and Mac OS X core dumps are uninteresting. This is not true. If you haven’t seen anything interesting there it just simply means you have only encountered a limited amount of abnormal software behaviour. The widespread usage of Windows OS means that most patterns have been diagnosed and described first and other OS are waiting their turn.
My goal is to have a pattern catalog with examples from different OS. For example, currently, all Mac OS X patterns I provide are just examples to existing Windows pattern names. All OS share the same structure and behavior, for example, structural memory analysis patterns and the same computational model. Although structural patterns are different from behavioral patterns I also plan to expand the structural list significantly especially in relation to forthcoming Windows malware analysis training. Regarding behavioral patterns it is possible to model and predict specific pattern examples for another OS by using already existing catalog.
- Dmitry Vostokov @ DumpAnalysis.org + TraceAnalysis.org -
Posted in Core Dump Analysis, Crash Dump Analysis, Crash Dump Patterns, Linux Crash Corner, Mac Crash Corner, Mac OS X, Malware Analysis, Malware Patterns, Pattern Models, Pattern Prediction, Pattern-Driven Debugging, Pattern-Driven Software Support, Software Behavior DNA, Software Behavior Patterns, Software Behavioral Genome, Software Diagnostics | No Comments »
April 28th, 2012
This is an example of Punctuated Memory Leak pattern somewhat similar to a large block allocation leak for process heap (see a modeling example). An application has some functionality and after each command its commited memory was increasing by 50 - 60 Mb. 3 process dumps were taken with one before failures and then after each failure:
// Before failures
0:000> !address -summary
--- Usage Summary ---------------- RgnCount ----------- Total Size -------- %ofBusy %ofTotal

Free                                    267          76c50000 (   1.856 Gb)           92.79%

<unclassified>                          270           4d6f000 (  77.434 Mb)  52.45%    3.78%

Image                                   620           31bf000 (  49.746 Mb)  33.70%    2.43%

Stack                                    60           1400000 (  20.000 Mb)  13.55%    0.98%

ActivationContextData                    48             35000 ( 212.000 kb)   0.14%    0.01%

NlsTables                                 1             23000 ( 140.000 kb)   0.09%    0.01%

TEB                                      20             14000 (  80.000 kb)   0.05%    0.00%

CsrSharedMemory                           1              5000 (  20.000 kb)   0.01%    0.00%

PEB                                       1              1000 (   4.000 kb)   0.00%    0.00%
--- Type Summary (for busy) ------ RgnCount ----------- Total Size -------- %ofBusy %ofTotal

MEM_PRIVATE                             296           3bca000 (  59.789 Mb)  40.50%    2.92%

MEM_IMAGE                               647           340c000 (  52.047 Mb)  35.26%    2.54%

MEM_MAPPED                               78           23ca000 (  35.789 Mb)  24.24%    1.75%
--- State Summary ---------------- RgnCount ----------- Total Size -------- %ofBusy %ofTotal

MEM_FREE                                267          76c50000 (   1.856 Gb)           92.79%

MEM_RESERVE                             125           5006000 (  80.023 Mb)  54.21%    3.91%

MEM_COMMIT                              896           439a000 (  67.602 Mb)  45.79%    3.30%
--- Protect Summary (for commit) - RgnCount ----------- Total Size -------- %ofBusy %ofTotal

PAGE_EXECUTE_READ                       125           1f2c000 (  31.172 Mb)  21.12%    1.52%

PAGE_READONLY                           363           1ee5000 (  30.895 Mb)  20.93%    1.51%

PAGE_READWRITE                          309            4c2000 (   4.758 Mb)   3.22%    0.23%

PAGE_WRITECOPY                           43             6a000 ( 424.000 kb)   0.28%    0.02%

PAGE_READWRITE|PAGE_GUARD                40             4b000 ( 300.000 kb)   0.20%    0.01%

PAGE_EXECUTE_READWRITE                   15             11000 (  68.000 kb)   0.04%    0.00%

PAGE_EXECUTE                              1              1000 (   4.000 kb)   0.00%    0.00%
--- Largest Region by Usage ----------- Base Address -------- Region Size ----------

Free                                         6130000          5fb70000 (   1.496 Gb)

<unclassified>                                abf000           13d1000 (  19.816 Mb)

Image                                       75141000            879000 (   8.473 Mb)

Stack                                        3290000             fd000 (1012.000 kb)

ActivationContextData                          50000              4000 (  16.000 kb)

NlsTables                                   7efb0000             23000 ( 140.000 kb)

TEB                                         7ef6f000              1000 (   4.000 kb)

CsrSharedMemory                             7efe0000              5000 (  20.000 kb)

PEB                                         7efde000              1000 (   4.000 kb)
// After the 1st failure
0:000> !address -summary
--- Usage Summary ---------------- RgnCount ----------- Total Size -------- %ofBusy %ofTotal

Free                                    267          7388c000 (   1.805 Gb)           90.26%

<unclassified>                          272           8133000 ( 129.199 Mb)  64.80%    6.31%

Image                                   614           31bf000 (  49.746 Mb)  24.95%    2.43%

Stack                                    60           1400000 (  20.000 Mb)  10.03%    0.98%

ActivationContextData                    48             35000 ( 212.000 kb)   0.10%    0.01%

NlsTables                                 1             23000 ( 140.000 kb)   0.07%    0.01%

TEB                                      20             14000 (  80.000 kb)   0.04%    0.00%

CsrSharedMemory                           1              5000 (  20.000 kb)   0.01%    0.00%

PEB                                       1              1000 (   4.000 kb)   0.00%    0.00%
--- Type Summary (for busy) ------ RgnCount ----------- Total Size -------- %ofBusy %ofTotal

MEM_PRIVATE                             297           6f8e000 ( 111.555 Mb)  55.95%    5.45%

MEM_IMAGE                               642           340c000 (  52.047 Mb)  26.10%    2.54%

MEM_MAPPED                               78           23ca000 (  35.789 Mb)  17.95%    1.75%
--- State Summary ---------------- RgnCount ----------- Total Size -------- %ofBusy %ofTotal

MEM_FREE                                267          7388c000 (   1.805 Gb)           90.26%

MEM_COMMIT                              892           775e000 ( 119.367 Mb)  59.87%    5.83%

MEM_RESERVE                             125           5006000 (  80.023 Mb)  40.13%    3.91%
--- Protect Summary (for commit) - RgnCount ----------- Total Size -------- %ofBusy %ofTotal

PAGE_READWRITE                          314           38a3000 (  56.637 Mb)  28.40%    2.77%

PAGE_EXECUTE_READ                       125           1f2c000 (  31.172 Mb)  15.63%    1.52%

PAGE_READONLY                           363           1ee5000 (  30.895 Mb)  15.49%    1.51%

PAGE_WRITECOPY                           34             4d000 ( 308.000 kb)   0.15%    0.01%

PAGE_READWRITE|PAGE_GUARD                40             4b000 ( 300.000 kb)   0.15%    0.01%

PAGE_EXECUTE_READWRITE                   15             11000 (  68.000 kb)   0.03%    0.00%

PAGE_EXECUTE                              1              1000 (   4.000 kb)   0.00%    0.00%
--- Largest Region by Usage ----------- Base Address -------- Region Size ----------

Free                                         94f4000          5c7ac000 (   1.445 Gb)

<unclassified>                               6130000           33c4000 (  51.766 Mb)

Image                                       75141000            879000 (   8.473 Mb)

Stack                                        3290000             fd000 (1012.000 kb)

ActivationContextData                          50000              4000 (  16.000 kb)

NlsTables                                   7efb0000             23000 ( 140.000 kb)

TEB                                         7ef6f000              1000 (   4.000 kb)

CsrSharedMemory                             7efe0000              5000 (  20.000 kb)

PEB                                         7efde000              1000 (   4.000 kb)
0:000> !address -f:VAR
BaseAddr EndAddr+1 RgnSize     Type       State                 Protect             Usage

-------------------------------------------------------------------------------------------

[...]

5e82000  5f70000    ee000 MEM_PRIVATE MEM_RESERVE                                    <unclassified>

6130000  94f4000  33c4000 MEM_PRIVATE MEM_COMMIT  PAGE_READWRITE                     <unclassified>

74220000 74221000     1000 MEM_IMAGE   MEM_COMMIT  PAGE_READONLY                      <unclassified>

[…]
0:000> ? 33c4000/0n1024

Evaluate expression: 53008 = 0000cf10
// After the 2nd failure
0:000> !address -summary
--- Usage Summary ---------------- RgnCount ----------- Total Size -------- %ofBusy %ofTotal

Free                                    268          704c8000 (   1.755 Gb)           87.74%

<unclassified>                          273           b4f7000 ( 180.965 Mb)  72.05%    8.84%

Image                                   614           31bf000 (  49.746 Mb)  19.81%    2.43%

Stack                                    60           1400000 (  20.000 Mb)   7.96%    0.98%

ActivationContextData                    48             35000 ( 212.000 kb)   0.08%    0.01%

NlsTables                                 1             23000 ( 140.000 kb)   0.05%    0.01%

TEB                                      20             14000 (  80.000 kb)   0.03%    0.00%

CsrSharedMemory                           1              5000 (  20.000 kb)   0.01%    0.00%

PEB                                       1              1000 (   4.000 kb)   0.00%    0.00%
--- Type Summary (for busy) ------ RgnCount ----------- Total Size -------- %ofBusy %ofTotal

MEM_PRIVATE                             298           a352000 ( 163.320 Mb)  65.03%    7.97%

MEM_IMAGE                               642           340c000 (  52.047 Mb)  20.72%    2.54%

MEM_MAPPED                               78           23ca000 (  35.789 Mb)  14.25%    1.75%
--- State Summary ---------------- RgnCount ----------- Total Size -------- %ofBusy %ofTotal

MEM_FREE                                268          704c8000 (   1.755 Gb)           87.74%

MEM_COMMIT                              893           ab22000 ( 171.133 Mb)  68.14%    8.36%

MEM_RESERVE                             125           5006000 (  80.023 Mb)  31.86%    3.91%
--- Protect Summary (for commit) - RgnCount ----------- Total Size -------- %ofBusy %ofTotal

PAGE_READWRITE                          315           6c67000 ( 108.402 Mb)  43.16%    5.29%

PAGE_EXECUTE_READ                       125           1f2c000 (  31.172 Mb)  12.41%    1.52%

PAGE_READONLY                           363           1ee5000 (  30.895 Mb)  12.30%    1.51%

PAGE_WRITECOPY                           34             4d000 ( 308.000 kb)   0.12%    0.01%

PAGE_READWRITE|PAGE_GUARD                40             4b000 ( 300.000 kb)   0.12%    0.01%

PAGE_EXECUTE_READWRITE                   15             11000 (  68.000 kb)   0.03%    0.00%

PAGE_EXECUTE                              1              1000 (   4.000 kb)   0.00%    0.00%
--- Largest Region by Usage ----------- Base Address -------- Region Size ----------

Free                                         c8c4000          593dc000 (   1.394 Gb)

<unclassified>                               6130000           33c4000 (  51.766 Mb)

Image                                       75141000            879000 (   8.473 Mb)

Stack                                        3290000             fd000 (1012.000 kb)

ActivationContextData                          50000              4000 (  16.000 kb)

NlsTables                                   7efb0000             23000 ( 140.000 kb)

TEB                                         7ef6f000              1000 (   4.000 kb)

CsrSharedMemory                             7efe0000              5000 (  20.000 kb)

PEB                                         7efde000              1000 (   4.000 kb)
0:000> !address -f:VAR
BaseAddr EndAddr+1 RgnSize     Type       State                 Protect             Usage

-------------------------------------------------------------------------------------------

5e82000  5f70000    ee000 MEM_PRIVATE MEM_RESERVE                                    <unclassified>

6130000  94f4000  33c4000 MEM_PRIVATE MEM_COMMIT  PAGE_READWRITE                     <unclassified>

9500000  c8c4000  33c4000 MEM_PRIVATE MEM_COMMIT  PAGE_READWRITE                     <unclassified>

74220000 74221000     1000 MEM_IMAGE   MEM_COMMIT  PAGE_READONLY                      <unclassified>

[…]
The name of this pattern comes from the process of discrete large memory allocations that happen after specific actions or events. Between them there is no visible or substantial increase in memory usage.
- Dmitry Vostokov @ DumpAnalysis.org + TraceAnalysis.org -
Posted in Crash Dump Analysis, Crash Dump Patterns, Debugging | No Comments »
April 23rd, 2012
The cover of the latest Economist issue arrived today picturing a third industrial revolution prompted me to write about Software as means of production that I was thinking for sometime and even created a Software Generalist Party you are welcome to join. Software generalists are the future driving force of society change and I started working on a work comparable to Marx’s Capital called Software, Volume 1 subtitled as A Critical Analysis of Industrial Production (ISBN: 978-1908043375). It will also include an analysis of new emerging commodities such as memories.
Posted in Announcements, Books, Software and Business, Software and Economics, Software and Engineering, Software and Future, Software and History, Software and Industrial Production, Software and Philosophy, Software and Politics, Software and Science, Software and Sociology | No Comments »
April 22nd, 2012
This is a provisional Mac OS X example of Shared Buffer Overwrite pattern. Originally I wanted to construct a default C runtime heap corruption example using malloc / free functions. Unfortunately I couldn’t get heap corrupted easily as was possible in Windows Visual C++ environment by writing before or after allocated block. Desperately I printed allocated pointers and they all pointed to memory blocks laid out one after another without any headers in between (could be just a default Apple LLVM C runtime implementation and I have to check that with GCC). Therefore, any subsequent reallocation didn’t cause corruption either. So all this naturally fits into shared buffer overwrites or underwrites where corruption is only detectable when the overwritten data is used such as a pointer dereference.
int main(int argc, const char * argv[])
{
char *p1 = (char *) malloc (1024);
strcpy(p1, “Hello World!”);
printf(“p1 = %p\n”, p1);
printf(“*p1 = %s\n”, p1);
char *p2 = (char *) malloc (1024);
strcpy(p2, “Hello World!”);
printf(“p2 = %p\n”, p2);
printf(“*p2 = %s\n”, p2);
char *p3 = (char *) malloc (1024);
strcpy(p3, “Hello World!”);
printf(“p3 = %p\n”, p3);
printf(“*p3 = %s\n”, p3);
strcpy(p2-sizeof(p2), “Hello Crash!”);
strcpy(p3-sizeof(p3), “Hello Crash!”);
p2 = (char *)realloc(p2, 2048);
printf(“p2 = %p\n”, p2);
printf(“*p2 = %s\n”, p2);
char *p4 = (char *) malloc (1024);
strcpy(p4-sizeof(p4), “Hello Crash!”);
printf(“p4 = %p\n”, p4);
printf(“*p4 = %s\n”, p4);
p3 = (char *)realloc(p3, 2048);
printf(“p3 = %p\n”, p3);
printf(“*p3 = %s\n”, p3);
char *p5 = NULL; // to force a core dump
*p5 = 0;
free (p4);
free (p3);
free (p2);
free (p1);
return 0;
}
When we run the program above we get this output:
p1 = 0x7fc6d9000000

*p1 = Hello World!

p2 = 0×7fc6d9001400

*p2 = Hello World!

p3 = 0×7fc6d9001800

*p3 = Hello World!

p2 = 0×7fc6d9001c00

*p2 = ash!

p4 = 0×7fc6d9001400

*p4 = ash!

p3 = 0×7fc6d9002400

*p3 = ash!

Segmentation fault: 11 (core dumped)
Now is GDB output:
(gdb) x/1024bc p1

0x7fc6d9000000:	72 ‘H’	101 ‘e’	108 ‘l’	108 ‘l’	111 ‘o’	32 ‘ ‘	87 ‘W’	111 ‘o’

0×7fc6d9000008:	114 ‘r’	108 ‘l’	100 ‘d’	33 ‘!’	0 ‘\0′	0 ‘\0′	0 ‘\0′	0 ‘\0′

0×7fc6d9000010:	0 ‘\0′	0 ‘\0′	0 ‘\0′	0 ‘\0′	0 ‘\0′	0 ‘\0′	0 ‘\0′	0 ‘\0′

[…]

0×7fc6d90003e8:	0 ‘\0′	0 ‘\0′	0 ‘\0′	0 ‘\0′	0 ‘\0′	0 ‘\0′	0 ‘\0′	0 ‘\0′

0×7fc6d90003f0:	0 ‘\0′	0 ‘\0′	0 ‘\0′	0 ‘\0′	0 ‘\0′	0 ‘\0′	0 ‘\0′	0 ‘\0′

0×7fc6d90003f8:	0 ‘\0′	0 ‘\0′	0 ‘\0′	0 ‘\0′	0 ‘\0′	0 ‘\0′	0 ‘\0′	0 ‘\0′

(gdb) x/32bc p1+1024-sizeof(p1)

0×7fc6d90003f8:	0 ‘\0′	0 ‘\0′	0 ‘\0′	0 ‘\0′	0 ‘\0′	0 ‘\0′	0 ‘\0′	0 ‘\0′

0×7fc6d9000400:	42 ‘*’	112 ‘p’	51 ‘3′	32 ‘ ‘	61 ‘=’	32 ‘ ‘	97 ‘a’	115 ’s’

0×7fc6d9000408:	104 ‘h’	33 ‘!’	10 ‘\n’	100 ‘d’	57 ‘9′	48 ‘0′	48 ‘0′	50 ‘2′

0×7fc6d9000410:	52 ‘4′	48 ‘0′	48 ‘0′	10 ‘\n’	0 ‘\0′	0 ‘\0′	0 ‘\0′	0 ‘\0′

(gdb) x/2048bc p2

0×7fc6d9001c00:	97 ‘a’	115 ’s’	104 ‘h’	33 ‘!’	0 ‘\0′	32 ‘ ‘	87 ‘W’	111 ‘o’

0×7fc6d9001c08:	114 ‘r’	108 ‘l’	100 ‘d’	33 ‘!’	0 ‘\0′	0 ‘\0′	0 ‘\0′	0 ‘\0′

0×7fc6d9001c10:	0 ‘\0′	0 ‘\0′	0 ‘\0′	0 ‘\0′	0 ‘\0′	0 ‘\0′	0 ‘\0′	0 ‘\0′

[…]

0×7fc6d9001fe8:	0 ‘\0′	0 ‘\0′	0 ‘\0′	0 ‘\0′	0 ‘\0′	0 ‘\0′	0 ‘\0′	0 ‘\0′

0×7fc6d9001ff0:	0 ‘\0′	0 ‘\0′	0 ‘\0′	0 ‘\0′	0 ‘\0′	0 ‘\0′	0 ‘\0′	0 ‘\0′

0×7fc6d9001ff8:	72 ‘H’	101 ‘e’	108 ‘l’	108 ‘l’	111 ‘o’	32 ‘ ‘	67 ‘C’	114 ‘r’

0×7fc6d9002000:	0 ‘\0′	0 ‘\0′	0 ‘\0′	0 ‘\0′	0 ‘\0′	0 ‘\0′	0 ‘\0′	0 ‘\0′

0×7fc6d9002008:	0 ‘\0′	0 ‘\0′	0 ‘\0′	0 ‘\0′	0 ‘\0′	0 ‘\0′	0 ‘\0′	0 ‘\0′

[…]

0×7fc6d90023e8:	0 ‘\0′	0 ‘\0′	0 ‘\0′	0 ‘\0′	0 ‘\0′	0 ‘\0′	0 ‘\0′	0 ‘\0′

0×7fc6d90023f0:	0 ‘\0′	0 ‘\0′	0 ‘\0′	0 ‘\0′	0 ‘\0′	0 ‘\0′	0 ‘\0′	0 ‘\0′

0×7fc6d90023f8:	0 ‘\0′	0 ‘\0′	0 ‘\0′	0 ‘\0′	0 ‘\0′	0 ‘\0′	0 ‘\0′	0 ‘\0′

(gdb) x/64bc p2-sizeof(p2)

0×7fc6d9001bf8:	0 ‘\0′	0 ‘\0′	0 ‘\0′	0 ‘\0′	0 ‘\0′	0 ‘\0′	0 ‘\0′	0 ‘\0′

0×7fc6d9001c00:	97 ‘a’	115 ’s’	104 ‘h’	33 ‘!’	0 ‘\0′	32 ‘ ‘	87 ‘W’	111 ‘o’

0×7fc6d9001c08:	114 ‘r’	108 ‘l’	100 ‘d’	33 ‘!’	0 ‘\0′	0 ‘\0′	0 ‘\0′	0 ‘\0′

0×7fc6d9001c10:	0 ‘\0′	0 ‘\0′	0 ‘\0′	0 ‘\0′	0 ‘\0′	0 ‘\0′	0 ‘\0′	0 ‘\0′

0×7fc6d9001c18:	0 ‘\0′	0 ‘\0′	0 ‘\0′	0 ‘\0′	0 ‘\0′	0 ‘\0′	0 ‘\0′	0 ‘\0′

0×7fc6d9001c20:	0 ‘\0′	0 ‘\0′	0 ‘\0′	0 ‘\0′	0 ‘\0′	0 ‘\0′	0 ‘\0′	0 ‘\0′

0×7fc6d9001c28:	0 ‘\0′	0 ‘\0′	0 ‘\0′	0 ‘\0′	0 ‘\0′	0 ‘\0′	0 ‘\0′	0 ‘\0′

0×7fc6d9001c30:	0 ‘\0′	0 ‘\0′	0 ‘\0′	0 ‘\0′	0 ‘\0′	0 ‘\0′	0 ‘\0′	0 ‘\0′

(gdb) x/64bc p2+2048-sizeof(p2)

0×7fc6d90023f8:	0 ‘\0′	0 ‘\0′	0 ‘\0′	0 ‘\0′	0 ‘\0′	0 ‘\0′	0 ‘\0′	0 ‘\0′

0×7fc6d9002400:	97 ‘a’	115 ’s’	104 ‘h’	33 ‘!’	0 ‘\0′	32 ‘ ‘	87 ‘W’	111 ‘o’

0×7fc6d9002408:	114 ‘r’	108 ‘l’	100 ‘d’	33 ‘!’	0 ‘\0′	0 ‘\0′	0 ‘\0′	0 ‘\0′

0×7fc6d9002410:	0 ‘\0′	0 ‘\0′	0 ‘\0′	0 ‘\0′	0 ‘\0′	0 ‘\0′	0 ‘\0′	0 ‘\0′

0×7fc6d9002418:	0 ‘\0′	0 ‘\0′	0 ‘\0′	0 ‘\0′	0 ‘\0′	0 ‘\0′	0 ‘\0′	0 ‘\0′

0×7fc6d9002420:	0 ‘\0′	0 ‘\0′	0 ‘\0′	0 ‘\0′	0 ‘\0′	0 ‘\0′	0 ‘\0′	0 ‘\0′

0×7fc6d9002428:	0 ‘\0′	0 ‘\0′	0 ‘\0′	0 ‘\0′	0 ‘\0′	0 ‘\0′	0 ‘\0′	0 ‘\0′

0×7fc6d9002430:	0 ‘\0′	0 ‘\0′	0 ‘\0′	0 ‘\0′	0 ‘\0′	0 ‘\0′	0 ‘\0′	0 ‘\0′

(gdb) x/1024bc p3

0×7fc6d9002400:	97 ‘a’	115 ’s’	104 ‘h’	33 ‘!’	0 ‘\0′	32 ‘ ‘	87 ‘W’	111 ‘o’

0×7fc6d9002408:	114 ‘r’	108 ‘l’	100 ‘d’	33 ‘!’	0 ‘\0′	0 ‘\0′	0 ‘\0′	0 ‘\0′

0×7fc6d9002410:	0 ‘\0′	0 ‘\0′	0 ‘\0′	0 ‘\0′	0 ‘\0′	0 ‘\0′	0 ‘\0′	0 ‘\0′

[…]

0×7fc6d90027e8:	0 ‘\0′	0 ‘\0′	0 ‘\0′	0 ‘\0′	0 ‘\0′	0 ‘\0′	0 ‘\0′	0 ‘\0′

0×7fc6d90027f0:	0 ‘\0′	0 ‘\0′	0 ‘\0′	0 ‘\0′	0 ‘\0′	0 ‘\0′	0 ‘\0′	0 ‘\0′

0×7fc6d90027f8:	0 ‘\0′	0 ‘\0′	0 ‘\0′	0 ‘\0′	0 ‘\0′	0 ‘\0′	0 ‘\0′	0 ‘\0′

(gdb) x/64bc p3-sizeof(p3)

0×7fc6d90023f8:	0 ‘\0′	0 ‘\0′	0 ‘\0′	0 ‘\0′	0 ‘\0′	0 ‘\0′	0 ‘\0′	0 ‘\0′

0×7fc6d9002400:	97 ‘a’	115 ’s’	104 ‘h’	33 ‘!’	0 ‘\0′	32 ‘ ‘	87 ‘W’	111 ‘o’

0×7fc6d9002408:	114 ‘r’	108 ‘l’	100 ‘d’	33 ‘!’	0 ‘\0′	0 ‘\0′	0 ‘\0′	0 ‘\0′

0×7fc6d9002410:	0 ‘\0′	0 ‘\0′	0 ‘\0′	0 ‘\0′	0 ‘\0′	0 ‘\0′	0 ‘\0′	0 ‘\0′

0×7fc6d9002418:	0 ‘\0′	0 ‘\0′	0 ‘\0′	0 ‘\0′	0 ‘\0′	0 ‘\0′	0 ‘\0′	0 ‘\0′

0×7fc6d9002420:	0 ‘\0′	0 ‘\0′	0 ‘\0′	0 ‘\0′	0 ‘\0′	0 ‘\0′	0 ‘\0′	0 ‘\0′

0×7fc6d9002428:	0 ‘\0′	0 ‘\0′	0 ‘\0′	0 ‘\0′	0 ‘\0′	0 ‘\0′	0 ‘\0′	0 ‘\0′

0×7fc6d9002430:	0 ‘\0′	0 ‘\0′	0 ‘\0′	0 ‘\0′	0 ‘\0′	0 ‘\0′	0 ‘\0′	0 ‘\0′

(gdb) x/64bc p3+1024-sizeof(p3)

0×7fc6d90027f8:	0 ‘\0′	0 ‘\0′	0 ‘\0′	0 ‘\0′	0 ‘\0′	0 ‘\0′	0 ‘\0′	0 ‘\0′

0×7fc6d9002800:	0 ‘\0′	0 ‘\0′	0 ‘\0′	0 ‘\0′	0 ‘\0′	0 ‘\0′	0 ‘\0′	0 ‘\0′

0×7fc6d9002808:	0 ‘\0′	0 ‘\0′	0 ‘\0′	0 ‘\0′	0 ‘\0′	0 ‘\0′	0 ‘\0′	0 ‘\0′

0×7fc6d9002810:	0 ‘\0′	0 ‘\0′	0 ‘\0′	0 ‘\0′	0 ‘\0′	0 ‘\0′	0 ‘\0′	0 ‘\0′

0×7fc6d9002818:	0 ‘\0′	0 ‘\0′	0 ‘\0′	0 ‘\0′	0 ‘\0′	0 ‘\0′	0 ‘\0′	0 ‘\0′

0×7fc6d9002820:	0 ‘\0′	0 ‘\0′	0 ‘\0′	0 ‘\0′	0 ‘\0′	0 ‘\0′	0 ‘\0′	0 ‘\0′

0×7fc6d9002828:	0 ‘\0′	0 ‘\0′	0 ‘\0′	0 ‘\0′	0 ‘\0′	0 ‘\0′	0 ‘\0′	0 ‘\0′

0×7fc6d9002830:	0 ‘\0′	0 ‘\0′	0 ‘\0′	0 ‘\0′	0 ‘\0′	0 ‘\0′	0 ‘\0′	0 ‘\0′

(gdb) x/1024bc p4

0×7fc6d9001400:	97 ‘a’	115 ’s’	104 ‘h’	33 ‘!’	0 ‘\0′	32 ‘ ‘	87 ‘W’	111 ‘o’

0×7fc6d9001408:	114 ‘r’	108 ‘l’	100 ‘d’	33 ‘!’	0 ‘\0′	0 ‘\0′	0 ‘\0′	0 ‘\0′

0×7fc6d9001410:	0 ‘\0′	0 ‘\0′	0 ‘\0′	0 ‘\0′	0 ‘\0′	0 ‘\0′	0 ‘\0′	0 ‘\0′

[…]

0×7fc6d90017e8:	0 ‘\0′	0 ‘\0′	0 ‘\0′	0 ‘\0′	0 ‘\0′	0 ‘\0′	0 ‘\0′	0 ‘\0′

0×7fc6d90017f0:	0 ‘\0′	0 ‘\0′	0 ‘\0′	0 ‘\0′	0 ‘\0′	0 ‘\0′	0 ‘\0′	0 ‘\0′

0×7fc6d90017f8:	72 ‘H’	101 ‘e’	108 ‘l’	108 ‘l’	111 ‘o’	32 ‘ ‘	67 ‘C’	114 ‘r’

(gdb) x/64bc p4-sizeof(p4)

0×7fc6d90013f8:	72 ‘H’	101 ‘e’	108 ‘l’	108 ‘l’	111 ‘o’	32 ‘ ‘	67 ‘C’	114 ‘r’

0×7fc6d9001400:	97 ‘a’	115 ’s’	104 ‘h’	33 ‘!’	0 ‘\0′	32 ‘ ‘	87 ‘W’	111 ‘o’

0×7fc6d9001408:	114 ‘r’	108 ‘l’	100 ‘d’	33 ‘!’	0 ‘\0′	0 ‘\0′	0 ‘\0′	0 ‘\0′

0×7fc6d9001410:	0 ‘\0′	0 ‘\0′	0 ‘\0′	0 ‘\0′	0 ‘\0′	0 ‘\0′	0 ‘\0′	0 ‘\0′

0×7fc6d9001418:	0 ‘\0′	0 ‘\0′	0 ‘\0′	0 ‘\0′	0 ‘\0′	0 ‘\0′	0 ‘\0′	0 ‘\0′

0×7fc6d9001420:	0 ‘\0′	0 ‘\0′	0 ‘\0′	0 ‘\0′	0 ‘\0′	0 ‘\0′	0 ‘\0′	0 ‘\0′

0×7fc6d9001428:	0 ‘\0′	0 ‘\0′	0 ‘\0′	0 ‘\0′	0 ‘\0′	0 ‘\0′	0 ‘\0′	0 ‘\0′

0×7fc6d9001430:	0 ‘\0′	0 ‘\0′	0 ‘\0′	0 ‘\0′	0 ‘\0′	0 ‘\0′	0 ‘\0′	0 ‘\0′

(gdb) x/64bc p4+1024-sizeof(p4)

0×7fc6d90017f8:	72 ‘H’	101 ‘e’	108 ‘l’	108 ‘l’	111 ‘o’	32 ‘ ‘	67 ‘C’	114 ‘r’

0×7fc6d9001800:	97 ‘a’	115 ’s’	104 ‘h’	33 ‘!’	0 ‘\0′	32 ‘ ‘	87 ‘W’	111 ‘o’

0×7fc6d9001808:	114 ‘r’	108 ‘l’	100 ‘d’	33 ‘!’	0 ‘\0′	0 ‘\0′	0 ‘\0′	0 ‘\0′

0×7fc6d9001810:	0 ‘\0′	0 ‘\0′	0 ‘\0′	0 ‘\0′	0 ‘\0′	0 ‘\0′	0 ‘\0′	0 ‘\0′

0×7fc6d9001818:	0 ‘\0′	0 ‘\0′	0 ‘\0′	0 ‘\0′	0 ‘\0′	0 ‘\0′	0 ‘\0′	0 ‘\0′

0×7fc6d9001820:	0 ‘\0′	0 ‘\0′	0 ‘\0′	0 ‘\0′	0 ‘\0′	0 ‘\0′	0 ‘\0′	0 ‘\0′

0×7fc6d9001828:	0 ‘\0′	0 ‘\0′	0 ‘\0′	0 ‘\0′	0 ‘\0′	0 ‘\0′	0 ‘\0′	0 ‘\0′

0×7fc6d9001830:	0 ‘\0′	0 ‘\0′	0 ‘\0′	0 ‘\0′	0 ‘\0′	0 ‘\0′	0 ‘\0′	0 ‘\0′
- Dmitry Vostokov @ DumpAnalysis.org + TraceAnalysis.org -
Posted in Core Dump Analysis, Crash Dump Analysis, Crash Dump Patterns, Debugging, GDB for WinDbg Users, Mac Crash Corner, Mac OS X | No Comments »
April 15th, 2012
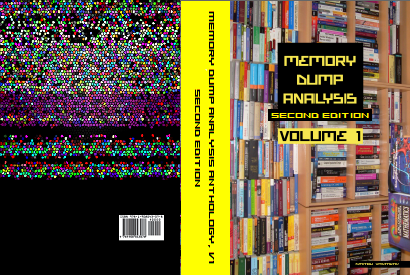
After 4 years in print this bestselling title needs an update to address minor changes, include extra examples and reference additional research published in Volumes 2, 3, 4, 5 and 6.
- Title: Memory Dump Analysis Anthology, Volume 1
- Author: Dmitry Vostokov
- Publisher: OpenTask (Summer 2012)
- Language: English
- Product Dimensions: 22.86 x 15.24
- Paperback: 800 pages
- ISBN-13: 978-1-908043-35-1
- Hardcover: 800 pages
- ISBN-13: 978-1-908043-36-8
The cover for both paperback and hardcover titles will also have a matte finish. We used A Memory Window artwork for the back cover.
- Dmitry Vostokov @ DumpAnalysis.org + TraceAnalysis.org -
Posted in Aesthetics of Memory Dumps, Announcements, AntiPatterns, Art, Assembly Language, Best Practices, Books, Bugchecks Depicted, C and C++, Complete Memory Dump Analysis, Computer Science, Crash Dump Analysis, Crash Dump Patterns, Crash Dumps for Dummies, Debugging, Debugging Methodology, Dr. Watson, Escalation Engineering, Fun with Crash Dumps, GDB for WinDbg Users, Hardware, Images of Computer Memory, Kernel Development, Mathematics of Debugging, Memiotics (Memory Semiotics), Memoretics, Memory Dump Analysis Methodology, Memory Space Art, Memory Space Music, Memory Visualization, Minidump Analysis, Multithreading, Pattern-Driven Debugging, Pattern-Driven Software Support, Publishing, Reference, Root Cause Analysis, Science of Memory Dump Analysis, Software Architecture, Software Behavior DNA, Software Behavior Patterns, Software Behavioral Genome, Software Diagnostics, Software Engineering, Software Technical Support, Stack Trace Collection, Testing, Tools, Troubleshooting Methodology, Vista, WinDbg Scripts, WinDbg Tips and Tricks, WinDbg for GDB Users, Windows 7, Windows Data Structures, Windows Server 2008, Windows System Administration, x64 Windows | No Comments »
April 15th, 2012
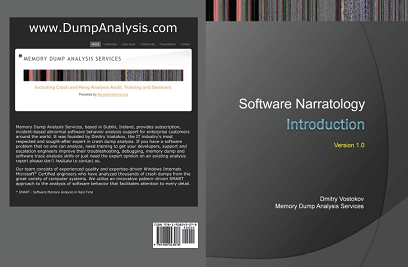
In a week this short full color book should appear in online bookstores:
- Title: Software Narratology: An Introduction to the Applied Science of Software Stories
- Authors: Dmitry Vostokov, Memory Dump Analysis Services
- Description: This is a transcript of Memory Dump Analysis Services Webinar about Software Narratology: an exciting new discipline and a field of research founded by DumpAnalysis.org. When software executes it gives us its stories in the form of UI events, software traces and logs. Such stories can be analyzed for their structure and patterns for troubleshooting, debugging and problem resolution purposes. Topics also include software narremes and their types, anticipatory software construction and software diagnostics.
- Publisher: OpenTask (April 2012)
- Language: English
- Product Dimensions: 28.0 x 21.6
- Paperback: 26 pages
- ISBN-13: 978-1908043078
- Dmitry Vostokov @ DumpAnalysis.org + TraceAnalysis.org -
Posted in Announcements, Books, CDF Analysis Tips and Tricks, Code Reading, Computer Science, Debugging, Debugging Methodology, Debugging Trends, Education and Research, Escalation Engineering, Event Tracing for Windows (ETW), Hermeneutics of Memory Dumps and Traces, Ideas, Narralog Programming Language, New Debugging School, Pattern-Driven Debugging, Pattern-Driven Software Support, Presentations, Publishing, Root Cause Analysis, SPDL, Science of Software Tracing, Software Behavior DNA, Software Behavior Patterns, Software Behavioral Genome, Software Diagnostics, Software Engineering, Software Narrative Fiction, Software Narrative Science, Software Narratology, Software Narremes, Software Problem Description Patterns, Software Problem Solving, Software Technical Support, Software Trace Analysis, Software Trace Analysis and History, Software Trace Deconstruction, Software Trace Linguistics, Software Trace Modeling, Software Trace Reading, Software Trace Visualization, Software Tracing Implementation Patterns, Software Troubleshooting Patterns, Structural Trace Patterns, Systems Thinking, Testing, Tools, Trace Analysis Patterns, Training and Seminars, Troubleshooting Methodology, UI Problem Analysis Patterns, Unified Debugging Patterns, Unified Software Diagnostics, Webinars | No Comments »
April 13th, 2012
Finally the book has arrived and I plan to continue my close reading with relevant comments pointing to DumpAnalysis.org and any additional experiments if needed, for example, to cover x64 Windows (the new edition is still 32-bit oriented in WinDbg examples).
Windows Internals, Part 1: Covering Windows Server 2008 R2 and Windows 7

Posted in Notes on Windows Internals, Reading Notebook | No Comments »
April 12th, 2012
Due to many questions on recommended books to learn assembly language asked during Accelerated Windows Memory Dump Analysis training sessions we provide these references:
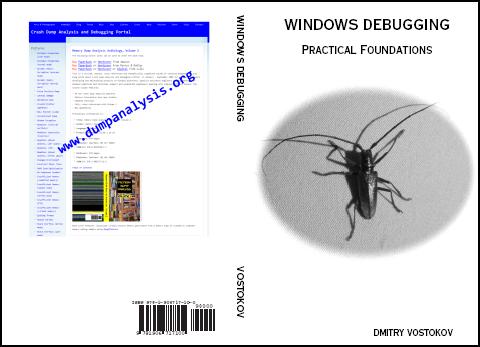
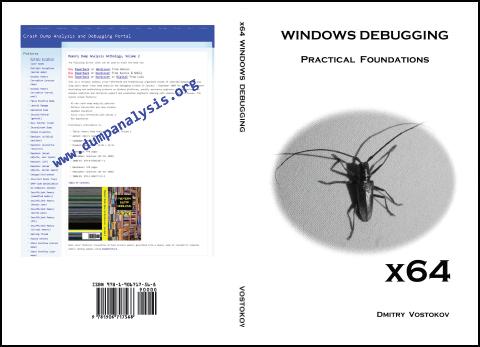
Windows Debugging: Practical Foundations
x64 Windows Debugging: Practical Foundations
Each book can be read independently although some platform-independent content overlaps. x64 bit book focuses on 64-bit only.
We believe these books provide all necessary motivation, context and practical foundation for other in-depth assembly language textbooks on the market.
I’m also working on the similar book for x64 Mac OS X.
- Dmitry Vostokov @ DumpAnalysis.org + TraceAnalysis.org -
Posted in Assembly Language, Books, Debugging, Training and Seminars, x64 Windows | No Comments »
April 12th, 2012
There are many lists for great books but I’d like to share the one that have a more personal touch. These books I wanted to read on the first sight and devoured them when I had an occasion.
First book that made a great impression on me was C Programming Language  which I saw and read in 1987 (in Russian translation with very nice hardcover binding). There was a C implementation available on a PDP-11 clone I worked with at that time.

Another book that reinforced my better function prototype reading and pointer declarations was Expert C Programming.

I confess I had a long trouble understanding C++ long back ago despite reading The C++ Programming Language by Bjarne Stroustrup (reading several editions) and Effective C++ series by Scott Meyers partly because of my long practice of Win32 programming using C and partly because I didn’t understand why I needed C++ to do the same. Popular books such as C++ for Real Programmers (in Russian translation) terrified me with their complexity (although I made honest efforts to read them from cover to cover). However, when I saw and started reading the book Advanced CORBA Programming with C++
 I really understood why we needed C++ and how it all worked.

After that rereading The C++ Programming Language and (More) Effective C++ books was a great pleasure.
The other part of C++, STL was greatly clarified by reading the following book in 2003 from cover to cover (at that time the first edition): The C++ Standard Library: A Tutorial and Reference .
.

Inside the C++ Object Model book clarified C++ implementation issues and helped later with crash dump analysis of C++ programs.

I plan to continue this “Great Impression” series with other topics and also to publish a recommended reading list for C++ based on books from my personal library that started growing when I was an employee at Programming Research in 2001 - 2003:

The row of books is all about C++. Except the big thick red book about English language grammar (as I became interested in other grammars than C++) The Cambridge Grammar of the English Language :
:

Now !ad debugger command: I’m developing a traning course Deep Down C++ with Memory Dump Analysis.
- Dmitry Vostokov @ DumpAnalysis.org + TraceAnalysis.org -
Posted in Bigraphical Details, Books, C and C++, Deep Down C++, History, Software Engineering | No Comments »
April 9th, 2012
Allocated dynamic memory such as process heap can remain reserved after deallocation and its virtual memory region might become unavailable for usage. One example of this I encountered recently while debugging a .NET service. During a peak usage it reported various out-of-memory events but its managed heap was healthy and didn’t consume much. However, its process heap statistics showed a large reserved heap segment missing in a similar memory dump from a development environment. Remaining allocated entries in that heap segment contained a specific module hint that allowed us to suggest removing a 3rd-party product from a production environment.
In order to provide the proof of that possible scenario of reserved heap regions we created a special modeling application:
int _tmain(int argc, _TCHAR* argv[])
{
static char *pAlloc[1000000];
for (int i = 0; i < 1000000; i++)
{
pAlloc[i] = (char *)malloc (1000);
}
getc(stdin);
for (int i = 0; i < 1000000; i++)
{
free(pAlloc[i]);
}
getc(stdin);
return 0;
}
Here’s the debugging log:
0:001> .symfix c:\mss
0:001> .reload

Reloading current modules

.....
After allocation:
0:001> !heap -s

LFH Key                   : 0x156356e0

Termination on corruption : ENABLED

Heap     Flags   Reserv  Commit  Virt   Free  List   UCR  Virt  Lock  Fast

(k)     (k)    (k)     (k) length      blocks cont. heap

—————————————————————————–

00520000 00000002    1024    112   1024      8     1     1    0      0   LFH

007e0000 00001002 1019328 1012444 1019328    131    68    67    0      0   LFH

—————————————————————————–
0:001> g

(1588.14b0): Break instruction exception - code 80000003 (first chance)

eax=7efda000 ebx=00000000 ecx=00000000 edx=770ff85a esi=00000000 edi=00000000

eip=7707000c esp=00f0f7e4 ebp=00f0f810 iopl=0         nv up ei pl zr na pe nc

cs=0023  ss=002b  ds=002b  es=002b  fs=0053  gs=002b             efl=00000246

ntdll!DbgBreakPoint:

7707000c cc              int     3
After deallocation:
0:001> !heap -s

LFH Key                   : 0x156356e0

Termination on corruption : ENABLED

Heap     Flags   Reserv  Commit  Virt   Free  List   UCR  Virt  Lock  Fast

(k)     (k)    (k)     (k) length      blocks cont. heap

—————————————————————————–

00520000 00000002    1024    112   1024      8     1     1    0      0   LFH

007e0000 00001002 1019328  73040 1019328  71365   419   165    0      0   LFH

External fragmentation  97 % (419 free blocks)

Virtual address fragmentation  92 % (165 uncommited ranges)

—————————————————————————–
0:001> !address -summary

--- Usage Summary ---------------- RgnCount ----------- Total Size -------- %ofBusy %ofTotal

Free                                     26          3fbe7000 (1019.902 Mb)           49.80%

<unclassified>                          752          3f8ec000 (1016.922 Mb)  98.92%   49.66%

Image                                    41            76b000 (   7.418 Mb)   0.72%    0.36%

Stack                                     6            200000 (   2.000 Mb)   0.19%    0.10%

MemoryMappedFile                          8            1af000 (   1.684 Mb)   0.16%    0.08%

TEB                                       2              2000 (   8.000 kb)   0.00%    0.00%

PEB                                       1              1000 (   4.000 kb)   0.00%    0.00%
--- Type Summary (for busy) ------ RgnCount ----------- Total Size -------- %ofBusy %ofTotal

MEM_PRIVATE                             734          3f8a2000 (1016.633 Mb)  98.89%   49.64%

MEM_IMAGE                                68            9b8000 (   9.719 Mb)   0.95%    0.47%

MEM_MAPPED                                8            1af000 (   1.684 Mb)   0.16%    0.08%
--- State Summary ---------------- RgnCount ----------- Total Size -------- %ofBusy %ofTotal

MEM_FREE                                 26          3fbe7000 (1019.902 Mb)           49.80%

MEM_RESERVE                             374          3f6e8000 (1014.906 Mb)  98.72%   49.56%

MEM_COMMIT                              436            d21000 (  13.129 Mb)   1.28%    0.64%
--- Protect Summary (for commit) - RgnCount ----------- Total Size -------- %ofBusy %ofTotal

PAGE_READWRITE                          383            725000 (   7.145 Mb)   0.69%    0.35%

PAGE_EXECUTE_READ                        10            414000 (   4.078 Mb)   0.40%    0.20%

PAGE_READONLY                            29            1cd000 (   1.801 Mb)   0.18%    0.09%

PAGE_WRITECOPY                           10             12000 (  72.000 kb)   0.01%    0.00%

PAGE_READWRITE|PAGE_GUARD                 4              9000 (  36.000 kb)   0.00%    0.00%
--- Largest Region by Usage ----------- Base Address -------- Region Size ----------

Free                                        3f0c0000          33050000 ( 816.313 Mb)

<unclassified>                              158a1000            fcf000 (  15.809 Mb)

Image                                        1083000            3d1000 (   3.816 Mb)

Stack                                         200000             fd000 (1012.000 kb)

MemoryMappedFile                            7efe5000             fb000 (1004.000 kb)

TEB                                         7efda000              1000 (   4.000 kb)

PEB                                         7efde000              1000 (   4.000 kb)
We see that free memory available for allocation is only 816 Mb.
- Dmitry Vostokov @ DumpAnalysis.org + TraceAnalysis.org -
Posted in Crash Dump Analysis, Crash Dump Patterns, Debugging | No Comments »