Forthcoming Introduction to Pattern-Driven Software Diagnostics

April 9th, 2012

Memory Dump Analysis Services organizes a free Webinar on Unified Software Diagnostics (USD) and the new scalable cost-effective software support model called Pattern-Driven Software Support devised to address various shortcomings in existing tiered software support organizations. Examples cover Windows, Mac OS  and Linux.

 Introduction to Pattern-Driven Software Diagnostics Logo

Date: 22nd of June, 2012
Time: 17:00 (BST) 12:00 (EST) 09:00 (PST)
Duration: 60 minutes

Space is limited.
Reserve your Webinar seat now at:
https://www3.gotomeeting.com/register/172771078

- Dmitry Vostokov @ DumpAnalysis.org + TraceAnalysis.org -

Crash Dump Analysis Patterns (Part 170)

April 5th, 2012

Address space-wide search for errors and status codes may show Coincidental Error Code pattern:

0:000> !heap -x -v c0000005
Search VM for address range c0000005 - c0000005 : 028690b8 (c0000005), [...]

0:000> dd 028690b8 l1
028690b8  c0000005

In such cases we need to check whether the addresses belong to volatile regions such as stack because it is possible to have such values as legitimate code and image data:

0:000> !address 028690b8
Usage:                  Image
Allocation Base:        02700000
Base Address:           02869000
End Address:            02874000
Region Size:            0000b000
Type:                   01000000 MEM_IMAGE
State:                  00001000 MEM_COMMIT
Protect:                00000002 PAGE_READONLY
More info:              lmv m ModuleA
More info:              !lmi ModuleA
More info:              ln 0×28690b8

0:000> u 028690b8
ModuleA!ComputeB:
028690b8 050000c000      add     eax,0C00000h
[...]

Another example:

0:000> !heap -x -v c0000005
Search VM for address range 00000000c0000005 - 00000000c0000005 : 7feff63ab60 (c0000005),

0:000> !address 7feff63ab60
Usage:                  Image
Allocation Base:        000007fe`ff460000
Base Address:           000007fe`ff635000
End Address:            000007fe`ff63c000
Region Size:            00000000`00007000
Type:                   01000000 MEM_IMAGE
State:                  00001000 MEM_COMMIT
Protect:                00000004 PAGE_READWRITE
More info:              lmv m ole32
More info:              !lmi ole32
More info:              ln 0×7feff63ab60

0:000> dp 7feff63ab60
000007fe`ff63ab60  00000000`c0000005 c0000194`00000001
000007fe`ff63ab70  00000001`00000000 00000000`c00000aa
000007fe`ff63ab80  80000002`00000001 00000001`00000000
000007fe`ff63ab90  00000000`c0000096 c000001d`00000001
000007fe`ff63aba0  00000001`00000000 00000000`80000003
000007fe`ff63abb0  c00000fd`00000001 00000001`00000000
000007fe`ff63abc0  00000000`c0000235 c0000006`00000001
000007fe`ff63abd0  00000001`00000000 00000000`c0000420

In the latter case the data structure suggests a table of errors:

0:000> ln 7feff63ab60
(000007fe`ff63ab60)   ole32!gReportedExceptions

- Dmitry Vostokov @ DumpAnalysis.org + TraceAnalysis.org -

Forthcoming Book: Inside Windows Debugging

April 4th, 2012

Discovered this forthcoming book and immediately preordered:

Inside Windows Debugging: A Practical Guide to Debugging and Tracing Strategies in Windows

From Safari Books Online table of contents I see it also includes Event Tracing for Windows:

http://my.safaribooksonline.com/book/-/9780735671348

Looking forward to reading it and writing a review.

- Dmitry Vostokov @ DumpAnalysis.org + TraceAnalysis.org -

Outside

April 4th, 2012

- Dmitry Vostokov @ DumpAnalysis.org + TraceAnalysis.org -

Crash Dump Analysis Patterns (Part 1, Mac OS X)

April 4th, 2012

The first Windows pattern called Multiple Exceptions in user mode now has Mac OS X equivalent. In the example below there are 3 threads and two of them experienced NULL Pointer (data) access violation exception:

(gdb) thread apply all bt full

Thread 3 (core thread 2):
#0  0x00000001062ffe4e in thread_two (arg=0x0)
at main.c:24
p = (int *) 0×0
#1  0×00007fff8abf58bf in _pthread_start ()
No symbol table info available.
#2  0×00007fff8abf8b75 in thread_start ()
No symbol table info available.

Thread 2 (core thread 1):
#0  0x00000001062ffe1e in thread_one (arg=0x0)
at main.c:16
p = (int *) 0×0
#1  0×00007fff8abf58bf in _pthread_start ()
No symbol table info available.
#2  0×00007fff8abf8b75 in thread_start ()
No symbol table info available.

Thread 1 (core thread 0):
#0  0x00007fff854e0e42 in __semwait_signal ()
No symbol table info available.
#1  0x00007fff8ababdea in nanosleep ()
No symbol table info available.
#2  0x00007fff8ababc2c in sleep ()
No symbol table info available.
#3  0x00000001062ffec3 in main (argc=1, argv=0x7fff65efeab8)
at main.c:36
threadID_one = (pthread_t) 0×1063b4000
threadID_two = (pthread_t) 0×106581000

(gdb) thread 2
[Switching to thread 2 (core thread 1)]
0x00000001062ffe1e in thread_one (arg=0x0)
at main.c:16
16    *p = 1;

(gdb) p/x p
$1 = 0×0

(gdb) thread 3
[Switching to thread 3 (core thread 2)]
0x00000001062ffe4e in thread_two (arg=0x0)
at main.c:24
24    *p = 2;

(gdb) p/x p
$2 = 0×0

- Dmitry Vostokov @ DumpAnalysis.org + TraceAnalysis.org -

Liquid Memory

April 1st, 2012

- Dmitry Vostokov @ DumpAnalysis.org + TraceAnalysis.org -

Computer Brain

April 1st, 2012

- Dmitry Vostokov @ DumpAnalysis.org + TraceAnalysis.org -

Music for Debugging: Make It Through This Trace

April 1st, 2012

Software trace analysis is notoriously difficult so a bit of folk music is needed to make debugging sessions less boring. The following album came to my attention in a local library and after listening to it I recommend it for software log analysis sessions:

Make It Through This World

Here’s my own track title interpretation:

1. Dream Away The Defects
2. This I’d Analyze
3. A Magnifier
4. Make It Through This Trace
5. Don’t Let It Go Unanalyzed
6. Request-Reply Pair
7. I Love It When It’s Short
8. No Higher Specs
9. Said, Said.
10. When I Think Of You, My Customers
11. Close to The Defect
12. A Debugger For You Now

- Dmitry Vostokov @ DumpAnalysis.org + TraceAnalysis.org -

Crash Dumps, Acquisitions and Layoffs (Part 1)

April 1st, 2012

This is a story I would like to present for a possible discussion. A leading debugging services company A was contacted by a company B to analyze dozens of crash dumps for a modest fee*. No NDA was signed and the work was done promptly. Unfortunately there was no response to an invoice and after some time a representative from the company A contacted the company B and got an immediate reply that they were bought by a company C. The new invoice was requested and promptly sent by the company A to the company C. More time passed beyond any reasonable time frame and a representative from the company A contacted the company C again and didn’t get an immediate reply as before. After some time out of the blue came a group reply from all high execs saying that the modest fee cannot be paid because it had to be done by the company B that they bought. And by the way all guys from the company B dealing with the company A were no longer with the company C. The company A pointed out that by an implicit agreement an act of nonpayment from the company B due to unforeseen circumstances automatically made all crash dumps submitted to the company A a property of the company A.

Many would say please contact a lawyer but the modest fee doesn’t worth such a contact. When I devise a happy ending I write a second part.

* an average one day exec salary or less

- Dmitry Vostokov @ DumpAnalysis.org + TraceAnalysis.org -

An Undisclosed Corporation Tried to Hire Vostokov, Improve a Debugger

April 1st, 2012

The founder of pattern-driven debugging was invited to HQ a few years ago to join the Corporation and work on what would become the killer of current debuggers and disassemblers.

- Dmitry Vostokov @ DumpAnalysis.org + TraceAnalysis.org -

Typology, Typological (Debugging Slang, Part 30)

March 30th, 2012

Typology - a logic of typos in software. Typological - a logical typo.

Examples: A typology of defects in source code. An engineer committed a grave typological mistake.

- Dmitry Vostokov @ DumpAnalysis.org + TraceAnalysis.org -

Semiotics: The Basics

March 29th, 2012

In 2008 when writing the first version of this review I admitted that Semiotics was a big gap in my education which mostly lied in natural and computer sciences. I knew less about social sciences and tried to fill various gaps. The reason why I came upon this discipline is that I’m interested in signs and their interpretations, especially their relation to various structures. I started reading this book in September, 2008.

Semiotics: The Basics

Buy from Amazon

As a by-product of reading I was able to provide the kind of a theoretical explanation for the phenomenon of bugtations:

Bugtations: a semiotic approach

Now after more than 3 years of intermittent reading I finally finished this book. In the mean time I was able to apply Semiotics to memory dump and software trace analysis (Memiotics) and now I also use it in connection with Software Narratology (an application of literary narratology to software narratives such as traces and event logs). What is also good about this book in addition to clearly explained concepts is a very good closing chapter summarising the whole book and the field, extensive reading guide, summary of leading schools, and a very good glossary. There is also an online book with extra materials:

http://users.aber.ac.uk/dgc/Documents/S4B/

- Dmitry Vostokov @ LiterateScientist.com -

Bugtation No.158

March 28th, 2012

Always imitate the behavior of the working program when it is crashing.

George Meredith

- Dmitry Vostokov @ DumpAnalysis.org + TraceAnalysis.org -

Crash Dump Analysis Patterns (Part 25, Mac OS X)

March 25th, 2012

This is a Mac OS X / GDB counterpart to Stack Trace pattern previously described for Windows platforms. Here we show a stack trace when symbols are not available and also how to apply symbols:

(gdb) bt
#0  0×000000010d3b0e90 in ?? ()
#1  0×000000010d3b0ea9 in ?? ()
#2  0×000000010d3b0ec4 in ?? ()
#3  0×000000010d3b0e74 in ?? ()

(gdb) maintenance info sections
Exec file:
[...]
Core file:
`/cores/core.262', file type mach-o-le.
0×000000010d3b0000->0×000000010d3b1000 at 0×00001000: LC_SEGMENT. ALLOC LOAD CODE HAS_CONTENTS
0×000000010d3b1000->0×000000010d3b2000 at 0×00002000: LC_SEGMENT. ALLOC LOAD CODE HAS_CONTENTS
0×000000010d3b2000->0×000000010d3b3000 at 0×00003000: LC_SEGMENT. ALLOC LOAD CODE HAS_CONTENTS
0×000000010d3b3000->0×000000010d3b4000 at 0×00004000: LC_SEGMENT. ALLOC LOAD CODE HAS_CONTENTS
0×000000010d3b4000->0×000000010d3b5000 at 0×00005000: LC_SEGMENT. ALLOC LOAD CODE HAS_CONTENTS
0×000000010d3b5000->0×000000010d3b6000 at 0×00006000: LC_SEGMENT. ALLOC LOAD CODE HAS_CONTENTS
0×000000010d3b6000->0×000000010d3cb000 at 0×00007000: LC_SEGMENT. ALLOC LOAD CODE HAS_CONTENTS
0×000000010d3cb000->0×000000010d3cc000 at 0×0001c000: LC_SEGMENT. ALLOC LOAD CODE HAS_CONTENTS
0×000000010d3cc000->0×000000010d3cd000 at 0×0001d000: LC_SEGMENT. ALLOC LOAD CODE HAS_CONTENTS
0×000000010d3cd000->0×000000010d3e2000 at 0×0001e000: LC_SEGMENT. ALLOC LOAD CODE HAS_CONTENTS
0×000000010d3e2000->0×000000010d3e3000 at 0×00033000: LC_SEGMENT. ALLOC LOAD CODE HAS_CONTENTS
0×000000010d3e3000->0×000000010d3e4000 at 0×00034000: LC_SEGMENT. ALLOC LOAD CODE HAS_CONTENTS
0×000000010d400000->0×000000010d500000 at 0×00035000: LC_SEGMENT. ALLOC LOAD CODE HAS_CONTENTS
[…]

(gdb) add-symbol-file ~/Documents/Work/Test.sym 0×000000010d3b0000
add symbol table from file “/Users/DumpAnalysis/Documents/Work/Test.sym” at
LC_SEGMENT.__TEXT = 0×10d3b0000
(y or n) y
Reading symbols from /Users/DumpAnalysis/Documents/Work/Test.sym…done.

(gdb) bt
#0  0x000000010d3b0e90 in bar () at main.c:15
#1  0x000000010d3b0ea9 in foo () at main.c:20
#2  0x000000010d3b0ec4 in main (argc=1,
argv=0x7fff6cfafbf8) at main.c:25

- Dmitry Vostokov @ DumpAnalysis.org + TraceAnalysis.org -

Forthcoming Training: Accelerated Mac OS X Core Dump Analysis

GDB Annoyances: Incomplete Stack Trace

March 25th, 2012

Users of WinDbg debugger accustomed to full thread stack traces will wonder whether a thread starts from main:

(gdb) where
#0  0x000000010d3b0e90 in bar () at main.c:15
#1  0x000000010d3b0ea9 in foo () at main.c:20
#2  0x000000010d3b0ec4 in main (argc=1,
argv=0x7fff6cfafbf8) at main.c:25

Of course, not and by default a stack trace is shown starting from main function. You can change this behavior by using the following command:

(gdb) set backtrace past-main

Now we see an additional frame:

(gdb) where
#0  0x000000010d3b0e90 in bar () at main.c:15
#1  0x000000010d3b0ea9 in foo () at main.c:20
#2  0x000000010d3b0ec4 in main (argc=1,
argv=0x7fff6cfafbf8) at main.c:25
#3  0×000000010d3b0e74 in start ()

- Dmitry Vostokov @ DumpAnalysis.org + TraceAnalysis.org -

Forthcoming Training: Accelerated Mac OS X Core Dump Analysis

Crash Dump Analysis Patterns (Part 6b, Mac OS X)

March 25th, 2012

This is a Mac OS X / GDB counterpart to NULL Pointer (data) pattern previously described for Windows platforms:

(gdb) bt
#0  0×000000010d3b0e90 in bar () at main.c:15
#1  0×000000010d3b0ea9 in foo () at main.c:20
#2  0×000000010d3b0ec4 in main (argc=1,
argv=0×7fff6cfafbf8) at main.c:25

(gdb) disassemble
Dump of assembler code for function bar:
0x000000010d3b0e80 <bar+0>: push   %rbp
0×000000010d3b0e81 <bar+1>: mov    %rsp,%rbp
0×000000010d3b0e84 <bar+4>: movq   $0×0,-0×8(%rbp)
0×000000010d3b0e8c <bar+12>: mov    -0×8(%rbp),%rax
0×000000010d3b0e90 <bar+16>: movl   $0×1,(%rax)
0×000000010d3b0e96 <bar+22>: pop    %bp
0×000000010d3b0e97 <bar+23>: retq
End of assembler dump.

(gdb) p/x $rax
$1 = 0×0

- Dmitry Vostokov @ DumpAnalysis.org + TraceAnalysis.org -

Forthcoming Training: Accelerated Mac OS X Core Dump Analysis

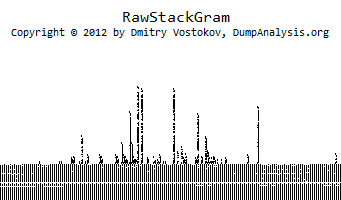
RawStackGram

March 24th, 2012

- Dmitry Vostokov @ DumpAnalysis.org + TraceAnalysis.org -

WinDbg shortcuts: !heap -x -v

March 23rd, 2012

The following command is useful for searching a process virtual space for any value references:

!heap -x -v <value> ”will search the entire virtual memory space of the current process for pointers to this” value (from WinDbg help).

Example:

0:000> !heap -x -v 6e412d82
Search VM for address range 6e412d82 - 6e412d82 : 778042bc (6e412d82),

0:000> dp 778042bc l1
778042bc  6e412d82

0:000> !heap -x -v c0000005
Search VM for address range c0000005 - c0000005 : 014df8d0 (c0000005), 014dfe8c (c0000005), 0155d908 (c0000005), 0155dd10 (c0000005), 0155ddc8 (c0000005), 0155dfa8 (c0000005), 0155dff0 (c0000005), 0155ea20 (c0000005), 6d000f9c (c0000005), 70d44054 (c0000005), 725c30d4 (c0000005), 7270d20c (c0000005), 7282ef74 (c0000005), 7449a878 (c0000005), 74511958 (c0000005), 74562ec4 (c0000005), 74563280 (c0000005), 74564fc8 (c0000005), 7456562c (c0000005), 74565748 (c0000005), 745664a8 (c0000005), 74566a30 (c0000005), 74566ad8 (c0000005), 747f6730 (c0000005), 747f682c (c0000005), 74861ef0 (c0000005), 7488743c (c0000005), 748aea68 (c0000005), 748b2830 (c0000005), 748c5118 (c0000005), 74935068 (c0000005), 749412a8 (c0000005), 7495caf0 (c0000005), 74a3a780 (c0000005), 74aa462c (c0000005), 74b19b68 (c0000005), 74b61060 (c0000005), 74b8fb44 (c0000005), 74b9d1c8 (c0000005), 74be1ad8 (c0000005), 74be72c8 (c0000005), 74c14b60 (c0000005), 74c83b84 (c0000005), 74c83b88 (c0000005), 74c83b9c (c0000005), 74c83ba0 (c0000005), 74c83ba4 (c0000005), 74c83ba8 (c0000005), 74c83bac (c0000005), 74c83bb0 (c0000005), 74c83bb4 (c0000005), 74c83bb8 (c0000005), 74c83bbc (c0000005), 74c83bc0 (c0000005), 74c83bc8 (c0000005), 74c83bcc (c0000005), 74c83bd0 (c0000005), 74c83bd4 (c0000005), 74c83bd8 (c0000005), 74c83bdc (c0000005), 74c83be0 (c0000005), 74c83be4 (c0000005), 74c83be8 (c0000005), 74c83bec (c0000005), 74c83bf0 (c0000005), 74c83bf4 (c0000005), 74c83bf8 (c0000005), 74c83bfc (c0000005), 74c83c00 (c0000005), 74c83c04 (c0000005), 74c83c08 (c0000005), 74c83c0c (c0000005), 74c83c10 (c0000005), 74c83c14 (c0000005), 74c83c18 (c0000005), 74c83c1c (c0000005), 74c83c20 (c0000005), 74c83c24 (c0000005), 74c83c28 (c0000005), 74c83c2c (c0000005), 74c83c34 (c0000005), 74c83c38 (c0000005), 74c83c3c (c0000005), 74c8c7ac (c0000005), 75019298 (c0000005), 750ff7b0 (c0000005), 751c1adc (c0000005), 751c2514 (c0000005), 7522c530 (c0000005), 752c311c (c0000005), 752d4734 (c0000005), 752d4ae8 (c0000005), 752d534c (c0000005), 752d7038 (c0000005), 752d7e9c (c0000005), 752eda04 (c0000005), 752edab0 (c0000005), 756d6624 (c0000005), 7571adc0 (c0000005), 7571addc (c0000005), 75723780 (c0000005), 757af774 (c0000005), 759c0f10 (c0000005), 76702360 (c0000005), 76703a30 (c0000005), 76d437ac (c0000005), 76d527ec (c0000005), 76dd0fa4 (c0000005), 77581f2c (c0000005), 777a33c0 (c0000005), 777c8b14 (c0000005),

- Dmitry Vostokov @ DumpAnalysis.org + TraceAnalysis.org -

Trace Analysis Patterns (Part 46)

March 22nd, 2012

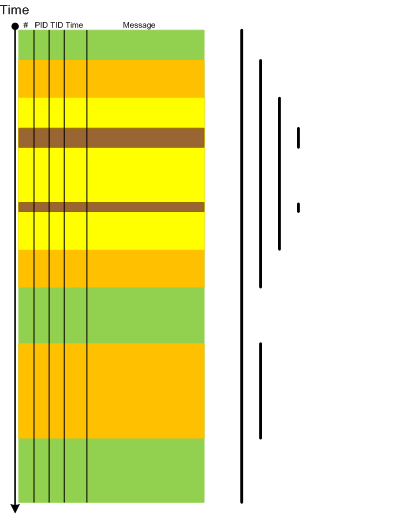
Narrative theory distinguishes between frame types such as (Fludernik, McHale, Nelles, Wolf):

- introductory framing (missing end frame) [—————————-

- terminal framing (missing opening frame) —————————-]

- [—————————-]

- interpolated framing [—-[  ]—-[     ]——–]

At the level of the software trace or an adjoint thread as a whole the first 3 types correspond to various types of this pattern Partition: Head, Prologue, Core, Epilogue, Tail where certain parts are missing. The first 2 types can also be instances of Truncated Trace pattern. Interpolated framing can be an instance of multiple discontinuities. All 4 types also correspond to foreground component messages and in general we have multiple Trace Frames as depicted:

- Dmitry Vostokov @ DumpAnalysis.org + TraceAnalysis.org -

Crash Dump Analysis Patterns (Part 169)

March 22nd, 2012

This is another “blockage” pattern called Blocked DPC. Here we have blocked per-processor Deferred Procedure Call queues because of threads running on processors with IRQL > DISPATCH_LEVEL. For example, on the processor 11 (0×0b):

11: kd> !dpcs
CPU Type      KDPC       Function
3: Normal  : 0x8accacec 0xf710567a DriverA

5: Normal  : 0x89f449e4 0xf595b83a DriverB

7: Normal  : 0x8a63664c 0xf59e3f04 USBPORT!USBPORT_IsrDpc

11: Normal  : 0x8acb2cec 0xf710567a DriverA
11: Normal  : 0x8b5e955c 0xf73484e6 ACPI!ACPIInterruptServiceRoutineDPC

11: kd> !thread
THREAD 89806428  Cid 0934.0944  Teb: 7ffdb000 Win32Thread: bc17dda0 RUNNING on processor b
Not impersonating
DeviceMap                 e1002258
Owning Process            89972290       Image:         ApplicationA.exe
Attached Process          N/A            Image:         N/A
Wait Start TickCount      2863772        Ticks: 368905 (0:01:36:04.140)
Context Switch Count      145085                 LargeStack
UserTime                  00:00:00.015
KernelTime                01:36:04.203
Win32 Start Address MSVCR90!_threadstartex (0×7854345e)
Start Address kernel32!BaseThreadStartThunk (0×77e617ec)
Stack Init f3f63000 Current f3f62c4c Base f3f63000 Limit f3f5f000 Call 0
Priority 10 BasePriority 10 PriorityDecrement 0
ChildEBP RetAddr  Args to Child
f777d3b0 f3f62d28 00000010 00000000 00000000 hal!KeAcquireInStackQueuedSpinLockRaiseToSynch+0×36
WARNING: Frame IP not in any known module. Following frames may be wrong.
f777d3b4 00000000 00000000 00000000 00000000 0xf3f62d28

- Dmitry Vostokov @ DumpAnalysis.org + TraceAnalysis.org -