Crash Dump Analysis Patterns (Part 24, Mac OS X)

June 9th, 2012

This is a Mac OS X / GDB counterpart to Coincidental Symbolic Information pattern previously described for Windows platforms. The idea is the same: to disassemble the address to see if the preceding instruction is a call. If it is indeed then most likely the symbolic address is a return address from past Execution Residue:

(gdb) x $rsp
0x7fff6a162a38: 0x8fab9a9c

(gdb) x/1000a 0x7fff6a162000
[...]
0x7fff6a162960: 0x7fff6a162980 0x7fff6a167922
0x7fff6a162970: 0x0 0x0
0x7fff6a162980: 0x7fff6a162a50 0×7fff8a31e716 <dyld_stub_binder_+13>
0×7fff6a162990: 0×1 0×7fff6a162b00
0×7fff6a1629a0: 0×7fff6a162b10 0×7fff6a162bc0
0×7fff6a1629b0: 0×8 0×0
[…]
0×7fff6a162a00: 0×0 0×0
0×7fff6a162a10: 0×0 0×0
0×7fff6a162a20: 0×0 0×0
0×7fff6a162a30: 0×7fff6a162a60 0×7fff8fab9a9c <abort+177>
0×7fff6a162a40: 0×0 0×0
0×7fff6a162a50: 0×7fffffffffdf 0×0
[…]
0×7fff6a163040: 0×35000 0×0
0×7fff6a163050: 0×35000 0×500000007
0×7fff6a163060: 0×7 0×747865745f5f
0×7fff6a163070: 0×0 0×545845545f5f
0×7fff6a163080: 0×0 0×7fff5fc01000 <__dyld_stub_binding_helper>
0×7fff6a163090: 0×22c9d 0xc00001000
0×7fff6a1630a0: 0×0 0×80000400
[…]

(gdb) disass 0×7fff8a31e716
Dump of assembler code for function dyld_stub_binder_:
0×00007fff8a31e709 <dyld_stub_binder_+0>: mov 0×8(%rbp),%rdi
0×00007fff8a31e70d <dyld_stub_binder_+4>: mov 0×10(%rbp),%rsi
0×00007fff8a31e711 <dyld_stub_binder_+8>: callq 0×7fff8a31e86d <_Z21_dyld_fast_stub_entryPvl>
0×00007fff8a31e716 <dyld_stub_binder_+13>: mov %rax,%r11
0×00007fff8a31e719 <dyld_stub_binder_+16>: movdqa 0×40(%rsp),%xmm0
0×00007fff8a31e71f <dyld_stub_binder_+22>: movdqa 0×50(%rsp),%xmm1
0×00007fff8a31e725 <dyld_stub_binder_+28>: movdqa 0×60(%rsp),%xmm2
0×00007fff8a31e72b <dyld_stub_binder_+34>: movdqa 0×70(%rsp),%xmm3
0×00007fff8a31e731 <dyld_stub_binder_+40>: movdqa 0×80(%rsp),%xmm4
0×00007fff8a31e73a <dyld_stub_binder_+49>: movdqa 0×90(%rsp),%xmm5
0×00007fff8a31e743 <dyld_stub_binder_+58>: movdqa 0xa0(%rsp),%xmm6
0×00007fff8a31e74c <dyld_stub_binder_+67>: movdqa 0xb0(%rsp),%xmm7
0×00007fff8a31e755 <dyld_stub_binder_+76>: mov (%rsp),%rdi
0×00007fff8a31e759 <dyld_stub_binder_+80>: mov 0×8(%rsp),%rsi
0×00007fff8a31e75e <dyld_stub_binder_+85>: mov 0×10(%rsp),%rdx
0×00007fff8a31e763 <dyld_stub_binder_+90>: mov 0×18(%rsp),%rcx
0×00007fff8a31e768 <dyld_stub_binder_+95>: mov 0×20(%rsp),%r8
0×00007fff8a31e76d <dyld_stub_binder_+100>: mov 0×28(%rsp),%r9
0×00007fff8a31e772 <dyld_stub_binder_+105>: mov 0×30(%rsp),%rax
0×00007fff8a31e777 <dyld_stub_binder_+110>: add $0xc0,%rsp
0×00007fff8a31e77e <dyld_stub_binder_+117>: pop %rbp
0×00007fff8a31e77f <dyld_stub_binder_+118>: add $0×10,%rsp
0×00007fff8a31e783 <dyld_stub_binder_+122>: jmpq *%r11

(gdb) x/2i 0×7fff8fab9a9c
0×7fff8fab9a9c <abort+177>: mov $0×2710,%edi
0×7fff8fab9aa1 <abort+182>: callq 0×7fff8fab9c43 <usleep$nocancel>

(gdb) disass 0×7fff8fab9a9c-5 0×7fff8fab9a9c
Dump of assembler code from 0×7fff8fab9a97 to 0×7fff8fab9a9c:
0×00007fff8fab9a97 <abort+172>: callq 0×7fff8fb1f54a <dyld_stub_kill>
End of assembler dump.

(gdb) disass 0×7fff5fc01000
Dump of assembler code for function __dyld_stub_binding_helper:
0×00007fff5fc01000 <__dyld_stub_binding_helper+0>: add %al,(%rax)
0×00007fff5fc01002 <__dyld_stub_binding_helper+2>: add %al,(%rax)
0×00007fff5fc01004 <__dyld_stub_binding_helper+4>: add %al,(%rax)
0×00007fff5fc01006 <__dyld_stub_binding_helper+6>: add %al,(%rax)
End of assembler dump.

(gdb) x/10 0×7fff5fc01000-0×10
0×7fff5fc00ff0: 0×00000000 0×00000000 0×00000000 0×00000000
0×7fff5fc01000 <__dyld_stub_binding_helper>: 0×00000000 0×00000000 0×00000000 0×00000000
0×7fff5fc01010 <__dyld_offset_to_dyld_all_image_infos>: 0×00000000 0×00000000

- Dmitry Vostokov @ DumpAnalysis.org + TraceAnalysis.org -

Forthcoming Training: Accelerated Mac OS X Core Dump Analysis
Crash Dump Analysis Patterns (Part 176)

June 6th, 2012

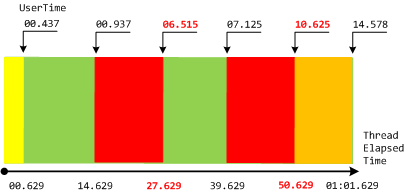
Sometimes, when an application is sluggish, periodically consumes CPU, it is possible to create a set of consecutive memory dumps of the same process to see the temporal development of any thread CPU consumption and figure out potential Spike Interval(s). For example, the following diagram was plotted from !runaway WinDbg command output for thread #1:

The 3rd and the 5th user process memory dumps in addition to increased CPU consumption also have corresponding non-waiting stack trace frames caught while executing some CPU instructions in ModuleA (not preempted with saved context). The first memory dump (yellow bar) with 437 ms user time spent out of 629 ms elapsed time also has a non-waiting stack trace but we consider it a normal application startup CPU consumption spike.

- Dmitry Vostokov @ DumpAnalysis.org + TraceAnalysis.org -

Notes on Memoidealism (1.14)

June 6th, 2012

Here we map objections (and further development) of Berkeley to Locke’s epistemology outlined in the previous note to memoidealistic epistemology:

1. There is no need for special substance to contain primary qualities.

Memory is of the same substance as memories.

2. Ideas exist independently of us in God.

Ideas not contained in memories of specific individuals can be contained either in memories of other individuals or outside memories in Memory.

- Dmitry Vostokov @ DumpAnalysis.org + TraceAnalysis.org -

Crash Dump Analysis Patterns (Part 60, Mac OS X)

June 5th, 2012

This is a Mac OS X / GDB counterpart to Execution Residue pattern previously described for Windows platforms:

(gdb) bt
#0 0x00007fff8616e82a in __kill ()
#1 0x00007fff8fab9a9c in abort ()
#2 0x000000010269dc29 in bar_5 ()
#3 0x000000010269dc39 in bar_4 ()
#4 0x000000010269dc49 in bar_3 ()
#5 0x000000010269dc59 in bar_2 ()
#6 0x000000010269dc69 in bar_1 ()
#7 0x000000010269dc79 in bar ()
#8 0x000000010269dca0 in main (argc=1, argv=0x7fff6229cb00)

(gdb) x $rsp
0x7fff6229ca38: 0x8fab9a9c

(gdb) x/1000a 0x7fff6229c000
0×7fff6229c000: 0×7fff8947b000 0×7fff8947b570
0×7fff6229c010: 0×4f3ee10c 0×7fff90cb0000
0×7fff6229c020: 0×7fff90cb04d0 0×4e938b16
[…]
0×7fff6229c5f0: 0×7fff622d8d80 0×10269d640
0×7fff6229c600: 0×7fff6229cad0 0×7fff622a460b
0×7fff6229c610: 0×100000000 0×269d000
0×7fff6229c620: 0×7fff6229c630 0×10269db59 <foo_8+9>
0×7fff6229c630: 0×7fff6229c640 0×10269db69 <foo_7+9>
0×7fff6229c640: 0×7fff6229c650 0×10269db79 <foo_6+9>
0×7fff6229c650: 0×7fff6229c660 0×10269db89 <foo_5+9>
0×7fff6229c660: 0×7fff6229c670 0×10269db99 <foo_4+9>
0×7fff6229c670: 0×7fff6229c680 0×10269dba9 <foo_3+9>
0×7fff6229c680: 0×7fff6229c690 0×10269dbb9 <foo_2+9>
0×7fff6229c690: 0×7fff6229c6a0 0×10269dbc9 <foo_1+9>
0×7fff6229c6a0: 0×7fff6229cac0 0×10269dbee <foo+30>

0×7fff6229c6b0: 0×0 0×0
0×7fff6229c6c0: 0×0 0×0
0×7fff6229c6d0: 0×0 0×0
0×7fff6229c6e0: 0×0 0×0
[…]
0×7fff6229c8d0: 0×7fff6229c960 0×7fff622b49cd
0×7fff6229c8e0: 0×10269f05c 0×0
0×7fff6229c8f0: 0×7fff622c465c 0×7fff8a31e5c0 <_Z21dyldGlobalLockReleasev>
0×7fff6229c900: 0×7fff8fab99eb <abort> 0×10269f05c
0×7fff6229c910: 0×101000000000000 0×7fff622d2110
0×7fff6229c920: 0×7fff622d8d80 0×10269f078
0×7fff6229c930: 0×7fff622daac8 0×18
0×7fff6229c940: 0×0 0×0
0×7fff6229c950: 0×10269e030 0×0
0×7fff6229c960: 0×7fff6229c980 0×7fff622a1922
0×7fff6229c970: 0×0 0×0
0×7fff6229c980: 0×7fff6229ca50 0×7fff8a31e716 <dyld_stub_binder_+13>
0×7fff6229c990: 0×1 0×7fff6229cb00
0×7fff6229c9a0: 0×7fff6229cb10 0xe223ea612ddc10b7
0×7fff6229c9b0: 0×8 0×0
0×7fff6229c9c0: 0xe223ea612ddc10b7 0×0
0×7fff6229c9d0: 0×0 0×0
0×7fff6229c9e0: 0×585f5f00474e414c 0×20435058005f4350
0×7fff6229c9f0: 0×0 0×0
0×7fff6229ca00: 0×0 0×0
0×7fff6229ca10: 0×0 0×0
0×7fff6229ca20: 0×0 0×0
0×7fff6229ca30: 0×7fff6229ca60 0×7fff8fab9a9c <abort+177>
0×7fff6229ca40: 0×0 0×0
0×7fff6229ca50: 0×7fffffffffdf 0×0
0×7fff6229ca60: 0×7fff6229ca70 0×10269dc29 <bar_5+9>
0×7fff6229ca70: 0×7fff6229ca80 0×10269dc39 <bar_4+9>
0×7fff6229ca80: 0×7fff6229ca90 0×10269dc49 <bar_3+9>
0×7fff6229ca90: 0×7fff6229caa0 0×10269dc59 <bar_2+9>
0×7fff6229caa0: 0×7fff6229cab0 0×10269dc69 <bar_1+9>
0×7fff6229cab0: 0×7fff6229cac0 0×10269dc79 <bar+9>
0×7fff6229cac0: 0×7fff6229cae0 0×10269dca0 <main+32>
0×7fff6229cad0: 0×7fff6229cb00 0×1
0×7fff6229cae0: 0×7fff6229caf0 0×10269db34 <start+52>

0×7fff6229caf0: 0×0 0×1
0×7fff6229cb00: 0×7fff6229cc48 0×0
0×7fff6229cb10: 0×7fff6229ccae 0×7fff6229ccca
[…]

Here’s the source code of the modeling application:

#define def_call(name,x,y) void name##_##x() { name##_##y(); }

#define def_final(name,x) void name##_##x() { }

#define def_final_abort(name,x) void name##_##x() { abort(); }

#define def_init(name,y) void name() { name##_##y(); }

#define def_init_alloc(name,y,size) void name() { int arr[size]; name##_##y(); *arr=0; }

def_final(foo,9)

def_call(foo,8,9)

def_call(foo,7,8)

def_call(foo,6,7)

def_call(foo,5,6)

def_call(foo,4,5)

def_call(foo,3,4)

def_call(foo,2,3)

def_call(foo,1,2)

def_init_alloc(foo,1,256)

def_final_abort(bar,5)

def_call(bar,4,5)

def_call(bar,3,4)

def_call(bar,2,3)

def_call(bar,1,2)

def_init(bar,1)

int main(int argc, const char * argv[])

{

    foo();

    bar();

} 

- Dmitry Vostokov @ DumpAnalysis.org + TraceAnalysis.org -

Forthcoming Training: Accelerated Mac OS X Core Dump Analysis
7 Habits of Highly Effective Diagnosticians (Part 0)

June 5th, 2012

Motivated by 7 Habits of Highly Effective Debuggers I would like to reflect on a distinction between diagnostics and problem solving as separate processes (although highly related). First, we reverse the precept from that article because stories such as software logs and traces are of primary importance to software diagnostics (and not only). And without diagnostics there is no effective debugging (treatment, problem solving, etc.)

The Principle Precept of Diagnostics

Stories NOT Statistics secure certainty.

Next parts will be about actual habits so please stay tuned. I would try to finish this list before the forthcoming Webinar on software diagnostics.

- Dmitry Vostokov @ DumpAnalysis.org + TraceAnalysis.org -

Trace Analysis Patterns (Part 50)

June 3rd, 2012

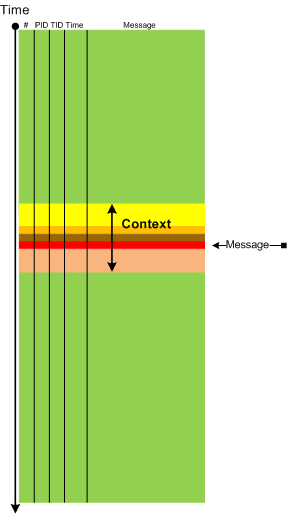
In some cases it is useful to consider Message Context: a set of surrounding messages having some relation to the chosen message:

- Dmitry Vostokov @ DumpAnalysis.org + TraceAnalysis.org -

Trace Analysis Patterns (Part 49)

June 3rd, 2012

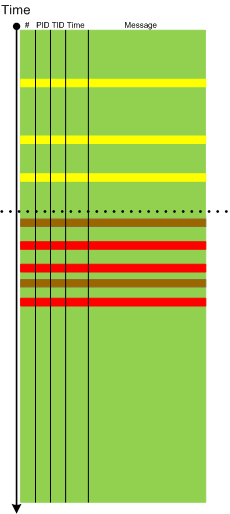
Sometimes we need to pay attention to Error Distribution, for example, the distribution of the same error across a software log space or different error messages in different parts of the same software log or trace (providing effective partition):

- Dmitry Vostokov @ DumpAnalysis.org + TraceAnalysis.org -

Trace Analysis Patterns (Part 48)

June 2nd, 2012

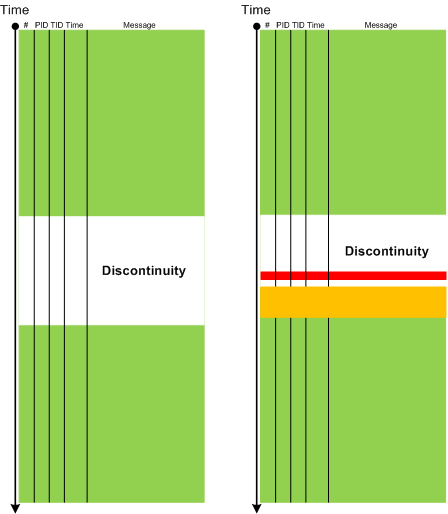
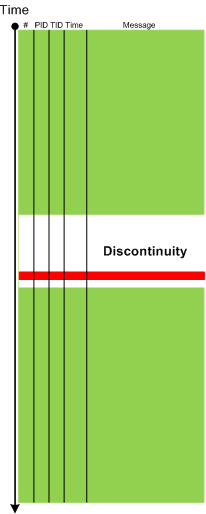
If Break-in Activity is usually unrelated to a thread or an adjoint thread which has a discontinuity then Resume Activity pattern highlights messages from that thread:

The difference can be seen on the following graphical representation of two traces we analyzed where in a working trace a break-in preceded resume activity whereas in a non-working trace both patterns were absent:

- Dmitry Vostokov @ DumpAnalysis.org + TraceAnalysis.org -

Trace Analysis Patterns (Part 47)

June 2nd, 2012

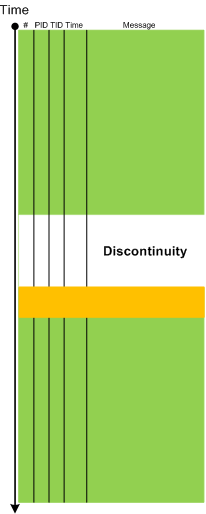
We resume our software trace analysis pattern catalog. The next pattern is called Break-in Activity. This is a message or a set of messages that surface just before the end of discontinuity of a adjoint thread and possibly triggered it:

- Dmitry Vostokov @ DumpAnalysis.org + TraceAnalysis.org -

Another Book Cover with Memory Image

June 1st, 2012

Was browsing Amazon and found this book with a cover like an artificially colored memory image and text in black gaps but rotated by 90 degrees counterclockwise:

Noise Channels: Glitch and Error in Digital Culture (Electronic Mediations)

- Dmitry Vostokov @ DumpAnalysis.org + TraceAnalysis.org -

Notes on Memoidealism (1.13)

May 30th, 2012

Here we try to map memoidealistic epistemological counterparts to Locke’s theory of perception.

1. Ideas of sensation

Sense organs receive memory snapshots from other memories

2. Ideas of reflection

Memory snapshots from mind reflecting snapshots from other memories

3. Substance

Memory as a foundation of Universe

3. Primary qualities

Qualities associated with Memory as a substance

4. Secondary qualities

Qualities associated with memories as parts of Memory

- Dmitry Vostokov @ DumpAnalysis.org + TraceAnalysis.org -

The Confluence of Computers, Philosophy, and Religion

May 30th, 2012

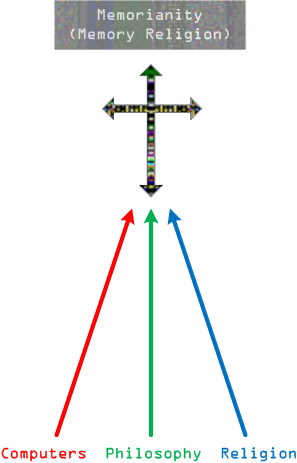
We extend the old notion of confluence of Theism and Philosophy. The new confluence of Religion, Philosophy, and Computers resuled in revealed Memory Religion (Memorianity):

It’s testament is soon to be available for free download to spread the word of Memory:

Memory Religion: A Core Testament of Memorianity

- Dmitry Vostokov @ MemoryReligion.com -

Crash Dump Analysis Patterns (Part 23a, Mac OS X)

May 29th, 2012

This is a Mac OS X / GDB counterpart to Double Free (process heap) pattern previously described for Windows platforms:

(gdb) bt
#0 0x00007fff8479582a in __kill ()
#1 0x00007fff8e0e0a9c in abort ()
#2 0x00007fff8e13f84c in free ()
#3 0x00000001035a8ef4 in main (argc=1, argv=0x7fff631a7b20)

(gdb) x/2i 0x00000001035a8ef4-8
0x1035a8eec : mov -0×20(%rbp),%edi
0×1035a8eef : callq 0×1035a8f06

(gdb) frame 3
#3 0x00000001035a8ef4 in main (argc=1, argv=0x7fff631a7b20)
at .../DoubleFree/main.c:23
23 free(p2);
Current language: auto; currently minimal

(gdb) x/g $rbp-0x20
0x7fff631a7ae0: 0x00007fe6a8801400

(gdb) x/2w 0x00007fe6a8801400
0x7fe6a8801400: 0x00000000 0xb0000000

Here’s the source code of the modeling application:

int main(int argc, const char * argv[])

{

    char *p1 = (char *) malloc (1024);

    printf(“p1 = %p\n”, p1);


    char *p2 = (char *) malloc (1024);

    printf(“p2 = %p\n”, p2);


    free(p2);

    free(p1);

    free(p2);


    return 0;

} 

- Dmitry Vostokov @ DumpAnalysis.org + TraceAnalysis.org -

Forthcoming Training: Accelerated Mac OS X Core Dump Analysis
Sorting and Early Greek Philosophers

May 29th, 2012

Who was the first? Anaximander or Anaximenes? Use alphabetical sorting and you find that Anaximenes was after Anaximander.

Fiction for Debugging: The Problem and The Solution

May 28th, 2012

After writing about music for debugging and founding software narratology I decided to start writing about fiction. The first masterpiece is The Sound and The Fury by William Faulkner. I confess that I’m in love with Folio Society books and when I saw this color version (an original idea by Faulkner now fulfilled by modern printing technology) I immediately recognized its importance for software trace analysis:

http://www.foliosociety.com/book/SAF/sound-and-the-fury

I’m pretty sure Faulkner would have been delighted to see trace analysis patterns and how they may help in writing fiction.

- Dmitry Vostokov @ DumpAnalysis.org + TraceAnalysis.org -

Crash Dump Analysis Patterns (Part 2, Mac OS X)

May 27th, 2012

This is a Mac OS X / GDB counterpart to Dynamic Memory Corruption (process heap) pattern previously described for Windows platforms:

(gdb) bt
#0 0x00007fff8479582a in __kill ()
#1 0x00007fff8e0e0a9c in abort ()
#2 0x00007fff8e1024ac in szone_error ()
#3 0x00007fff8e1024e8 in free_list_checksum_botch ()
#4 0x00007fff8e102a7b in small_free_list_remove_ptr ()
#5 0x00007fff8e106bf7 in szone_free_definite_size ()
#6 0x00007fff8e13f789 in free ()
#7 0x000000010afafe23 in main (argc=1, argv=0x7fff6abaeb08)

Here’s the source code of the modeling application:

int main(int argc, const char * argv[])

{

    char *p1 = (char *) malloc (1024);

    printf(“p1 = %p\n”, p1);


    char *p2 = (char *) malloc (1024);

    printf(“p2 = %p\n”, p2);


    char *p3 = (char *) malloc (1024);

    printf(“p3 = %p\n”, p3);


    char *p4 = (char *) malloc (1024);

    printf(“p4 = %p\n”, p4);


    char *p5 = (char *) malloc (1024);

    printf(“p5 = %p\n”, p5);


    char *p6 = (char *) malloc (1024);

    printf(“p6 = %p\n”, p6);


    char *p7 = (char *) malloc (1024);

    printf(“p7 = %p\n”, p7);


    free(p6);

    free(p4);

    free(p2);


    printf(“Hello Crash!\n”);        

    strcpy(p2, “Hello Crash!”);

    strcpy(p4, “Hello Crash!”);

    strcpy(p6, “Hello Crash!”);


    p2 = (char *) malloc (512);

    printf(“p2 = %p\n”, p2);


    p4 = (char *) malloc (1024);

    printf(“p4 = %p\n”, p4);


    p6 = (char *) malloc (512);

    printf(“p6 = %p\n”, p6);


    free (p7);

    free (p6);

    free (p5);

    free (p4);

    free (p3);

    free (p2);

    free (p1);


    return 0;

}

- Dmitry Vostokov @ DumpAnalysis.org + TraceAnalysis.org -

Forthcoming Training: Accelerated Mac OS X Core Dump Analysis
Crash Dump Analysis Patterns (Part 175)

May 23rd, 2012

Stored Exception pattern is mostly useful when an exception thread is not present like in this rare example:

ERROR: Unable to find system thread 9B7E
ERROR: The thread being debugged has either exited or cannot be accessed
ERROR: Many commands will not work properly
This dump file has an exception of interest stored in it.
The stored exception information can be accessed via .ecxr.
ERROR: Exception C0000005 occurred on unknown thread 9B7E
(95f4.9b7e): Access violation - code c0000005 (first/second chance not available)

.ecxr will not work here but the exception record is available via .exr command:

0:???> .exr -1
ExceptionAddress: 08a9ae18 (DllB.dll+0x001cae18)
ExceptionCode: c0000005 (Access violation)
ExceptionFlags: 00000001
NumberParameters: 1
Parameter[0]: 00000008

- Dmitry Vostokov @ DumpAnalysis.org + TraceAnalysis.org -

Crash Dump Analysis Patterns (Part 174)

May 20th, 2012

Activity Resonance pattern is observed when two products from different vendors compete in some functional domain such malware detection. In the example below ApplicationA and AVDriverA modules belong to Vendor A and AV-B module belongs to Vendor B. Both threads are spiking threads blocking all other activity in the system:

0: kd> !running

System Processors: (0000000000000003)
Idle Processors: (0000000000000000) (0000000000000000) (0000000000000000) (0000000000000000)

Prcbs             Current           Next
0    fffff80001845e80  fffffa8004350060                    ................
1    fffff880009c4180  fffffa80028e7060                    ................

0: kd> !thread fffffa8004350060 ff
THREAD fffffa8004350060  Cid 14424.14b34  Teb: 000000007efdb000 Win32Thread: fffff900c1d32c30 RUNNING on processor 0
Not impersonating
DeviceMap                 fffff8a00148fe80
Owning Process            fffffa8003d6cb30       Image:         ApplicationA.exe
Attached Process          N/A            Image:         N/A
Wait Start TickCount      10568630       Ticks: 0
Context Switch Count      345                 LargeStack
UserTime                  00:02:21.360
KernelTime                01:09:32.130
Win32 Start Address ApplicationA!mainCRTStartup (0×0000000000404c1b)
Stack Init fffff88006c71db0 Current fffff88006c71670
Base fffff88006c72000 Limit fffff88006c6a000 Call 0
Priority 9 BasePriority 8 UnusualBoost 0 ForegroundBoost 0 IoPriority 2 PagePriority 5
Child-SP          RetAddr           Call Site
fffff880`06c70ec0 fffff880`0197d53c AVDriverA+0×15d69
fffff880`06c70f10 fffff880`01988556 AVDriverA+0×1453c
fffff880`06c70fd0 fffff880`019886a8 AVDriverA+0×1f556
fffff880`06c71000 fffff800`0198ebfd AVDriverA+0×1f6a8

fffff880`06c71060 fffff800`019bf4f2 nt! ?? ::NNGAKEGL::`string’+0×2a6fd
fffff880`06c711e0 fffff800`019c3385 nt!PspCreateThread+0×246
fffff880`06c71460 fffff800`016d28d3 nt!NtCreateThreadEx+0×25d
fffff880`06c71bb0 00000000`76e61d9a nt!KiSystemServiceCopyEnd+0×13 (TrapFrame @ fffff880`06c71c20)
00000000`0008e178 00000000`74990411 ntdll!ZwCreateThreadEx+0xa
00000000`0008e180 00000000`7497cf87 wow64!whNtCreateThreadEx+0×815
00000000`0008e350 00000000`748c2776 wow64!Wow64SystemServiceEx+0xd7
00000000`0008ec10 00000000`7497d07e wow64cpu!TurboDispatchJumpAddressEnd+0×2d
00000000`0008ecd0 00000000`7497c549 wow64!RunCpuSimulation+0xa
00000000`0008ed20 00000000`76e54956 wow64!Wow64LdrpInitialize+0×429
00000000`0008f270 00000000`76e51a17 ntdll!LdrpInitializeProcess+0×17e4
00000000`0008f760 00000000`76e3c32e ntdll! ?? ::FNODOBFM::`string’+0×29220
00000000`0008f7d0 00000000`00000000 ntdll!LdrInitializeThunk+0xe

0: kd> !thread fffffa80028e7060 ff
THREAD fffffa80028e7060  Cid 0dc4.0e5c  Teb: 000000007efa4000 Win32Thread: 0000000000000000 RUNNING on processor 1
Not impersonating
DeviceMap                 fffff8a000008b30
Owning Process            fffffa8002817060       Image:         AV-B.exe
Attached Process          N/A            Image:         N/A
Wait Start TickCount      10568617       Ticks: 13 (0:00:00:00.203)
Context Switch Count      1763138
UserTime                  00:04:26.765
KernelTime                03:09:31.140
Win32 Start Address AV-B (0×00000000004289f2)
Stack Init fffff88003b88db0 Current fffff88003b88900
Base fffff88003b89000 Limit fffff88003b83000 Call 0
Priority 15 BasePriority 15 UnusualBoost 0 ForegroundBoost 0 IoPriority 2 PagePriority 5
Child-SP          RetAddr           Call Site
fffff880`03b88660 fffff800`019919a9 nt!ObReferenceObjectSafe+0xf
fffff880`03b88690 fffff800`01991201 nt!PsGetNextProcess+0×81
fffff880`03b886e0 fffff800`019dcef6 nt!ExpGetProcessInformation+0×774
fffff880`03b88830 fffff800`019dd949 nt!ExpQuerySystemInformation+0xfb4
fffff880`03b88be0 fffff800`016d28d3 nt!NtQuerySystemInformation+0×4d
fffff880`03b88c20 00000000`76e6167a nt!KiSystemServiceCopyEnd+0×13 (TrapFrame @ fffff880`03b88c20)
00000000`0118e708 00000000`74987da7 ntdll!NtQuerySystemInformation+0xa
00000000`0118e710 00000000`74988636 wow64!whNT32QuerySystemProcessInformationEx+0×93
00000000`0118e760 00000000`7498a0e9 wow64!whNtQuerySystemInformation_SpecialQueryCase+0×466
00000000`0118e800 00000000`7497cf87 wow64!whNtQuerySystemInformation+0xf1
00000000`0118e840 00000000`748c2776 wow64!Wow64SystemServiceEx+0xd7
00000000`0118f100 00000000`7497d07e wow64cpu!TurboDispatchJumpAddressEnd+0×2d
00000000`0118f1c0 00000000`7497c549 wow64!RunCpuSimulation+0xa
00000000`0118f210 00000000`76e8e707 wow64!Wow64LdrpInitialize+0×429
00000000`0118f760 00000000`76e3c32e ntdll! ?? ::FNODOBFM::`string’+0×29364
00000000`0118f7d0 00000000`00000000 ntdll!LdrInitializeThunk+0xe

- Dmitry Vostokov @ DumpAnalysis.org + TraceAnalysis.org -

Crash Dump Analysis Patterns (Part 173)

May 20th, 2012

Value Adding Process is a frequently observed pattern in terminal services environments when you see one or several process names listed in each session but not necessarily required. They are usually running to provide some user experience enhancements. In such cases if observed functional problems correspond to the purpose of running additional processes we might want to eliminate them for testing and troubleshooting purposes.

0: kd> !sprocess 12
Dumping Session 12

_MM_SESSION_SPACE fffff8800e5d5000
_MMSESSION        fffff8800e5d5b40
PROCESS fffffa8008d50b30
SessionId: 12  Cid: 0b04    Peb: 7fffffdc000  ParentCid: 1478
DirBase: 6bb77000  ObjectTable: fffff8a003f280b0  HandleCount: 158.
Image: csrss.exe

PROCESS fffffa80030c7060
SessionId: 12  Cid: 1a48    Peb: 7fffffd8000  ParentCid: 1478
DirBase: 0a33c000  ObjectTable: fffff8a003c46c00  HandleCount: 179.
Image: winlogon.exe

PROCESS fffffa8008250b30
SessionId: 12  Cid: 18c8    Peb: 7fffffdf000  ParentCid: 1a48
DirBase: 0350d000  ObjectTable: fffff8a0025b6840  HandleCount: 226.
Image: LogonUI.exe

PROCESS fffffa8008b00530
SessionId: 12  Cid: 1508    Peb: 7fffffdf000  ParentCid: 02f0
DirBase: 02f65000  ObjectTable: fffff8a003b7e530  HandleCount: 197.
Image: ExcitingFeatureX.exe

[...]

- Dmitry Vostokov @ DumpAnalysis.org + TraceAnalysis.org -

Crash Dump Analysis Patterns (Part 20d)

May 19th, 2012

This is a specialization of Insufficient Memory (kernel pool) pattern called Memory Leak (I/O completion packets). The currently unique diagnostics this pattern provides in comparison with other kernel pool tags is that the pool allocation entries show the leaking process:

0: kd> !poolused 3
Sorting by  NonPaged Pool Consumed

Pool Used:
NonPaged                    Paged
Tag    Allocs    Frees     Diff     Used   Allocs    Frees     Diff     Used
Icp   1294074    42875  1251199 96642976        0        0        0        0 I/O completion packets queue on a completion ports
[…]

0: kd> !poolfind Icp

Scanning large pool allocation table for Tag: Icp  (fffffa8013e00000 : fffffa8014100000)

*fffffa800e188260 size:   50 previous size:   40  (Allocated) Icp  Process: fffffa800899dc40
*fffffa800e1882e0 size:   50 previous size:   30  (Allocated) Icp  Process: fffffa800899dc40
*fffffa800e188330 size:   50 previous size:   50  (Allocated) Icp  Process: fffffa800899dc40
*fffffa800e188380 size:   50 previous size:   50  (Allocated) Icp  Process: fffffa800899dc40
*fffffa800e1883d0 size:   50 previous size:   50  (Allocated) Icp  Process: fffffa800899dc40
*fffffa800e188420 size:   50 previous size:   50  (Allocated) Icp  Process: fffffa800899dc40
*fffffa800e188470 size:   50 previous size:   50  (Allocated) Icp  Process: fffffa800899dc40
*fffffa800e1884c0 size:   50 previous size:   50  (Allocated) Icp  Process: fffffa800899dc40

0: kd> !process  fffffa800899dc40 1
PROCESS fffffa800899dc40
SessionId: 0  Cid: 43a4    Peb: 7efdf000  ParentCid: 0412
DirBase: 09d6b000  ObjectTable: fffff8a0046c8c10  HandleCount: 1068.
Image: ServiceA.exe
[…]

- Dmitry Vostokov @ DumpAnalysis.org + TraceAnalysis.org -