lvalues, rvalues and pointers

March 19th, 2007

I’ve just published stripped down HTML version of my old Code Reading lectures explaining lvalues and rvalues terminology (used in C and C++ standard documents) and pointers. It also explains how to read complex pointer declarations, const pointers and relationship between pointers and arrays. Understanding pointers is a must in low-level debugging. Can be found here:

lvalues, rvalues and pointers

- Dmitry Vostokov -

Practical Foundations of Debugging (x64)

March 19th, 2007

I’ve just published HTML slides for the first two original lectures on debugging on x64 platform written last year. Basically they are an improved version of my old lectures on debugging on x86 platforms developed in 2004. Now I put more emphasis on using WinDbg as a debugging tool and as previously no assembly language background is assumed. New lectures use x64 assembly language throughout. I’m planning to adapt them to ILP 32-32-64 Windows x64 model (integer-long-pointer) and port more old lectures this year.

- Dmitry Vostokov -

WinDbg tips and tricks: triple dereference

March 13th, 2007

WinDbg commands like dpp allow you to do double dereference in the following format

pointer *pointer **pointer

for example:

0:000> dpp 004015a2
004015a2  00405068 7c80929c kernel32!GetTickCount

I had a couple of cases where I needed triple dereference (or even quadruple dereference) done on a range of memory. Finally after some thinking I tried to use WinDbg scripts and it worked. The key is to use $p pseudo-register which shows the last value of d* commands (dd, dps, etc):

.for (r $t0=00000000`004015a2, $t1=4; @$t1 >= 0; r $t1=$t1-1, $t0=$t0+$ptrsize) { dps @$t0 l1; dps $p l1; dps $p l1; .printf "\n" }

where $t0 and $t1 are pseudo-registers used to hold the starting address of a memory block (I use 64-bit format) and the number of objects to be triple dereferenced and displayed. $ptrsize is a pointer size. The script is platform independent (can be used on both 32-bit and 64-bit target). On my 32-bit target it produces what I originally wanted (triple dereferenced memory), for example:

004015a2  00405068 component!_imp__GetTickCount
00405068  7c80929c kernel32!GetTickCount
7c80929c  fe0000ba

004015a6  458df033
458df033  ????????
458df033  ????????

004015aa  15ff50f0
15ff50f0  ????????
15ff50f0  ????????

004015ae  00405064 component!_imp__QueryPerformanceCounter
00405064  7c80a427 kernel32!QueryPerformanceCounter
7c80a427  8b55ff8b

004015b2  33f4458b
33f4458b  ????????
33f4458b  ????????

If you want quadruple dereferenced memory you just need to add the additional dps @$t0 l1; to .for loop body. With this script even double dereference looks much better because it shows symbol information for the first dereference too whereas dpp command shows symbol name only for the second dereference. 

Another less “elegant” variation without $p pseudo-register uses poi operator but you need a .catch block to prevent the script termination on invalid memory access:

0:000> .for (r $t0=00000000`004015a2, $t1=4; @$t1 >= 0; r $t1=$t1-1, $t0=$t0+$ptrsize) { .catch { dds $t0 l1; dds poi($t0) l1; dds poi(poi($t0)) l1; }; .printf "\n" }

004015a2  00405068 component!_imp__GetTickCount
00405068  7c80929c kernel32!GetTickCount
7c80929c  fe0000ba

004015a6  458df033
458df033  ????????
Memory access error at ') '

004015aa  15ff50f0
15ff50f0  ????????
Memory access error at ') '

004015ae  00405064 component!_imp__QueryPerformanceCounter
00405064  7c80a427 kernel32!QueryPerformanceCounter
7c80a427  8b55ff8b

004015b2  33f4458b
33f4458b  ????????
Memory access error at ') '

You can also use !list extension but more formatting is necessary:

0:000> .for (r $t0=00000000`004015a2, $t1=4; @$t1 >= 0; r $t1=$t1-1, $t0=$t0+$ptrsize) { .printf "%p:\n--------\n\n", $t0; !list -x "dds @$extret l1" $t0; .printf "\n" }
004015a2:
---------
004015a2  00405068 component!_imp__GetTickCount
00405068  7c80929c kernel32!GetTickCount
7c80929c  fe0000ba
fe0000ba  ????????
Cannot read next element at fe0000ba
004015a6:
---------
004015a6  458df033
458df033  ????????
Cannot read next element at 458df033
004015aa:
---------
004015aa  15ff50f0
15ff50f0  ????????
Cannot read next element at 15ff50f0
004015ae:
---------
004015ae  00405064 component!_imp__QueryPerformanceCounter
00405064  7c80a427 kernel32!QueryPerformanceCounter
7c80a427  8b55ff8b
8b55ff8b  ????????
Cannot read next element at 8b55ff8b
004015b2:
---------
004015b2  33f4458b
33f4458b  ????????
Cannot read next element at 33f4458b

The advantage of !list is in unlimited number of pointer dereferences until invalid address is reached. 

- Dmitry Vostokov -

Internet Based Crash Dump Analysis Service

March 9th, 2007

I’m planning to launch a pilot version of free research online service IBCDAS (Internet Based Crash Dump Analysis Service) which is under development and will be integrated with Crash Dump Analysis Portal (www.dumpanalysis.org). The idea is to use Google API to search for crash signatures and stack traces on Internet and mine that information for a potential solution (a fix, a service pack, actual component vendor responsible for a bug, an article, etc.). Information from internet will be fed to a database in a structured form for further analysis and to help with similar or related problems.

- Dmitry Vostokov -

Crash Dump Analysis and Debugging Portal

March 9th, 2007

I’ve decided that content management system is more suitable for organizing links, blog feeds, books and book reviews, articles, etc. Last year I set up crash dump analysis forum mainly to keep all that information in one place. Then later I started my own blog. The amount of information I’m trying to organize is growing and I want it to be more structured than it is now so I installed Drupal CMS on www.dumpanalysis.org and the portal is currently under development. Updates will be posted regularly. The crash dump analysis forum that was parked there has been moved to www.dumpanalysis.org/forum and I made great efforts to preserve links to its topics.

- Dmitry Vostokov -

Bugchecks depicted: IRQL_NOT_LESS_OR_EQUAL

March 6th, 2007

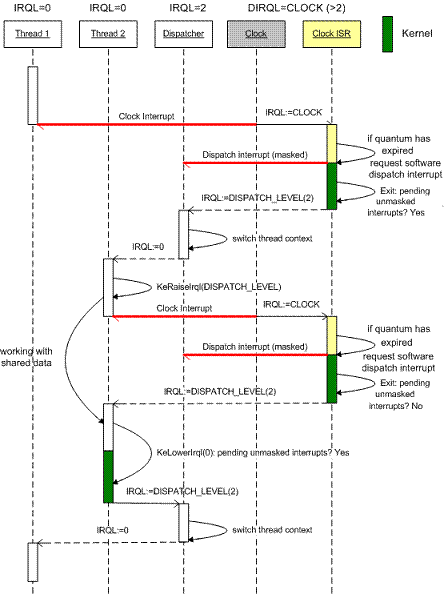
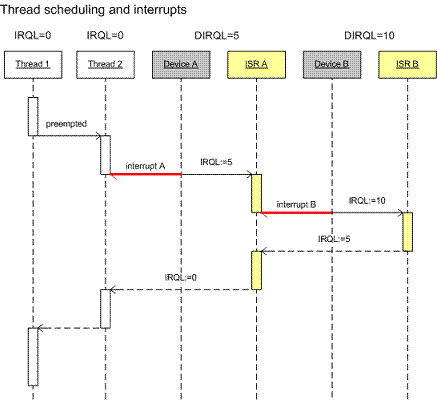
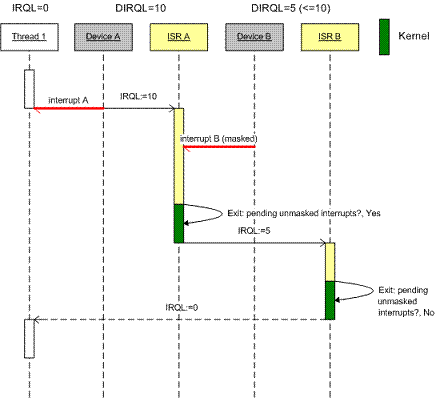
During kernel debugging training I’m providing I came up to the idea to use UML sequence diagrams to depict various Windows kernel behavior including bugchecks. Today I start with bugcheck A. To understand why this bugcheck is needed you need to understand the difference between thread scheduling and IRQL and I use the following diagram to illustrate it:

Then I explain interrupt masking:

Next I explain thread scheduling (thread dispatcher):

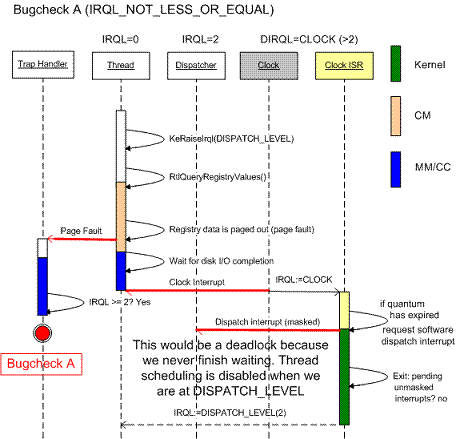
And finally here is the diagram showing when bugcheck A happens and what would happen if it doesn’t exist:

This bugcheck happens in the trap handler and IRQL checking before bugcheck happens in memory manager as you can see from the dump example below. There is no IRQL checking in disassembled handler so it must be in one of Mm functions:

BugCheck A, {3, 1c, 1, 8042d8f9}
0: kd> k
nt!KiTrap0E+0×210
driver!foo+0×209
0: kd> u nt!KiTrap0E nt!KiTrap0E+0×210
nt!KiTrap0E:

8046b05e call    nt!MmAccessFault (8044bfba)

8046b189 call    dword ptr [nt!_imp__KeGetCurrentIrql (8040063c)]
8046b18f lock    inc dword ptr [nt!KiHardwareTrigger (80470cc0)]
8046b196 mov     ecx,[ebp+0×64]
8046b199 and     ecx,0×2
8046b19c shr     ecx,1
8046b19e mov     esi,[ebp+0×68]
8046b1a1 push    esi
8046b1a2 push    ecx
8046b1a3 push    eax
8046b1a4 push    edi
8046b1a5 push    0xa
8046b1a7 call    nt!KeBugCheckEx (8042c1e2)

- Dmitry Vostokov -

WinDbg tips and tricks: analyzing hangs faster

March 4th, 2007

I’ve just found (by using Google) that the additional parameter (-hang) to the venerable !analyze -v command is rarely used… Here is the command I use if I get a manually generated dump and there is no exception in it reported by !analyze -v and subsequent visual inspection of ~*kv output doesn’t show anything suspicious, leading to hidden exception(s):

!analyze -hang -v

Then I always double check with !locks command because there could be multiple hang conditions in a dump.

The same parameter can be used in kernel memory dumps too. But double checking ERESOURCE locks (!locks), kernel threads (!stacks) and DPC queues (!dpcs) manually is highly recommended.

- Dmitry Vostokov -

WinDbg tips and tricks: hypertext commands

March 3rd, 2007

You may know that the recent versions of WinDbg have RichEdit command output window that allows to do syntax highlighting and simulate hyperlinks.

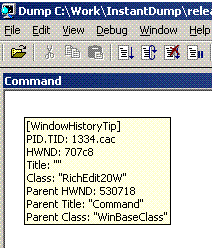
Tooltip from WindowHistory shows window class:

However you may not know there is Debugger Markup Language (DML) and there are new commands that take advantage of it. For documentation please look at dml.doc located in your Debugging Tools for Windows folder.

Here is the output of some commands:

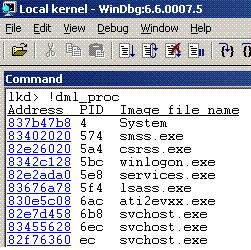
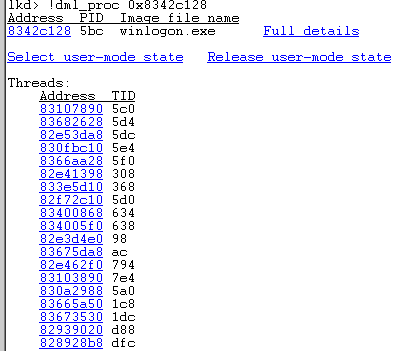
!dml_proc

Here we can click on a process link and get the list of threads:

We can click either on “Full details” link or on an individual thread link to see its call stack. If we select “user-mode state” link we get automatic switch to process context (useful for complete memory dumps):

kd> .process /p /r 0x8342c128
Implicit process is now 8342c128
Loading User Symbols

You can also navigate frames and local variables very easily:

If you click on a thread name (No name here) you get its context:

Clicking on a number sets the scope and shows local variables (if you have full PDB files):


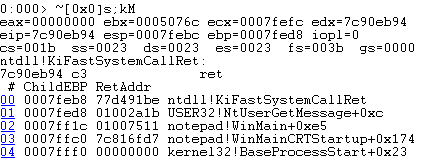
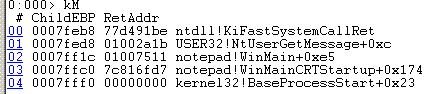
Similar command is kM:

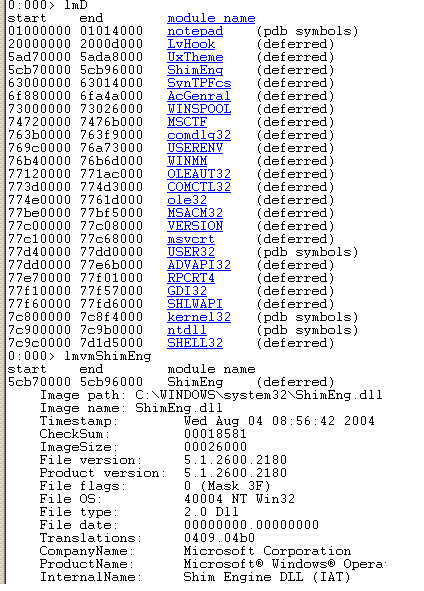
Another useful command is lmD where you can easily inspect modules:

- Dmitry Vostokov -

Crash Dump Analysis AntiPatterns (Part 4)

March 1st, 2007

A customer reports application.exe crashes and you ask for a dump file. You get a dump, open it and see the dump is not from your application.exe. You ask for print spooler crash dump and you get mplayer.exe crash dump. I originally thought to call it Wrong Dump pattern and place it into patterns category but after writing about Zippocricy I clearly see it as anti-pattern. It is not a rocket science to check process name in a dump file before sending it for analysis:

  • Load the user process dump in WinDbg
  • Type command .symfix; .reload; !analyze -v and wait


until WinDbg is not busy analyzing

  • Find PROCESS_NAME: in the output. You get something like:

PROCESS_NAME: spoolsv.exe

You can also use dumpchk.exe from Debugging Tools for Windows.

I’m also writing a new version of Citrix DumpCheck Explorer extension that will include process name in its output.  

Another example is when you ask for a complete memory dump but you get a kernel dump or you get various mini-dumps. Fortunately DumpCheck extension can  warn users before they submit a dump.

- Dmitry Vostokov -

Crash Dump Analysis AntiPatterns (Part 3)

February 28th, 2007

I have heard engineers saying, “I didn’t know about this debugging command, let’s use it!” after training session or reading other people’s analysis of crash dumps. A year later I hear the same phrase from them about another debugging command. In the mean time they continue to use the same set of commands they know about until they hear the old new one.

This is a manifestation of Word of Mouth anti-pattern.

General solution: Know your tools. Study them proactively. RTFM.

Example solution: periodically read and re-read WinDbg help.

More refined solution: debugger.chm on Windows Mobile PC.

- Dmitry Vostokov -

Crash Dump Analysis AntiPatterns (Part 2)

February 28th, 2007

Let’s define Zippocricy - common sin in software support environments worldwide: someone gets something from a customer in archived form and without checking the contents forwards it further to another person in support chain. By the time the evidence gets unzipped somewhere, checked and found corrupt or irrelevant the customer suffers not hours but days.

Happens not only with crash dumps but with any type of problem evidence. 

- Dmitry Vostokov -

The Elements of Crash Dump Analysis Style

February 26th, 2007

After looking at multitude of crash dump analysis reports from different companies and engineers I would like to highlight several rules for good analysis reports:

  • Format your debugger output in fixed size font (Courier New or Lucida Console). This is very important for readability
  • Bold and highlight (using different colors) important addresses or data
  • Keep the same color for the same address or data consistently
  • Use red color for bug manifestation points
  • If you refer to some dump put a link to it

What is considered bad crash dump analysis style? These are:

  • Variable size font (you copy your debugger output to Outlook e-mail as is and it is using the default font)
  • Highlight the whole data set (for example, stack trace) in red
  • Too much irrelevant information

As an example of the good style I advocate (albeit not perfect) please look at the previous post Crash Dump Analysis Case Study

These are my first thoughts about crash and memory dump analysis style and I continue to elaborate it and present more examples later.

- Dmitry Vostokov -

Heap stack traces from W2K3/XP user dump

February 24th, 2007

If you have user mode stack trace DB enabled on Windows 2003 for some service or application (here is an example for Citrix IMA service) and if you get a dump and try to get saved stack traces using !heap extension command you get these errors:

0:000> !heap -k -h 000a0000
    Heap entries for Segment00 in Heap 000a0000
        000a0c50: 00c50 . 00040 [01] - busy (40)
        000a0c90: 00040 . 01818 [07] - busy (1800), tail fill - unable to read heap entry extra at 000a24a0
        000a24a8: 01818 . 00030 [07] - busy (18), tail fill - unable to read heap entry extra at 000a24d0
        000a24d8: 00030 . 005a0 [07] - busy (588), tail fill - unable to read heap entry extra at 000a2a70

The solution is to use Windows 2000 extension ntsdexts.dll:

0:000> !.\w2kfre\ntsdexts.heap -k -h 000a0000
Stack trace (12) at 1021bfc:
   7c85fc22: ntdll!RtlAllocateHeapSlowly+0×00000041
   7c81d4df: ntdll!RtlAllocateHeap+0×00000E9F
   7c83467a: ntdll!LdrpAllocateUnicodeString+0×00000035
   7c8354f4: ntdll!LdrpCopyUnicodeString+0×00000031
   7c83517b: ntdll!LdrpResolveDllName+0×00000195
   7c834b2a: ntdll!LdrpMapDll+0×0000014F
   7c837474: ntdll!LdrpLoadImportModule+0×0000017C
   7c837368: ntdll!LdrpHandleOneNewFormatImportDescriptor+0×0000004D
   7c837317: ntdll!LdrpHandleNewFormatImportDescriptors+0×0000001D
   7c837441: ntdll!LdrpWalkImportDescriptor+0×00000195
   7c80f560: ntdll!LdrpInitializeProcess+0×00000E3E
   7c80ea0b: ntdll!_LdrpInitialize+0×000000D0
   7c82ec2d: ntdll!KiUserApcDispatcher+0×00000025

- Dmitry Vostokov @ DumpAnalysis.org -

Crash dump analysis case study (1)

February 21st, 2007

Consider the following legacy C++/Win32 code fragment highlighted in WinDbg after opening a crash dump:

1: HANDLE hFile = CreateFile(str.GetBuffer(), GENERIC_READ, FILE_SHARE_READ, NULL, OPEN_EXISTING, FILE_ATTRIBUTE_NORMAL, NULL);
2: if (hFile != INVALID_HANDLE_VALUE)
3: {
4:    DWORD dwSize = GetFileSize(hFile, NULL);
5:    DWORD dwRead = 0;
6:    CHAR *bufferA = new CHAR[dwSize+2];
7:    memset(bufferA, 0, dwSize+2);
8:    if (ReadFile(hFile, bufferA, dwSize, &dwRead, NULL))
9:    {
10:      DWORD i = 0, j = 0;
11:      for (; i < dwSize+2-7; ++i)
12:      {
13:         if (bufferA[i] == 0xD && bufferA[i+1] != 0xA)

At the first glance the code seems to be right: we open a file, get its size, allocate a buffer to read, etc. All loop indexes are within array bounds too. Let’s look at disassembly and crash point:

0:000> uf component!CMyDlg::OnTimer


004021bc push    0
004021be push    esi
004021bf call    dword ptr [component!_imp__GetFileSize (0042e26c)]
004021c5 mov     edi,eax ; dwSize
004021c7 lea     ebx,[edi+2] ; dwSize+2
004021ca push    ebx
004021cb mov     dword ptr [esp+34h],0
004021d3 call    component!operator new[] (00408e35)
004021d8 push    ebx
004021d9 mov     ebp,eax ; bufferA
004021db push    0
004021dd push    ebp
004021de call    component!memset (00418500)
004021e3 add     esp,10h
004021e6 push    0
004021e8 lea     edx,[esp+34h]
004021ec push    edx
004021ed push    edi
004021ee push    ebp
004021ef push    esi
004021f0 call    dword ptr [component!_imp__ReadFile (0042e264)]
004021f6 test    eax,eax
004021f8 jne     component!CMyDlg::OnTimer+0×3b1 (00402331)


00402331 xor     esi,esi ; i
00402333 add     edi,0FFFFFFFBh ; +2-7 (edi contains dwSize)
00402336 cmp     edi,esi ; loop condition
00402338 mov     dword ptr [esp+24h],esi
0040233c jbe     component!CMyDlg::OnTimer+0×43e (004023be)
00402342 mov     al,byte ptr [esi+ebp] ; bufferA[i]

0:000> r
eax=00002b00 ebx=00000002 ecx=00431000 edx=00000000 esi=00002b28 edi=fffffffb
eip=00402342 esp=0012efd4 ebp=0095b4d8 iopl=0 nv up ei pl nz ac pe cy
cs=001b ss=0023 ds=0023 es=0023 fs=003b gs=0000 efl=00000217
component!CMyDlg::OnTimer+0×3c2:
00402342 8a042e mov al,byte ptr [esi+ebp] ds:0023:0095e000=??

If we look at ebx (dwSize+2) and edi registers (array upper bound, dwSize+2-7) we can easily see that dwSize was zero. Clearly we had buffer overrun because upper array bound was calculated as 0+2-7 = FFFFFFFB (the loop index was unsigned integer, DWORD). Were the index signed integer variable (int) we wouldn’t have had any problem because the condition 0 < 0+2-7 is always false and the loop body would have never been executed.

Based on that the following fix was proposed:

1: HANDLE hFile = CreateFile(str.GetBuffer(), GENERIC_READ, FILE_SHARE_READ, NULL, OPEN_EXISTING, FILE_ATTRIBUTE_NORMAL, NULL);
2: if (hFile != INVALID_HANDLE_VALUE)
3: {
4:    DWORD dwSize = GetFileSize(hFile, NULL);
5:    DWORD dwRead = 0;
6:    CHAR *bufferA = new CHAR[dwSize+2];
7:    memset(bufferA, 0, dwSize+2);
8:    if (ReadFile(hFile, bufferA, dwSize, &dwRead, NULL))
9:    {
10:      DWORD i = 0, j = 0;
10:      int i = 0, j = 0;
11:      for (; i < dwSize+2-7; ++i)
11:      for (; i < (int)dwSize+2-7; ++i)
12:      {

GetFileSize can return INVALID_FILE_SIZE (0xFFFFFFFF) and operator new can fail theoretically (if the size is too big) so we can correct the code even further:

1: HANDLE hFile = CreateFile(str.GetBuffer(), GENERIC_READ, FILE_SHARE_READ, NULL, OPEN_EXISTING, FILE_ATTRIBUTE_NORMAL, NULL);
2: if (hFile != INVALID_HANDLE_VALUE)
3: {
4:    DWORD dwSize = GetFileSize(hFile, NULL);
4a:   if (dwSize != INVALID_FILE_SIZE)
4b:   {
5:       DWORD dwRead = 0;
6:       CHAR *bufferA = new CHAR[dwSize+2];
6a:      if (bufferA)
6b:      {
7:          memset(bufferA, 0, dwSize+2);
8:          if (ReadFile(hFile, bufferA, dwSize, &dwRead, NULL))
9:          {
10:            int i = 0, j = 0;
11:            for (; i < (int)dwSize+2-7; ++i)
12:            {

- Dmitry Vostokov @ DumpAnalysis.org -
Suspending threads (live kernel debugging)

February 20th, 2007

I couldn’t find any WinDbg command to suspend threads during live kernel debugging session even if you debug a process. This can be useful for debugging or reproducing race condition issues. ~n (suspend) and ~f (freeze) are for user mode live debugging only.

For example, you have one thread that depends on another thread finishing its work earlier. Sometimes, very rarely the latter thread finishes after the moment  the first thread would expect it. In order to model this race condition you can simply patch the prologue code of the second thread worker function with ret instruction. This has the same effect as suspending the thread so it cannot produce required data. 

- Dmitry Vostokov -

InstantDump (JIT Process Dumper)

February 19th, 2007

Techniques utilizing user mode process dumpers and debuggers like Microsoft userdump.exe, NTSD or WinDbg and CDB from Debugging Tools for Windows are too slow to pick up a process and dump it. You need either to attach a debugger manually, run the command line prompt or switch to Task Manager. This deficiency was the primary motivation for me to use JIT (just-in-time) technology for process dumpers. The new tool, InstantDump, will dump a process instantly and non-invasively in a moment when you need it. How does it work? You point to any window and press hot key.

InstantDump could be useful to study hang GUI processes or to get several dumps of the same process during some period of time (CPU spiking case or memory leak, for example) or just dump the process for the sake of dumping it (for curiosity). The tool uses the same tooltip technology introduced in WindowHistory 4.0 to dynamically display window information.

Short user guide:

1. The program will run only on XP/W2K3/Vista (in fact it will not load on W2K).

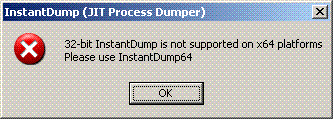
2. Run InstantDump.exe on 32-bit system or InstantDump64.exe on x64 Windows. If you attempt to run InstantDump.exe on x64 Windows it will show this message box and quit:


3. InstantDump puts itself into task bar icon notification area:

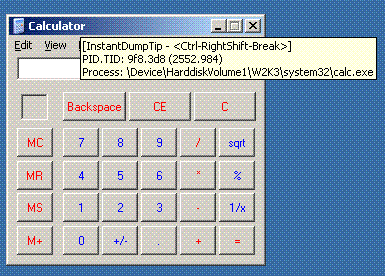
4. By default when you move the mouse pointer over windows the tooltip follows the cursor describing the process and thread id and process image path (you can disable tips in Options dialog box):

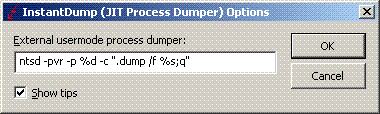
5. If you hold Ctrl-RightShift-Break for less than a second then the process (which window is under the cursor) will be dumped according to the settings for external process dumper in options dialog (accessible via task bar icon right mouse click):


The saved dump name will be (in our Calculator window case): calc.exe_9f8(2552)_22-17-56_18-Feb-2007.dmp

Looks like there is no NTSD in Vista so you have to use another user mode dumper, for example, install MS userdump.exe and specify the following command line in Options dialog:

userdump.exe %d %s

or resort to WinDbg or CDB command line.

The tool can be downloaded from here.

The new version of this tool is under development that will automatically pick up a process name from Task Manager, Process Explorer or Process Monitor (in fact, from any tool that displays the list of processes) and then instantly dump it.

- Dmitry Vostokov -

WindowHistory 4.0

February 15th, 2007

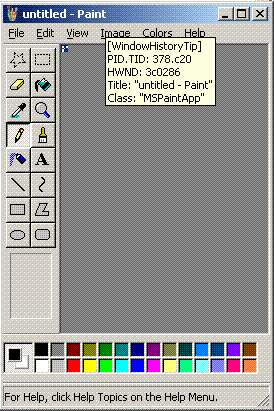
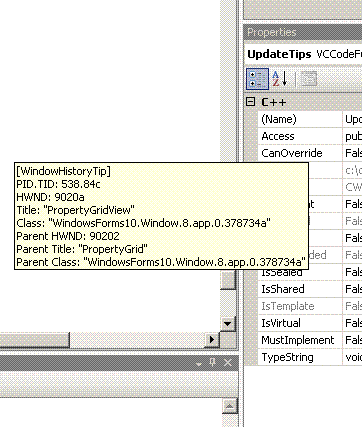
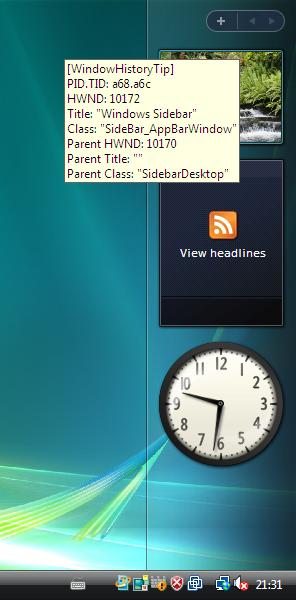
I’ve added tool tips showing window information when pointing at any window. Here are some screenshots:

This works inside Citrix seamless ICA sessions too. Additionally the new version tracks client window rectangle and its changes (this was missing in the previous versions).

It works on Vista (doesn’t require elevation):

32-bit version can be downloaded from Citrix support web site.

64-bit version, which tracks changes for both 32-bit and 64-bit windows on x64 Windows platform, can also be downloaded from Citrix support web site.

- Dmitry Vostokov @ DumpAnalysis.org -
savedump.exe and pagefile

February 14th, 2007

Today I was curious about what savedump.exe does. And after some research I found the following:

On Windows 2000 it is a part of the logon process where it copies the crash dump section from the pagefile to a memory dump and also creates a mini dump file.

http://support.microsoft.com/kb/257299

http://support.microsoft.com/kb/262077

On Windows 2003 and XP savedump.exe doesn’t touch the pagefile. Session manager smss.exe truncates the pagefile and renames it to dumpxxx.dmp file (copying it to the boot volume if necessary). Then savedump.exe copies that file to the correct location and then creates the mini dump file.

http://support.microsoft.com/kb/886429

Also I couldn’t find savedump.exe on Vista. It looks like it was finally removed.

- Dmitry Vostokov -

Easy list traversing (dt vs. !list)

February 11th, 2007

I recently discovered in WinDbg help that dt command can be used for traversing linked lists. Most structures I work with have LIST_ENTRY as their first member and it is much easier to use dt command than !list (less typing) For example:

0:000> dt _MYBIGSTRUCTURE
   +0x000 Links : _LIST_ENTRY
    ...
   +0x080 SomeName : [33] Uint2B

0:000> dd component!MyBigStructureListHead l1
01022cd0  0007fe58

0:000> .enable_unicode 1

The following command outputs the whole list of structures:

0:000> dt _MYBIGSTRUCTURE -l Links.Flink 0007fe58

And the following command outputs the list of SomeName members:

0:000> dt _MYBIGSTRUCTURE -l Links.Flink -y SomeName 0007fe58
Links.Flink at 0×7fe58
   +0×000 Links :  [ 0×8e090 - 0×1022cd0 ]
   +0×080 SomeName : [33]  “Foo”
Links.Flink at 0×8e090
   +0×000 Links :  [ 0×913f8 - 0×7fe58 ]
   +0×080 SomeName : [33]  “Bar”

If you don’t remember exact member name you can specify the partial name and any member that matches will be shown:

0:000> dt _MYBIGSTRUCTURE -l Links.Flink -y S 0007fe58

However it your structure doesn’t have LIST_ENTRY as its first member then you need to subtract its offset, for example:

kd> dd nt!PsActiveProcessHead l1
808af068  85fa48b0

kd> dt _EPROCESS
   +0x000 Pcb              : _KPROCESS
   +0x078 ProcessLock      : _EX_PUSH_LOCK
   +0x080 CreateTime       : _LARGE_INTEGER
   +0x088 ExitTime         : _LARGE_INTEGER
   +0x090 RundownProtect   : _EX_RUNDOWN_REF
   +0x094 UniqueProcessId  : Ptr32 Void
   +0×098 ActiveProcessLinks : _LIST_ENTRY

kd> dt _EPROCESS -l ActiveProcessLinks.Flink -y ImageFileName 85fa48b0-0×98
ActiveProcessLinks.Flink at 0×85fa4818
   +0×098 ActiveProcessLinks :  [ 0×85d1ce20 - 0×808af068 ]
   +0×164 ImageFileName : [16]  “System”
ActiveProcessLinks.Flink at 0×85d1cd88
   +0×098 ActiveProcessLinks :  [ 0×85dba6b8 - 0×85fa48b0 ]
   +0×164 ImageFileName : [16]  “smss.exe”
ActiveProcessLinks.Flink at 0×85dba620
   +0×098 ActiveProcessLinks :  [ 0×858d20b8 - 0×85d1ce20 ]
   +0×164 ImageFileName : [16]  “csrss.exe”
ActiveProcessLinks.Flink at 0×858d2020
   +0×098 ActiveProcessLinks :  [ 0×858c20b8 - 0×85dba6b8 ]
   +0×164 ImageFileName : [16]  “winlogon.exe”
ActiveProcessLinks.Flink at 0×858c2020
   +0×098 ActiveProcessLinks :  [ 0×8589f0b8 - 0×858d20b8 ]
   +0×164 ImageFileName : [16]  “services.exe”

Here is another example, not involving LIST_ENTRY but rather a classic single list forward pointer: 

0:000> !teb
TEB at 7FFDE000
    ExceptionList:    6fc54
    Stack Base:       70000
    Stack Limit:      6d000
    SubSystemTib:     0
    FiberData:        1e00
    ArbitraryUser:    0
    Self:             7ffde000
    EnvironmentPtr:   0
    ClientId:         22c.228
    Real ClientId:    22c.228
    RpcHandle:        0
    Tls Storage:      742b8
    PEB Address:      7ffdf000
    LastErrorValue:   997
    LastStatusValue:  103
    Count Owned Locks:0
    HardErrorsMode:   0

0:000> dt -r _TEB
   +0x000 NtTib : _NT_TIB
      +0x000 ExceptionList : Ptr32 _EXCEPTION_REGISTRATION_RECORD
         +0×000 Next : Ptr32 _EXCEPTION_REGISTRATION_RECORD
         +0×004 Handler : Ptr32
      +0×004 StackBase : Ptr32 Void
      +0×008 StackLimit : Ptr32 Void
      +0×00c SubSystemTib : Ptr32 Void
      +0×010 FiberData : Ptr32 Void
      +0×010 Version : Uint4B
      +0×014 ArbitraryUserPointer : Ptr32 Void
      +0×018 Self : Ptr32 _NT_TIB

0:000> dt _EXCEPTION_REGISTRATION_RECORD -l Next 7FFDE000
Next at 0x7ffde000
   +0x000 Next : 0x0006fc54 _EXCEPTION_REGISTRATION_RECORD
   +0x004 Handler : 0x00070000 +70000
Next at 0x6fc54
   +0x000 Next : 0x0006fcfc _EXCEPTION_REGISTRATION_RECORD
   +0x004 Handler : 0x7c5c1f44 KERNEL32!_except_handler3+0
Next at 0x6fcfc
   +0x000 Next : 0x0006ff5c _EXCEPTION_REGISTRATION_RECORD
   +0x004 Handler : 0x7c2e5649 ADVAPI32!_except_handler3+0
Next at 0x6ff5c
   +0x000 Next : 0x0006ffb0 _EXCEPTION_REGISTRATION_RECORD
   +0x004 Handler : 0x7c2e5649 ADVAPI32!_except_handler3+0
Next at 0x6ffb0
   +0x000 Next : 0x0006ffe0 _EXCEPTION_REGISTRATION_RECORD
   +0x004 Handler : 0x01015878 component!_except_handler3+0
Next at 0x6ffe0
   +0x000 Next : 0xffffffff _EXCEPTION_REGISTRATION_RECORD
   +0x004 Handler : 0x7c5c1f44 KERNEL32!_except_handler3+0

- Dmitry Vostokov -

Crash Dump Analysis in Visual Studio 2005

February 10th, 2007

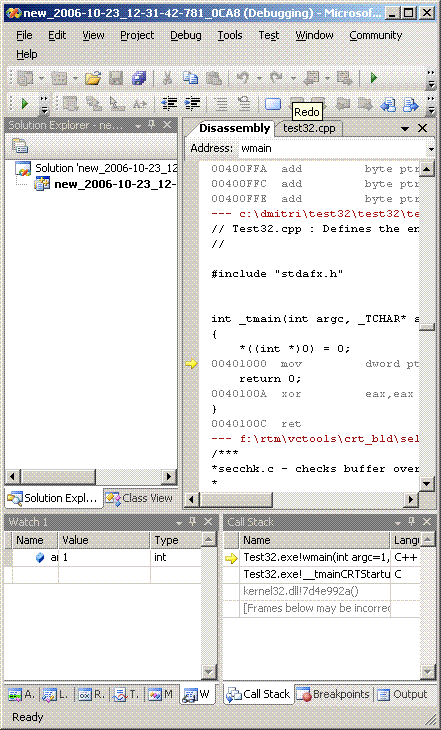
If you open a user crash dump as a solution/project, not a as file then you can do crash dump analysis by using Visual Studio debug windows, for example, powerful Watch window. As you can see from the picture I loaded a crash dump from my test application saved by NTSD and it shows assembly code and source code nicely interleaved.

If you need to specify additional symbol paths or symbol server settings you can do it in Tools \ Options \ Debugging \ Symbols dialog.

This might be good for you if you are used to do live debugging in Visual Studio and have no experience in using WinDbg and you need to look at your application crash dumps sent by customers.

- Dmitry Vostokov -