Bugchecks depicted: IRQL_NOT_LESS_OR_EQUAL
During kernel debugging training I’m providing I came up to the idea to use UML sequence diagrams to depict various Windows kernel behavior including bugchecks. Today I start with bugcheck A. To understand why this bugcheck is needed you need to understand the difference between thread scheduling and IRQL and I use the following diagram to illustrate it:
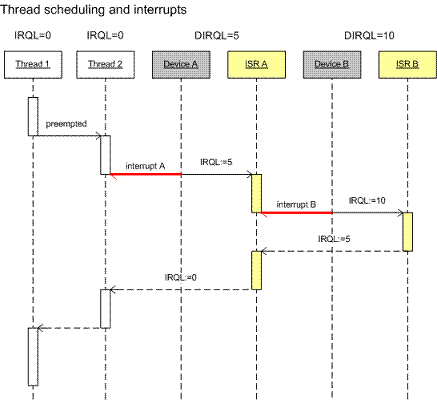
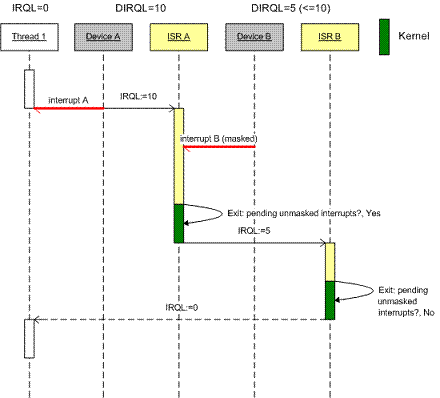
Then I explain interrupt masking:
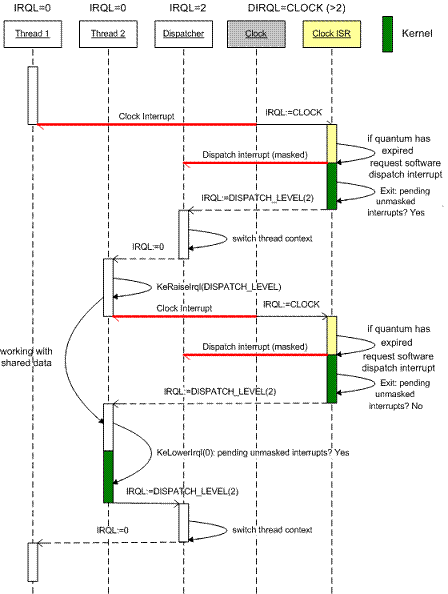
Next I explain thread scheduling (thread dispatcher):
And finally here is the diagram showing when bugcheck A happens and what would happen if it doesn’t exist:
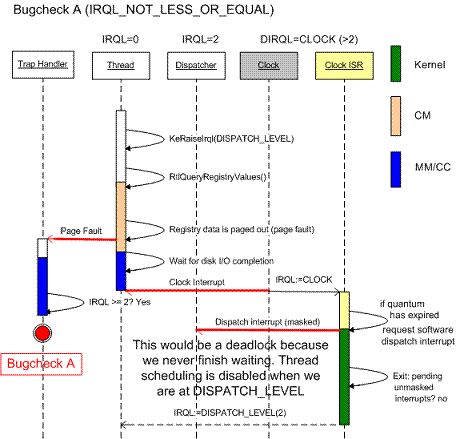
This bugcheck happens in the trap handler and IRQL checking before bugcheck happens in memory manager as you can see from the dump example below. There is no IRQL checking in disassembled handler so it must be in one of Mm functions:
BugCheck A, {3, 1c, 1, 8042d8f9}

0: kd> k

nt!KiTrap0E+0×210

driver!foo+0×209

0: kd> u nt!KiTrap0E nt!KiTrap0E+0×210

nt!KiTrap0E:

…

8046b05e call    nt!MmAccessFault (8044bfba)

…

8046b189 call    dword ptr [nt!_imp__KeGetCurrentIrql (8040063c)]

8046b18f lock    inc dword ptr [nt!KiHardwareTrigger (80470cc0)]

8046b196 mov     ecx,[ebp+0×64]

8046b199 and     ecx,0×2

8046b19c shr     ecx,1

8046b19e mov     esi,[ebp+0×68]

8046b1a1 push    esi

8046b1a2 push    ecx

8046b1a3 push    eax

8046b1a4 push    edi

8046b1a5 push    0xa

8046b1a7 call    nt!KeBugCheckEx (8042c1e2)
- Dmitry Vostokov -
May 22nd, 2008 at 11:06 pm
I have a similar crash dump as follows…..
*** Fatal System Error: 0×0000000a
(0xFE920090,0×0000001C,0×00000001,0×80434527)
Break instruction exception - code 80000003 (first chance)
A fatal system error has occurred.
Debugger entered on first try; Bugcheck callbacks have not been invoked.
A fatal system error has occurred.
Connected to Windows 2000 2195 x86 compatible target, ptr64 FALSE
Loading Kernel Symbols
Loading User Symbols
PEB address is NULL !
Loading unloaded module list
* *
* Bugcheck Analysis *
* *
Use !analyze -v to get detailed debugging information.
BugCheck A, {fe920090, 1c, 1, 80434527}
Probably caused by : ntkrnlmp.exe ( nt!KiUnwaitThread+d )
Followup: MachineOwner
———
nt!RtlpBreakWithStatusInstruction:
8045836c cc int 3
0: kd> !analyze -v
* *
* Bugcheck Analysis *
* *
IRQL_NOT_LESS_OR_EQUAL (a)
An attempt was made to access a pageable (or completely invalid) address at an
interrupt request level (IRQL) that is too high. This is usually
caused by drivers using improper addresses.
If a kernel debugger is available get the stack backtrace.
Arguments:
Arg1: fe920090, memory referenced
Arg2: 0000001c, IRQL
Arg3: 00000001, bitfield :
bit 0 : value 0 = read operation, 1 = write operation
bit 3 : value 0 = not an execute operation, 1 = execute operation (only on chips which support this level of status)
Arg4: 80434527, address which referenced memory
Debugging Details:
——————
WRITE_ADDRESS: fe920090 Nonpaged pool
CURRENT_IRQL: 1c
FAULTING_IP:
nt!KiUnwaitThread+d
80434527 8916 mov dword ptr [esi],edx
DEFAULT_BUCKET_ID: DRIVER_FAULT
BUGCHECK_STR: 0xA
PROCESS_NAME: System
TRAP_FRAME: eb423e28 — (.trap 0xffffffffeb423e28)
ErrCode = 00000002
eax=b05f0f28 ebx=fea29560 ecx=fea29560 edx=fe920090 esi=fe920090 edi=fea29650
eip=80434527 esp=eb423e9c ebp=eb423ec0 iopl=0 nv up ei pl nz na pe nc
cs=0008 ss=0010 ds=0023 es=0023 fs=0030 gs=0000 efl=00010206
nt!KiUnwaitThread+0xd:
80434527 8916 mov dword ptr [esi],edx ds:0023:fe920090=????????
Resetting default scope
LAST_CONTROL_TRANSFER: from 8042bf7f to 8045836c
STACK_TEXT:
eb423a50 8042bf7f 00000003 eb423a98 fe920090 nt!RtlpBreakWithStatusInstruction
eb423a80 8042c572 00000003 fe920090 80434527 nt!KiBugCheckDebugBreak+0×31
eb423e0c 8046b1ac 00000000 fe920090 0000001c nt!KeBugCheckEx+0×390
eb423e0c 80434527 00000000 fe920090 0000001c nt!KiTrap0E+0×210
eb423ea0 80434753 00000000 eb423ed8 fea29648 nt!KiUnwaitThread+0xd
eb423ec0 80433af0 0000003d fea29660 eb423fcc nt!KiWaitTest+0xdf
eb423fb0 80433a7a 4bfa3d5c ffdff848 ffdff000 nt!KiTimerListExpire+0×6e
eb423fdc 80467738 80485600 00000000 00008b3d nt!KiTimerExpiration+0xb6
eb423ff4 8046c47b eb41f99c 00000000 00000000 nt!KiRetireDpcList+0×47
eb423ff8 eb41f99c 00000000 00000000 00000000 nt!KiDispatchInterrupt+0×2b
WARNING: Frame IP not in any known module. Following frames may be wrong.
8046c47b 00000000 00000008 bb837d75 00000128 0xeb41f99c
STACK_COMMAND: kb
FOLLOWUP_IP:
nt!KiUnwaitThread+d
80434527 8916 mov dword ptr [esi],edx
SYMBOL_STACK_INDEX: 4
SYMBOL_NAME: nt!KiUnwaitThread+d
FOLLOWUP_NAME: MachineOwner
MODULE_NAME: nt
IMAGE_NAME: ntkrnlmp.exe
DEBUG_FLR_IMAGE_TIMESTAMP: 45ec3c8f
FAILURE_BUCKET_ID: 0xA_W_VRF_nt!KiUnwaitThread+d
BUCKET_ID: 0xA_W_VRF_nt!KiUnwaitThread+d
Followup: MachineOwner
———
Could you please explain me how to get rid of this bugcheck
Thanks in Advance.
Anvesh
August 6th, 2009 at 4:05 pm
[…] explanation for IRQL_NOT_LESS_OR_EQUAL (pp. 100 - 101) - a few years ago I was pondering about this and created a UML sequence diagram to convince myself: http://www.dumpanalysis.org/blog/index.php/2007/03/06/bugchecks-depicted-irql_not_less_or_equal/ […]