GDB for WinDbg Users (Part 7)

October 26th, 2007

It has been some time since I wrote the previous part. Here I will put some useful links. First link is a paper from Greg Lehey with core dump analysis cases studies on FreeBSD Intel platform using GDB and DDB (interactive kernel debugger)

Debugging Kernel Problems   

The second link is a modern x86 assembly language book written by Richard Blum featuring AT&T syntax, GAS and GDB, interfacing with C language and Linux system calls, optimized compiler code, FPU and SIMD commands, inline and GCC generated assembly code:

Professional Assembly Language

Buy from Amazon

- Dmitry Vostokov @ DumpAnalysis.org -

The list of Citrix services

October 26th, 2007

In kernel or complete memory dumps coming from Windows servers running Citrix Presentation Server 4.x you might see the following processes running in session 0, for example:

2: kd> !process 0 0

PROCESS 895c7380  SessionId: 0  Cid: 03f0    Peb: 7ffdf000  ParentCid: 01a8
    DirBase: 0a43d220  ObjectTable: 895c7628  HandleCount: 684.
    Image: CpSvc.exe

PROCESS 892e3320  SessionId: 0  Cid: 060c    Peb: 7ffdf000  ParentCid: 01a8
    DirBase: 0a43d440  ObjectTable: 892e76c8  HandleCount:  93.
    Image: cdmsvc.exe

PROCESS 892ed4a0  SessionId: 0  Cid: 05f8    Peb: 7ffdf000  ParentCid: 01a8
    DirBase: 0a43d420  ObjectTable: 892f1268  HandleCount: 107.
    Image: CdfSvc.exe

PROCESS 89297020  SessionId: 0  Cid: 06ac    Peb: 7ffdf000  ParentCid: 01a8
    DirBase: 0a43d520  ObjectTable: 892991c8  HandleCount:  62.
    Image: encsvc.exe

PROCESS 892a4020  SessionId: 0  Cid: 06d4    Peb: 7ffdf000  ParentCid: 01a8
    DirBase: 0a43d540  ObjectTable: 892b9a48  HandleCount: 1088.
    Image: ImaSrv.exe

PROCESS 892a5020  SessionId: 0  Cid: 070c    Peb: 7ffdf000  ParentCid: 01a8
    DirBase: 0a43d560  ObjectTable: 8927b568  HandleCount: 188.
    Image: mfcom.exe

PROCESS 890e8620  SessionId: 0  Cid: 0cc4    Peb: 7ffdf000  ParentCid: 01a8
    DirBase: 0a43d6e0  ObjectTable: 890e8948  HandleCount: 691.
    Image: SmaService.exe

PROCESS 8901bd60  SessionId: 0  Cid: 0d80    Peb: 7ffdf000  ParentCid: 01a8
    DirBase: 0a43d880  ObjectTable: 89021e88  HandleCount: 148.
    Image: XTE.exe

PROCESS 88fce020  SessionId: 0  Cid: 1204    Peb: 7ffdf000  ParentCid: 01a8
    DirBase: 0a43d900  ObjectTable: 88fcfac8  HandleCount: 186.
    Image: ctxwmisvc.exe

These are Citrix services and the following Citrix article describes them:

Citrix Presentation Server Services Overview

- Dmitry Vostokov @ DumpAnalysis.org -

Threads as braided strings in abstract space (1)

October 25th, 2007

In the past I was trying to find a way to depict running and blocked threads graphically perhaps as strings in some abstract n-dimensional space (manifold), preferably 3-dimensional manifold. If you have never encountered manifolds here is their informal definition:

3-dimensional manifold is a 3-dimensional space that looks like a 3-dimensional Euclidean space locally (in small regions) so we can explore the manifold space like we do in our 3-dimensional spatial world

Example: the surface of a sphere where small regions look like 2-dimensional rectangles (compare Earth surface and a football field on it)

My infrequent attempts were not satisfactory and only recently after reading the book Towards a Philosophy of Real Mathematics written by David Corfield I’ve found that it might be good to represent threads as n-string braids.

 Buy from Amazon

Braids are strings that raise monotonically without reversing their direction. It sounds like an arrow of time during computation. Braid theory is related to knot theory and might be at a good metaphor to explore. To picture thread strings we need to find abstract coordinates for our space. One of axes is obviously time axis and the other is a program counter axis (for example, the value of EIP register). 

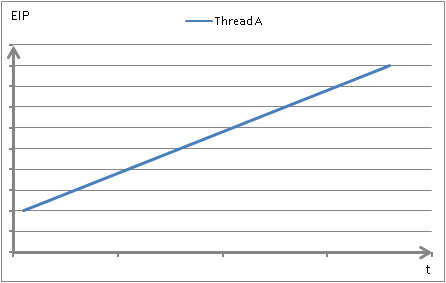
Here is a thread running through code sequentially without jumps or loops, acquiring and releasing a spinlock on its way:


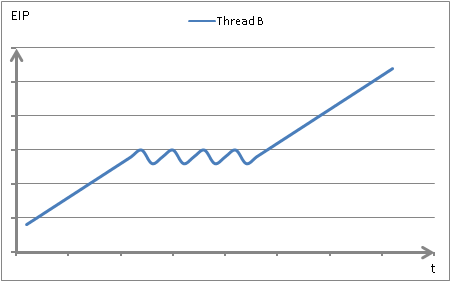
Here is another thread looping while trying to acquire a spinlock and finally taking ownership of it and then running through the same code sequentially:

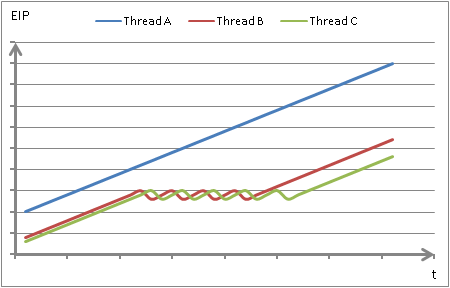
Suppose that both threads contend for the same spinlock and there is a 3rd thread doing the same. Let’s overlay them on one single diagram:

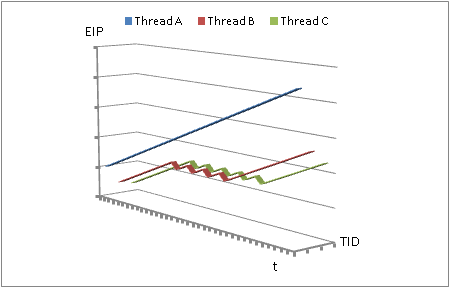
To have a perspective we can add a 3rd dimension - thread number or ID (TID):

Instead of TID axis we can use data address axis (the data address accessed by the current instruction) or have it as a 4th dimension. If we want to differentiate between read and write addresses we can add 5th axis. We will try to do it in the next part.

- Dmitry Vostokov @ DumpAnalysis.org -

JIT service debugging

October 24th, 2007

If you have services running under network service account (prior to Vista) and they crash you can use NTSD from recent Debugging Tools for Windows and -noio switch as described in the following article:

http://www.debuginfo.com/articles/ntsdwatson.html 

You need to copy the latest ntsd.exe, dbghelp.dll and dbgeng.dll to some folder on your system if you don’t want to install Debugging Tools for Windows in your production environment.

The AeDebug key I use for 64-bit JIT debugging is

C:\ntsd\ntsd -p %ld -e %ld -g -noio -c ".dump /ma /u c:\TEMP\new.dmp; q"

It is always good to double check settings with TestDefaultDebugger tool.

- Dmitry Vostokov @ DumpAnalysis.org -

Memory Dump - A Mathematical Definition

October 24th, 2007

This is the first post in Science of Memory Dump Analysis category where I apply philosophy, systems theory, mathematics, physics and computer science ideas. It was inspired after reading Life Itself book written by Robert Rosen where computers are depicted as direct sums of states. As shown in that book, in the case of machines, their synthetic models (direct sums) are equivalent to analytic models (direct product of observables). Taking every single bit as an observable having its values in Z2 set {0, 1} we can make a definition of an ideal memory dump as a direct product or a direct sum of bits saved instantaneously at the given time:

i si = i si

Of course, we can also consider bytes having 8 bits as observables having their values from Z256 set, etc.

In our case we can simply rewrite direct sum or product as the list of bits, bytes, words or double words, etc:

(…, si-1, si, si+1, …, sj-1, sj, sj+1, …)

According to Rosen we include hardware states (registers, for example) and partition memory into input, output states for particular computation and other states.

Saving a memory dump takes certain amount of time. Suppose that it takes 3 discrete time events (ticks). During the first tick we save memory up to (…, si-1, si) and that memory has some relationship to sj state. During the second tick sj state changes its value and during the 3rd tick we copy the rest of the memory (si+1, …, sj-1, sj, sj+1, …). Now we see that the final memory dump is inconsistent:

(…, si-1, si, si+1, …, sj-1, sj, sj+1, …)

I explained this earlier in plain words in Inconsistent Dump pattern. Therefore we might consider a real memory dump as a direct sum of disjoint memory areas Mt taken during some time interval (t0, …, tn)

M = t Mt where Mt = k stk or simply

M = t k stk

- Dmitry Vostokov @ DumpAnalysis.org -

Crash Dump Analysis Patterns (Part 32)

October 23rd, 2007

When we look at a thread and it is not in the Passive Thread list and looks more like Blocked Thread we may ask whether it is Main Thread. Every process has at least one thread of execution called main or primary thread. Most GUI applications have window message processing loop inside their main process thread. When a memory dump is saved it is most likely that this thread is blocked waiting for window or user-defined messages to arrive and can be considered as Passive Thread. If we see it blocked on something else waiting for some time we may consider that the application was hanging. 

Here is an example of the normal iexplore.exe thread stack taken from a kernel dump:

PROCESS 88de4140  SessionId: 3  Cid: 15a8    Peb: 7ffdf000  ParentCid: 0e28
    DirBase: 0a43df40  ObjectTable: 88efe008  TableSize: 852.
    Image: IEXPLORE.EXE
    VadRoot 88dbbca8 Clone 0 Private 6604. Modified 951. Locked 0.
    DeviceMap 88de6408
    Token                             e3f5ccf0
    ElapsedTime                        0:10:52.0281
    UserTime                          0:00:06.0250
    KernelTime                        0:00:10.0421
    QuotaPoolUsage[PagedPool]         126784
    QuotaPoolUsage[NonPagedPool]      197704
    Working Set Sizes (now,min,max)  (8347, 50, 345) (33388KB, 200KB, 1380KB)
    PeakWorkingSetSize                10000
    VirtualSize                       280 Mb
    PeakVirtualSize                   291 Mb
    PageFaultCount                    15627
    MemoryPriority                    FOREGROUND
    BasePriority                      8
    CommitCharge                      7440

THREAD 88ee2b00  Cid 15a8.1654  Teb: 7ffde000  Win32Thread: a2242018 WAIT: (WrUserRequest) UserMode Non-Alertable
    88f82ee0  SynchronizationEvent
Not impersonating
Owning Process 88de4140
Wait Start TickCount    104916        Elapsed Ticks: 0
Context Switch Count    100208                   LargeStack
UserTime                  0:00:04.0484
KernelTime                0:00:09.0859
Start Address KERNEL32!BaseProcessStartThunk (0x7c57b70c)
Stack Init be597000 Current be596cc8 Base be597000 Limit be58f000 Call 0
Priority 12 BasePriority 8 PriorityDecrement 0 DecrementCount 0

ChildEBP RetAddr
be596ce0 8042d8d7 nt!KiSwapThread+0x1b1
be596d08 a00019c2 nt!KeWaitForSingleObject+0x1a3
be596d44 a00138c5 win32k!xxxSleepThread+0x18a
be596d54 a00138d1 win32k!xxxWaitMessage+0xe
be596d5c 8046b2a9 win32k!NtUserWaitMessage+0xb
be596d5c 77e3c7cd nt!KiSystemService+0xc9

In the same kernel dump there is another iexplore.exe process with the following main thread stack which had been blocked for 31 seconds:

PROCESS 8811ca00  SessionId: 21  Cid: 4d18    Peb: 7ffdf000  ParentCid: 34c8
    DirBase: 0a086ee0  ObjectTable: 87d07528  TableSize: 677.
    Image: IEXPLORE.EXE
    VadRoot 87a92ae8 Clone 0 Private 4600. Modified 227. Locked 0.
    DeviceMap 88b174e8
    Token                             e49508d0
    ElapsedTime                        0:08:03.0062
    UserTime                          0:00:01.0531
    KernelTime                        0:00:10.0375
    QuotaPoolUsage[PagedPool]         120792
    QuotaPoolUsage[NonPagedPool]      198376
    Working Set Sizes (now,min,max)  (7726, 50, 345) (30904KB, 200KB, 1380KB)
    PeakWorkingSetSize                7735
    VirtualSize                       272 Mb
    PeakVirtualSize                   275 Mb
    PageFaultCount                    11688
    MemoryPriority                    BACKGROUND
    BasePriority                      8
    CommitCharge                      6498

THREAD 87ce6da0  Cid 4d18.4c68  Teb: 7ffde000  Win32Thread: a22157b8 WAIT: (Executive) KernelMode Non-Alertable
    b5bd6370  NotificationEvent
IRP List:
    885d4808: (0006,00dc) Flags: 00000014  Mdl: 00000000
Not impersonating
Owning Process 8811ca00
Wait Start TickCount    102908        Elapsed Ticks: 2008
Context Switch Count    130138                   LargeStack
UserTime                  0:00:01.0125
KernelTime                0:00:08.0843
Start Address KERNEL32!BaseProcessStartThunk (0×7c57b70c)
Stack Init b5bd7000 Current b5bd62f4 Base b5bd7000 Limit b5bcf000 Call 0
Priority 8 BasePriority 8 PriorityDecrement 0 DecrementCount 0

ChildEBP RetAddr
b5bd630c 8042d8d7 nt!KiSwapThread+0x1b1
b5bd6334 bf09342d nt!KeWaitForSingleObject+0x1a3
b5bd6380 bf08896f mrxsmb!SmbCeAssociateExchangeWithMid+0x24b
b5bd63b0 bf0aa0ef mrxsmb!SmbCeTranceive+0xff
b5bd6490 bf0a92df mrxsmb!SmbTransactExchangeStart+0x559
b5bd64a8 bf0a9987 mrxsmb!SmbCeInitiateExchange+0x2ac
b5bd64c4 bf0a96e2 mrxsmb!SmbCeSubmitTransactionRequest+0x124
b5bd6524 bf0ac7c3 mrxsmb!_SmbCeTransact+0x86
b5bd6608 bf104ea0 mrxsmb!MRxSmbQueryFileInformation+0x553
b5bd66b4 bf103aff rdbss!__RxInitializeTopLevelIrpContext+0x52
b5bd6784 bf10da73 rdbss!WPP_SF_ZL+0x4b
b5bd67b4 bf0a8b29 rdbss!RxCleanupPipeQueues+0x117
b5bd67d4 8041ef05 mrxsmb!MRxSmbFsdDispatch+0x118
b5bd67e8 eb833839 nt!IopfCallDriver+0x35
b5bd6890 804a8109 nt!IopQueryXxxInformation+0x164
b5bd68b0 804c7d63 nt!IoQueryFileInformation+0x19
b5bd6a4c 80456562 nt!IopParseDevice+0xe8f
b5bd6ac4 804de0c0 nt!ObpLookupObjectName+0x504
b5bd6bd4 804a929b nt!ObOpenObjectByName+0xc8
b5bd6d54 8046b2a9 nt!NtQueryFullAttributesFile+0xe7
b5bd6d54 77f88887 nt!KiSystemService+0xc9

0: kd> !whattime 0n2008
2008 Ticks in Standard Time: 31.375s

Main thread need not be GUI thread. Most input console applications have ReadConsole calls in normal main process thread stack:

0:000> kL
ChildEBP RetAddr
0012fc6c 77d20190 ntdll!KiFastSystemCallRet
0012fc70 77d27fdf ntdll!NtRequestWaitReplyPort+0xc
0012fc90 765d705c ntdll!CsrClientCallServer+0xc2
0012fd8c 76634674 kernel32!ReadConsoleInternal+0x1cd
0012fe14 765eaf6a kernel32!ReadConsoleA+0×40
0012fe7c 6ec35196 kernel32!ReadFile+0×84
0012fec0 6ec35616 MSVCR80!_read_nolock+0×201
0012ff04 6ec45928 MSVCR80!_read+0xc0
0012ff1c 6ec49e47 MSVCR80!_filbuf+0×78
0012ff54 0040100d MSVCR80!getc+0×113
0012ff5c 0040117c ConsoleTest!wmain+0xd
0012ffa0 765d3833 ConsoleTest!__tmainCRTStartup+0×10f
0012ffac 77cfa9bd kernel32!BaseThreadInitThunk+0xe
0012ffec 00000000 ntdll!_RtlUserThreadStart+0×23

0:000> kL
ChildEBP RetAddr
001cf594 77d20190 ntdll!KiFastSystemCallRet
001cf598 77d27fdf ntdll!NtRequestWaitReplyPort+0xc
001cf5b8 765d705c ntdll!CsrClientCallServer+0xc2
001cf6b4 765d6efe kernel32!ReadConsoleInternal+0x1cd
001cf740 49ecd538 kernel32!ReadConsoleW+0×47
001cf7a8 49ecd645 cmd!ReadBufFromConsole+0xb5
001cf7d4 49ec2247 cmd!FillBuf+0×175
001cf7d8 49ec2165 cmd!GetByte+0×11
001cf7f4 49ec20d8 cmd!Lex+0×75
001cf80c 49ec207f cmd!GeToken+0×27
001cf81c 49ec200a cmd!ParseStatement+0×36
001cf830 49ec6038 cmd!Parser+0×46
001cf878 49ecc703 cmd!main+0×1de
001cf8bc 765d3833 cmd!_initterm_e+0×163
001cf8c8 77cfa9bd kernel32!BaseThreadInitThunk+0xe
001cf908 00000000 ntdll!_RtlUserThreadStart+0×23

- Dmitry Vostokov @ DumpAnalysis.org -

Old dumps, new extensions

October 23rd, 2007

Up to now I’ve been using old Windows 2000 WinDbg extensions to extract information from Windows 2003 and XP crash dumps when their native extensions failed. Today I have found I can do the way around, to extract information from old Windows 2000 crash dumps using WinDbg extensions written for Windows XP and later. Here is an example. WinDbg !stacks command shows the following not really helpful output from Windows 2000 complete memory dump:

2: kd> !stacks
Proc.Thread  Thread   Ticks   ThreadState Blocker
                                     [System]
   8.000004  89df8220 0000000 BLOCKED     nt!KiSwapThread+0x1b1
   8.00000c  89dc1860 0003734 BLOCKED     nt!KiSwapThread+0x1b1
   8.000010  89dc15e0 0003734 BLOCKED     nt!KiSwapThread+0x1b1
   8.000014  89dc1360 00003b4 BLOCKED     nt!KiSwapThread+0x1b1
   8.000018  89dc10e0 0003734 BLOCKED     nt!KiSwapThread+0x1b1
   8.00001c  89dc0020 0000381 BLOCKED     nt!KiSwapThread+0x1b1
   8.000020  89dc0da0 00066f6 BLOCKED     nt!KiSwapThread+0x1b1
   8.000024  89dc0b20 00025b4 BLOCKED     nt!KiSwapThread+0x1b1
   8.000028  89dc08a0 00025b4 BLOCKED     nt!KiSwapThread+0x1b1
   8.00002c  89dc0620 0003734 BLOCKED     nt!KiSwapThread+0x1b1
   8.000030  89dc03a0 0003734 BLOCKED     nt!KiSwapThread+0x1b1
   8.000034  89dbf020 00025b4 BLOCKED     nt!KiSwapThread+0x1b1
   8.000038  89dbfda0 00025b4 BLOCKED     nt!KiSwapThread+0x1b1
   8.00003c  89dbfb20 00007b4 BLOCKED     nt!KiSwapThread+0x1b1
   8.000040  89dbf8a0 00007b4 BLOCKED     nt!KiSwapThread+0x1b1
   8.000044  89dbf620 0000074 BLOCKED     nt!KiSwapThread+0x1b1
   8.000048  89dbf3a0 00007b4 BLOCKED     nt!KiSwapThread+0x1b1
...
...
...

This command belongs to different WinDbg extension DLLs (from WinDbg help):

Windows NT 4.0         Unavailable
Windows 2000           Kdextx86.dll
Windows XP and later   Kdexts.dll

and I tried newer kdexts.dll with better results:

2: kd> !winxp\kdexts.stacks
Proc.Thread  .Thread  Ticks   ThreadState Blocker
                            [89df84a0 System]
   8.0000c8  89db77c0 0000000 Blocked    nt!MiRemoveUnusedSegments+0xf4
   8.0000f0  89c8a020 0019607 Blocked    cpqasm2+0x1ef0
   8.000108  89881900 0000085 Blocked    CPQCISSE+0x3ae8
   8.000110  8982cda0 000000a Blocked    cpqasm2+0x2a523
   8.00013c  8974a9a0 00007d7 Blocked    rdbss!RxSetMinirdrCancelRoutine+0x3d
   8.000148  89747b20 000010a Blocked    rdbss!RxIsOkToPurgeFcb+0x3f
   8.00014c  89758a80 0019493 Blocked    nt!NtNotifyChangeMultipleKeys+0x434
   8.0002dc  89620680 000000e Blocked    cpqasm2+0x5523
   8.0002e0  89620400 00000d2 Blocked    cpqasm2+0x584d
   8.0004ac  895ae9c0 000955b Blocked    srv!SrvOemStringTo8dot3+0xb7
   8.0004c0  8937b4e0 0018fea Blocked    srv!SrvOemStringTo8dot3+0xb7
   8.0004a0  895b09e0 0018fe9 Blocked    srv!SrvOemStringTo8dot3+0xb7
   8.0004cc  893784e0 0018fe8 Blocked    srv!SrvOemStringTo8dot3+0xb7
   8.0004d0  893774e0 000955b Blocked    srv!SrvOemStringTo8dot3+0xb7
   8.0004d4  893764e0 0018fe8 Blocked    srv!SrvOemStringTo8dot3+0xb7
   8.003d68  87abb580 00000b7 Blocked    rdbss!RxSearchForCollapsibleOpen+0x17c
   8.002b94  88e4f180 00000b9 Blocked    rdbss!RxSearchForCollapsibleOpen+0x17c

                            [89736940 smss.exe]

                            [896d3b20 csrss.exe]
 178.000180  896c8020 0000012 Blocked    ntdll!NtReplyWaitReceivePort+0xb
 178.00018c  896c5320 0000012 Blocked    ntdll!NtReplyWaitReceivePort+0xb
 178.001260  88fbcb20 0000060 Blocked    ntdll!NtReplyWaitReceivePort+0xb
 178.001268  88fbbda0 0000060 Blocked    ntdll!NtReplyWaitReceivePort+0xb

                            [896c8740 WINLOGON.EXE]
 174.00019c  896b7740 0000299 Blocked    ntdll!ZwDelayExecution+0xb
 174.0001a0  896b6020 00015dd Blocked    ntdll!NtRemoveIoCompletion+0xb
 174.000f08  8913eda0 00000b0 Blocked    ntdll!ZwWaitForMultipleObjects+0xb
 174.000f0c  8901b020 00000b0 Blocked    ntdll!ZwWaitForSingleObject+0xb

- Dmitry Vostokov @ DumpAnalysis.org -

The search for ‘Ddk’ tag

October 22nd, 2007

Sometimes we get pool allocation failures and the driver’s tag is ‘Ddk’:

0: kd> !vm

*** Virtual Memory Usage ***
 Physical Memory:      851775 (   3407100 Kb)
 Page File: \??\C:\pagefile.sys
   Current:   4190208 Kb  Free Space:   4175708 Kb
   Minimum:   4190208 Kb  Maximum:      4190208 Kb
 Available Pages:      147274 (    589096 Kb)
 ResAvail Pages:       769287 (   3077148 Kb)
 Locked IO Pages:         118 (       472 Kb)
 Free System PTEs:     184910 (    739640 Kb)
 Free NP PTEs:            110 (       440 Kb)
 Free Special NP:           0 (         0 Kb)
 Modified Pages:          168 (       672 Kb)
 Modified PF Pages:       168 (       672 Kb)
 NonPagedPool Usage:    64445 (    257780 Kb)
 NonPagedPool Max:      64640 (    258560 Kb)
 ********** Excessive NonPaged Pool Usage *****

 PagedPool 0 Usage:     21912 (     87648 Kb)
 PagedPool 1 Usage:       691 (      2764 Kb)
 PagedPool 2 Usage:       706 (      2824 Kb)
 PagedPool 3 Usage:       704 (      2816 Kb)
 PagedPool 4 Usage:       708 (      2832 Kb)
 PagedPool Usage:       24721 (     98884 Kb)
 PagedPool Maximum:    134144 (    536576 Kb)

 ********** 429 pool allocations have failed **********

 Shared Commit:          5274 (     21096 Kb)
 Special Pool:              0 (         0 Kb)
 Shared Process:         3958 (     15832 Kb)
 PagedPool Commit:      24785 (     99140 Kb)
 Driver Commit:         19289 (     77156 Kb)
 Committed pages:      646282 (   2585128 Kb)
 Commit limit:        1860990 (   7443960 Kb)

0: kd> !poolused 3
   Sorting by  NonPaged Pool Consumed

  Pool Used:
            NonPaged
 Tag    Allocs    Frees     Diff     Used
 Ddk   9074558  3859522  5215036 225708304 Default for driver allocated memory (user’s of ntddk.h)

How do we find which driver had caused this memory leak? We can search for drivers using the following command:

C:\>findstr /S /m /l hDdk *.sys  

or we can guess the driver using the fact that long time ago ExAllocatePool was defined as ExAllocatePoolWithTag(, … ‘Ddk ‘). Currently all DDK samples use their separate driver tags and ExAllocatePool uses ‘None’:

0: kd> .asm no_code_bytes
Assembly options: no_code_bytes

0: kd> uf ExAllocatePool
nt!ExAllocatePool:
80894d1f mov     edi,edi
80894d21 push    ebp
80894d22 mov     ebp,esp
80894d24 push    656E6F4Eh
80894d29 push    dword ptr [ebp+0Ch]
80894d2c push    dword ptr [ebp+8]
80894d2f call    nt!ExAllocatePoolWithTag (8089b93f)
80894d34 pop     ebp
80894d35 ret     8

0: kd> .formats 656E6F4Eh
Evaluate expression:
  Hex:     656e6f4e
  Decimal: 1701736270
  Octal:   14533467516
  Binary:  01100101 01101110 01101111 01001110
  Chars:   enoN
  Time:    Tue Dec 05 00:31:10 2023
  Float:   low 7.03735e+022 high 0
  Double:  8.40769e-315

Note: we push ‘None’ but see ‘enoN’ in memory because of little endian byte ordering.

Most of the recent drivers use their own tags and it is common not to encounter ‘None’ at all:

kd> !poolused
   Sorting by  Tag

  Pool Used:
            NonPaged            Paged
 Tag    Allocs     Used    Allocs     Used
...
...
...
 None        0        0         1     8192 call to ExAllocatePool

Therefore the driver must be old and if we see most drivers dated 2006-2007 and some dated 1998-2001 the chances are that 2001 drivers were responsible for our memory leak:

b9840000 b9842980   newdriver     Sat Feb 10 00:33:41 2007 (45CD12E5)
b8cfa000 b8d39e00   olddriver     Tue Aug 21 12:18:35 2001 (3B82438B)
f79e5000 f79e6400   veryolddriver Wed Sep 23 13:09:52 1998 (3608E510)

However veryolddriver.sys doesn’t use ExAllocatePoolWithTag so olddriver.sys is under suspicion:

0: kd> !dh f79e5000
...
...
...
     A00 [      33] address [size] of Export Directory
     C00 [      3C] address [size] of Import Directory
     E00 [     3A4] address [size] of Resource Directory
       0 [       0] address [size] of Exception Directory
       0 [       0] address [size] of Security Directory
    1200 [      34] address [size] of Base Relocation Directory
     440 [      54] address [size] of Debug Directory
       0 [       0] address [size] of Description Directory
       0 [       0] address [size] of Special Directory
       0 [       0] address [size] of Thread Storage Directory
       0 [       0] address [size] of Load Configuration Directory
       0 [       0] address [size] of Bound Import Directory
     400 [      34] address [size] of Import Address Table Directory
       0 [       0] address [size] of Delay Import Directory
       0 [       0] address [size] of COR20 Header Directory
       0 [       0] address [size] of Reserved Directory


0: kd> dds f79e5000+400
f79e5400  80a82264 hal!HalTranslateBusAddress
f79e5404  80a84358 hal!READ_PORT_BUFFER_UCHAR
f79e5408  00000000
f79e540c  80840bd9 nt!IofCompleteRequest
f79e5410  808e8f01 nt!IoCreateSymbolicLink
f79e5414  80838035 nt!RtlInitUnicodeString
f79e5418  808fbe85 nt!IoDeleteSymbolicLink
f79e541c  80816a6e nt!MmUnmapIoSpace
f79e5420  808ef1f1 nt!IoCreateDevice
f79e5424  80837e3a nt!READ_REGISTER_BUFFER_UCHAR
f79e5428  80815fc8 nt!IoDeleteDevice
f79e542c  80816814 nt!MmMapIoSpace
f79e5430  00000000
f79e5434  00000000

To confirm that olddriver.sys uses ‘Ddk ‘ tag we can search its address space for code that calls ExAllocatePoolWithTag:

b8cfa000 b8d39e00 olddriver Tue Aug 21 12:18:35 2001 (3B82438B)

0: kd> !dh b8cfa000
...
...
...
       0 [       0] address [size] of Export Directory
   3D330 [      50] address [size] of Import Directory
   3DE00 [     380] address [size] of Resource Directory
       0 [       0] address [size] of Exception Directory
   3FE00 [      88] address [size] of Security Directory
   3E180 [    1BE8] address [size] of Base Relocation Directory
   3B640 [      1C] address [size] of Debug Directory
       0 [       0] address [size] of Description Directory
       0 [       0] address [size] of Special Directory
       0 [       0] address [size] of Thread Storage Directory
       0 [       0] address [size] of Load Configuration Directory
       0 [       0] address [size] of Bound Import Directory
   3B480 [     1B4] address [size] of Import Address Table Directory
       0 [       0] address [size] of Delay Import Directory
       0 [       0] address [size] of COR20 Header Directory
       0 [       0] address [size] of Reserved Directory


0: kd> dds b8cfa000+3B480 b8cfa000+3B480+1B4
b8d35480  80a83dba hal!KeQueryPerformanceCounter
b8d35484  80a7e3c0 hal!KfAcquireSpinLock
b8d35488  80a7e440 hal!KfReleaseSpinLock
b8d3548c  00000000
...
...
...
b8d35544  80812b1a nt!IoWriteErrorLogEntry
b8d35548  8081287b nt!IoAllocateErrorLogEntry
b8d3554c  8082f12f nt!swprintf
b8d35550  8089b93f nt!ExAllocatePoolWithTag
b8d35554  8087c465 nt!KeBugCheckEx
b8d35558  80815407 nt!wcsncat
b8d3555c  8083bc54 nt!ZwQueryValueKey
b8d35560  8083affb nt!ZwClose
b8d35564  80841a14 nt!_wcsicmp
b8d35568  80928d30 nt!ObReferenceObjectByHandle


… 

0: kd> s-d b8cfa000 b8d39e00 b8d35550
b8d19f08  b8d35550 555425ff 25ffb8d3 b8d35480  PU…%TU…%.T..
b8d1a068  b8d35550 ff85f88b 75fc7d89 b85e5f0c  PU…….}.u._^.
b8d2c4e4  b8d35550 0375c085 89c35d5e 04c08330  PU….u.^]..0…

0: kd> u b8d19f08-2
olddriver!ExAllocatePoolWithTag:
b8d19f06 jmp     dword ptr [olddriver!_imp__ExAllocatePoolWithTag (b8d35550)]

0: kd> u b8d2c4e4-2
olddriver!malloc+0x12
b8d2c4e2 call    dword ptr [olddriver!_imp__ExAllocatePoolWithTag (b8d35550)]
b8d2c4e8 test    eax,eax
b8d2c4ea jne     olddriver!malloc+0x1f (b8d2c4ef)
b8d2c4ec pop     esi
b8d2c4ed pop     ebp
b8d2c4ee ret
b8d2c4ef mov     dword ptr [eax],esi
b8d2c4f1 add     eax,4

0: kd> ub b8d1a068-2
olddriver!TraceRoutine+0xc1
b8d1a051 mov     esp,ebp
b8d1a053 pop     ebp
b8d1a054 ret
b8d1a055 cmp     edi,8
b8d1a058 jbe     olddriver!TraceRoutine+0x157 (b8d1a0e7)
b8d1a05e push    206b6444h
b8d1a063 push    edx
b8d1a064 push    0

0: kd> .formats 206b6444
Evaluate expression:
  Hex:     206b6444
  Decimal: 543908932
  Octal:   04032662104
  Binary:  00100000 01101011 01100100 01000100
  Chars:    kdD
  Time:    Sat Mar 28 05:48:52 1987
  Float:   low 1.99384e-019 high 0
  Double:  2.68727e-315

- Dmitry Vostokov @ DumpAnalysis.org -

Local crash dumps on Vista

October 18th, 2007

It appears that Microsoft decided to help customers to save full user dumps locally for later postmortem analysis. According to MSDN this is done via LocalDumps registry key starting from Vista SP1 and Windows Server 2008:

http://msdn2.microsoft.com/en-us/library/bb787181.aspx

This is a quote from the article above:

[…] Prior to application termination, the system will check the registry settings to determine whether a local dump is to be collected. The registry settings control whether a full dump is collected versus a minidump. The custom flags specified also determine which information is collected in the dump. […] You can make use of the local dump collection even if WER is disabled. The local dumps are collected even if the user cancels WER reporting at any point. […]

From my understanding it is independent from the default postmortem debugger mechanism via AeDebug registry key and might help to solve the problem with native services. I haven’t tried it yet but will do as soon as I install Vista SP1 or install Windows Server 2008 RC0. If it works then dump collection might be easier in production environments because of no need to install Debugging Tools for Windows to set up a postmortem debugger.

- Dmitry Vostokov @ DumpAnalysis.org -

Crash Dump Analysis Patterns (Part 31)

October 17th, 2007

When trying to understand why the particular application or service hangs we look at Stack Trace Collection and hope to find some suspicious threads that are waiting for a response. These are active blocked threads. Other threads may appear waiting but they are merely waiting for some notification or data which may or may not come during their lifetime and, therefore, are normal. In other words, they are passive and hence the name of the pattern Passive Thread. Typical examples from user space include

  • - the main service thread and dispatch threads (when idle)

  • - a thread waiting for file or registry notifications

  • - a generic RPC/LPC/COM thread waiting for messages

  • - worker threads waiting for a data to appear in a queue

  • - window message loops (when idle)

  • - socket and network protocol threads (when idle)

  • - a thread with function names on its stack trace suggesting that it is a notification or listener thread

Of course, sometimes these passive threads can be the reason for an application or service hang, but from my experience, most of the time they are not, unless there are other threads which they block. Let’s now look at example stack traces.

Note: Generic threads spawned to service various requests and waiting for data to arrive can be filtered using !uniqstack WinDbg command. Conceptually these threads are part of the so called thread pool software design pattern.

LPC/RPC/COM threads waiting for requests:

  70  Id: 8f8.1100 Suspend: 1 Teb: 7ff80000 Unfrozen
ChildEBP RetAddr
0d82fe18 7c82783b ntdll!KiFastSystemCallRet
0d82fe1c 77c885ac ntdll!NtReplyWaitReceivePortEx+0xc
0d82ff84 77c88792 rpcrt4!LRPC_ADDRESS::ReceiveLotsaCalls+0x198
0d82ff8c 77c8872d rpcrt4!RecvLotsaCallsWrapper+0xd
0d82ffac 77c7b110 rpcrt4!BaseCachedThreadRoutine+0x9d
0d82ffb8 77e64829 rpcrt4!ThreadStartRoutine+0x1b
0d82ffec 00000000 kernel32!BaseThreadStart+0x34

  71  Id: 8f8.1e44 Suspend: 1 Teb: 7ffde000 Unfrozen
ChildEBP RetAddr
0c01fe18 7c82783b ntdll!KiFastSystemCallRet
0c01fe1c 77c885ac ntdll!NtReplyWaitReceivePortEx+0xc
0c01ff84 77c88792 rpcrt4!LRPC_ADDRESS::ReceiveLotsaCalls+0x198
0c01ff8c 77c8872d rpcrt4!RecvLotsaCallsWrapper+0xd
0c01ffac 77c7b110 rpcrt4!BaseCachedThreadRoutine+0x9d
0c01ffb8 77e64829 rpcrt4!ThreadStartRoutine+0x1b
0c01ffec 00000000 kernel32!BaseThreadStart+0x34

  72  Id: 8f8.1804 Suspend: 1 Teb: 7ff90000 Unfrozen
ChildEBP RetAddr
0e22fe18 7c82783b ntdll!KiFastSystemCallRet
0e22fe1c 77c885ac ntdll!NtReplyWaitReceivePortEx+0xc
0e22ff84 77c88792 rpcrt4!LRPC_ADDRESS::ReceiveLotsaCalls+0x198
0e22ff8c 77c8872d rpcrt4!RecvLotsaCallsWrapper+0xd
0e22ffac 77c7b110 rpcrt4!BaseCachedThreadRoutine+0x9d
0e22ffb8 77e64829 rpcrt4!ThreadStartRoutine+0x1b
0e22ffec 00000000 kernel32!BaseThreadStart+0x34

  73  Id: 8f8.1860 Suspend: 1 Teb: 7ff79000 Unfrozen
ChildEBP RetAddr
0da2fe18 7c82783b ntdll!KiFastSystemCallRet
0da2fe1c 77c885ac ntdll!NtReplyWaitReceivePortEx+0xc
0da2ff84 77c88792 rpcrt4!LRPC_ADDRESS::ReceiveLotsaCalls+0x198
0da2ff8c 77c8872d rpcrt4!RecvLotsaCallsWrapper+0xd
0da2ffac 77c7b110 rpcrt4!BaseCachedThreadRoutine+0x9d
0da2ffb8 77e64829 rpcrt4!ThreadStartRoutine+0x1b
0da2ffec 00000000 kernel32!BaseThreadStart+0x34

  74  Id: 8f8.f24 Suspend: 1 Teb: 7ff7e000 Unfrozen
ChildEBP RetAddr
0d20feac 7c8277db ntdll!KiFastSystemCallRet
0d20feb0 77e5bea2 ntdll!ZwRemoveIoCompletion+0xc
0d20fedc 77c7b900 kernel32!GetQueuedCompletionStatus+0x29
0d20ff18 77c7b703 rpcrt4!COMMON_ProcessCalls+0xa1
0d20ff84 77c7b9b5 rpcrt4!LOADABLE_TRANSPORT::ProcessIOEvents+0x117
0d20ff8c 77c8872d rpcrt4!ProcessIOEventsWrapper+0xd
0d20ffac 77c7b110 rpcrt4!BaseCachedThreadRoutine+0x9d
0d20ffb8 77e64829 rpcrt4!ThreadStartRoutine+0x1b
0d20ffec 00000000 kernel32!BaseThreadStart+0x34

  75  Id: 8f8.11f8 Suspend: 1 Teb: 7ffa1000 Unfrozen
ChildEBP RetAddr
08e0feac 7c8277db ntdll!KiFastSystemCallRet
08e0feb0 77e5bea2 ntdll!ZwRemoveIoCompletion+0xc
08e0fedc 77c7b900 kernel32!GetQueuedCompletionStatus+0x29
08e0ff18 77c7b703 rpcrt4!COMMON_ProcessCalls+0xa1
08e0ff84 77c7b9b5 rpcrt4!LOADABLE_TRANSPORT::ProcessIOEvents+0x117
08e0ff8c 77c8872d rpcrt4!ProcessIOEventsWrapper+0xd
08e0ffac 77c7b110 rpcrt4!BaseCachedThreadRoutine+0x9d
08e0ffb8 77e64829 rpcrt4!ThreadStartRoutine+0x1b
08e0ffec 00000000 kernel32!BaseThreadStart+0x34

   2  Id: ecc.c94 Suspend: 1 Teb: 7efac000 Unfrozen
ChildEBP RetAddr
0382f760 76e31330 ntdll!NtDelayExecution+0x15
0382f7c8 76e30dac kernel32!SleepEx+0x62
0382f7d8 75ec40f4 kernel32!Sleep+0xf
0382f7e4 75eafc0d ole32!CROIDTable::WorkerThreadLoop+0x14
0382f800 75eafc73 ole32!CRpcThread::WorkerLoop+0x26
0382f80c 76ea19f1 ole32!CRpcThreadCache::RpcWorkerThreadEntry+0x20
0382f818 7797d109 kernel32!BaseThreadInitThunk+0xe
0382f858 00000000 ntdll!_RtlUserThreadStart+0x23

Worker threads waiting for data items to process:

  43  Id: 8f8.17c0 Suspend: 1 Teb: 7ff8c000 Unfrozen
ChildEBP RetAddr
0c64ff20 7c8277db ntdll!KiFastSystemCallRet
0c64ff24 77e5bea2 ntdll!ZwRemoveIoCompletion+0xc
0c64ff50 67823549 kernel32!GetQueuedCompletionStatus+0x29
0c64ff84 77bcb530 component!WorkItemThread+0×1a9
0c64ffb8 77e64829 msvcrt!_endthreadex+0xa3
0c64ffec 00000000 kernel32!BaseThreadStart+0×34

  44  Id: 8f8.7b4 Suspend: 1 Teb: 7ff8b000 Unfrozen
ChildEBP RetAddr
0c77ff20 7c8277db ntdll!KiFastSystemCallRet
0c77ff24 77e5bea2 ntdll!ZwRemoveIoCompletion+0xc
0c77ff50 67823549 kernel32!GetQueuedCompletionStatus+0x29
0c77ff84 77bcb530 component!WorkItemThread+0×1a9
0c77ffb8 77e64829 msvcrt!_endthreadex+0xa3
0c77ffec 00000000 kernel32!BaseThreadStart+0×34

  45  Id: 8f8.1708 Suspend: 1 Teb: 7ff8a000 Unfrozen
ChildEBP RetAddr
0c87ff20 7c8277db ntdll!KiFastSystemCallRet
0c87ff24 77e5bea2 ntdll!ZwRemoveIoCompletion+0xc
0c87ff50 67823549 kernel32!GetQueuedCompletionStatus+0x29
0c87ff84 77bcb530 component!WorkItemThread+0×1a9
0c87ffb8 77e64829 msvcrt!_endthreadex+0xa3
0c87ffec 00000000 kernel32!BaseThreadStart+0×34

   5 Id: 11fc.16f4 Suspend: 1 Teb: 7ffd9000 Unfrozen
ChildEBP RetAddr
0109bf10 7c822124 ntdll!KiFastSystemCallRet
0109bf14 77e6baa8 ntdll!NtWaitForSingleObject+0xc
0109bf84 77e6ba12 kernel32!WaitForSingleObjectEx+0xac
0109bf98 66886519 kernel32!WaitForSingleObject+0x12
0109ff84 77bcb530 component!WorkerThread+0xe8
0109ffb8 77e66063 msvcrt!_endthreadex+0xa3
0109ffec 00000000 kernel32!BaseThreadStart+0x34

A thread waiting for registry change notification: 

   1  Id: 13c4.350 Suspend: 1 Teb: 000007ff`fffde000 Unfrozen
Child-SP          RetAddr           Call Site
00000000`0012fdd8 000007fe`fd62c361 ntdll!ZwNotifyChangeKey+0xa
00000000`0012fde0 00000001`40001181 ADVAPI32!RegNotifyChangeKeyValue+0×115
00000000`0012ff30 00000000`76d9cdcd sample12!WaitForRegChange+0xe
00000000`0012ff60 00000000`76eec6e1 kernel32!BaseThreadInitThunk+0xd
00000000`0012ff90 00000000`00000000 ntdll!RtlUserThreadStart+0×1d

Idle main service thread and service dispatch threads:

.  0  Id: 65c.660 Suspend: 1 Teb: 000007ff`fffdc000 Unfrozen
Child-SP          RetAddr           Call Site
00000000`0011f2c8 00000000`76d926da ntdll!NtReadFile+0xa
00000000`0011f2d0 000007fe`fd6665aa kernel32!ReadFile+0x8a
00000000`0011f360 000007fe`fd6662e3 ADVAPI32!ScGetPipeInput+0x4a
00000000`0011f440 000007fe`fd6650f3 ADVAPI32!ScDispatcherLoop+0x9a
00000000`0011f540 00000000`ff0423a3 ADVAPI32!StartServiceCtrlDispatcherW+0x176
00000000`0011f7e0 00000000`ff042e66 spoolsv!main+0x23
00000000`0011f850 00000000`76eec6e1 kernel32!BaseThreadInitThunk+0xd
00000000`0011f880 00000000`00000000 ntdll!RtlUserThreadStart+0x1d

   1  Id: 65c.664 Suspend: 1 Teb: 000007ff`fffda000 Unfrozen
Child-SP          RetAddr           Call Site
00000000`0009f9c8 00000000`76d9d820 ntdll!NtWaitForSingleObject+0xa
00000000`0009f9d0 00000000`ff04307f kernel32!WaitForSingleObjectEx+0x9c
00000000`0009fa90 000007fe`fd664bf5 spoolsv!SPOOLER_main+0x80
00000000`0009fac0 00000000`76d9cdcd ADVAPI32!ScSvcctrlThreadW+0x25
00000000`0009faf0 00000000`76eec6e1 kernel32!BaseThreadInitThunk+0xd
00000000`0009fb20 00000000`00000000 ntdll!RtlUserThreadStart+0x1d

Idle window message loops:

  10  Id: 65c.514 Suspend: 1 Teb: 000007ff`fffa2000 Unfrozen
Child-SP          RetAddr           Call Site
00000000`02c5fc18 00000000`76cae6ea USER32!ZwUserGetMessage+0xa
00000000`02c5fc20 000007fe`f88523f0 USER32!GetMessageW+0×34
00000000`02c5fc50 00000000`76d9cdcd usbmon!CPNPNotifications::WindowMessageThread+0×1a0
00000000`02c5fd20 00000000`76eec6e1 kernel32!BaseThreadInitThunk+0xd
00000000`02c5fd50 00000000`00000000 ntdll!RtlUserThreadStart+0×1d

  11  Id: 65c.9bc Suspend: 1 Teb: 000007ff`fffa0000 Unfrozen
Child-SP          RetAddr           Call Site
00000000`037cf798 00000000`76cae6ea USER32!ZwUserGetMessage+0xa
00000000`037cf7a0 000007fe`f7ea0d3a USER32!GetMessageW+0×34
00000000`037cf7d0 00000000`76d9cdcd WSDMon!Ncd::TPower::WindowMessageThread+0xe6
00000000`037cf870 00000000`76eec6e1 kernel32!BaseThreadInitThunk+0xd
00000000`037cf8a0 00000000`00000000 ntdll!RtlUserThreadStart+0×1d

  13  Id: ecc.b34 Suspend: 1 Teb: 7ef85000 Unfrozen
ChildEBP RetAddr
0621fc18 75b86458 USER32!NtUserGetMessage+0x15
0621fc3c 74aa1404 USER32!GetMessageA+0xa2
0621fc74 76ea19f1 WINMM!mciwindow+0×102
0621fc80 7797d109 kernel32!BaseThreadInitThunk+0xe
0621fcc0 00000000 ntdll!_RtlUserThreadStart+0×23

Idle socket and network protocol threads:

   5  Id: ecc.920 Suspend: 1 Teb: 7efa3000 Unfrozen
ChildEBP RetAddr
0412f534 751b3b28 ntdll!ZwWaitForSingleObject+0x15
0412f574 751b2690 mswsock!SockWaitForSingleObject+0x19f
0412f660 771d3781 mswsock!WSPSelect+0x38c
0412f6dc 760f60fd ws2_32!select+0x456
0412fa34 760f2a78 WININET!ICAsyncThread::SelectThread+0x242
0412fa3c 76ea19f1 WININET!ICAsyncThread::SelectThreadWrapper+0xd
0412fa48 7797d109 kernel32!BaseThreadInitThunk+0xe
0412fa88 00000000 ntdll!_RtlUserThreadStart+0x23

   6  Id: ecc.b1c Suspend: 1 Teb: 7ef9d000 Unfrozen
ChildEBP RetAddr
047afa6c 751b1b25 ntdll!NtRemoveIoCompletion+0x15
047afaa4 76ea19f1 mswsock!SockAsyncThread+0x69
047afab0 7797d109 kernel32!BaseThreadInitThunk+0xe
047afaf0 00000000 ntdll!_RtlUserThreadStart+0x23

   7 Id: 820.f90 Suspend: 1 Teb: 7ffd9000 Unfrozen
ChildEBP RetAddr
018dff84 7c93e9ab ntdll!KiFastSystemCallRet (FPO: [0,0,0])
018dff88 60620e6c ntdll!ZwWaitForMultipleObjects+0xc
018dffb4 7c80b683 NETAPI32!NetbiosWaiter+0x73
018dffec 00000000 kernel32!BaseThreadStart+0x37

Function names showing passive nature of threads: 

   8  Id: 65c.b40 Suspend: 1 Teb: 000007ff`fffa6000 Unfrozen
Child-SP          RetAddr           Call Site
00000000`0259fdc8 00000000`76d9d820 ntdll!NtWaitForSingleObject+0xa
00000000`0259fdd0 000007fe`f8258084 kernel32!WaitForSingleObjectEx+0x9c
00000000`0259fe90 000007fe`fee994e7 wsnmp32!thrNotify+0×9c
00000000`0259fef0 000007fe`fee9967d msvcrt!endthreadex+0×47
00000000`0259ff20 00000000`76d9cdcd msvcrt!endthreadex+0×100
00000000`0259ff50 00000000`76eec6e1 kernel32!BaseThreadInitThunk+0xd
00000000`0259ff80 00000000`00000000 ntdll!RtlUserThreadStart+0×1d

  12  Id: 65c.908 Suspend: 1 Teb: 000007ff`fff9e000 Unfrozen
Child-SP          RetAddr           Call Site
00000000`0368fd48 00000000`76d9d820 ntdll!NtWaitForSingleObject+0xa
00000000`0368fd50 000007fe`fa49afd0 kernel32!WaitForSingleObjectEx+0x9c
00000000`0368fe10 00000000`76d9cdcd FunDisc!CNotificationQueue::ThreadProc+0×2ec
00000000`0368fe70 00000000`76eec6e1 kernel32!BaseThreadInitThunk+0xd
00000000`0368fea0 00000000`00000000 ntdll!RtlUserThreadStart+0×1d

  13  Id: 65c.904 Suspend: 1 Teb: 000007ff`fff9c000 Unfrozen
Child-SP          RetAddr           Call Site
00000000`034af9f8 00000000`76d9ed73 ntdll!NtWaitForMultipleObjects+0xa
00000000`034afa00 00000000`76cae96d kernel32!WaitForMultipleObjectsEx+0x10b
00000000`034afb10 00000000`76cae85e USER32!RealMsgWaitForMultipleObjectsEx+0x129
00000000`034afbb0 00000000`76ca3680 USER32!MsgWaitForMultipleObjectsEx+0x46
00000000`034afbf0 000007fe`fa49b60a USER32!MsgWaitForMultipleObjects+0x20
00000000`034afc30 00000000`76d9cdcd FunDisc!ListenerThread+0×1a6
00000000`034afd20 00000000`76eec6e1 kernel32!BaseThreadInitThunk+0xd
00000000`034afd50 00000000`00000000 ntdll!RtlUserThreadStart+0×1d

  64  Id: 8f8.1050 Suspend: 1 Teb: 7ff74000 Unfrozen
ChildEBP RetAddr
0ef5fa48 7c82787b ntdll!KiFastSystemCallRet
0ef5fa4c 77c80a6e ntdll!NtRequestWaitReplyPort+0xc
0ef5fa98 77c7fcf0 rpcrt4!LRPC_CCALL::SendReceive+0x230
0ef5faa4 77c80673 rpcrt4!I_RpcSendReceive+0x24
0ef5fab8 77ce315a rpcrt4!NdrSendReceive+0x2b
0ef5fea0 771f4fbd rpcrt4!NdrClientCall2+0x22e
0ef5feb8 771f4f60 winsta!RpcWinStationWaitSystemEvent+0x1c
0ef5ff00 76f01422 winsta!WinStationWaitSystemEvent+0x51
0ef5ff24 0c922ace wtsapi32!WTSWaitSystemEvent+0×97
0ef5ff48 67823331 component!MonitorEvents+0xaf
0ef5ffb8 77e64829 msvcrt!_endthreadex+0xa3
0ef5ffec 00000000 kernel32!BaseThreadStart+0×34

   11 Id: 140c.e8c Suspend: 1 Teb: 7ffaf000 Unfrozen
ChildEBP RetAddr
01e3fec0 7c822114 ntdll!KiFastSystemCallRet
01e3fec4 77e6711b ntdll!NtWaitForMultipleObjects+0xc
01e3ff6c 77e61075 kernel32!WaitForMultipleObjectsEx+0x11a
01e3ff88 76928415 kernel32!WaitForMultipleObjects+0x18
01e3ffb8 77e66063 userenv!!NotificationThread+0×5f
01e3ffec 00000000 kernel32!BaseThreadStart+0×34

When in doubt it is always a good idea to examine threads in non-hanging processes to see their normal idle stack traces.

I’ll discuss passive threads from kernel space in the next part.

- Dmitry Vostokov @ DumpAnalysis.org -

Crash Dumps for Dummies (Part 6)

October 16th, 2007

Bugtation No. 73:
Crash “must be distinguished from” hang “with which it is often confounded.”
Sydney Smith

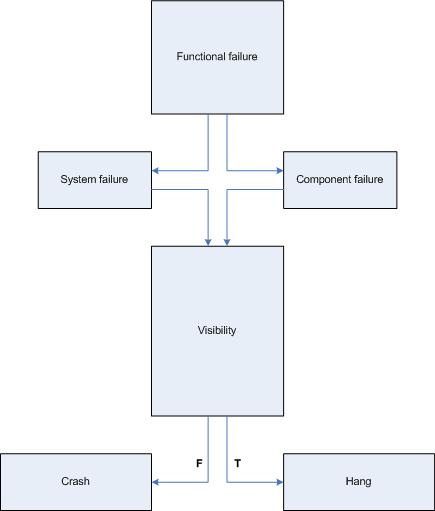
In part 4 I highlighted the difference between crashes and hangs. In this part I will elaborate on this terminology a bit further. First of all, we have to unify them as manifestations of a functional failure. Considering computer as a system of components having certain functions we shall subdivide failures into system and component failures. Of course, systems may be components in some larger hierarchy, like in the case of virtualization. Application and service process failures fall under component failures category. Blue screen and server freezes fall under system failures category. Now it is obvious why most computer users confuse crashes and hangs. They are just failures and often the distinction between them is blurred from user perspective.

Software developers tend to make sharp distinction between crash and hang terms because they consider a situation when a computer accesses wrong memory or gets and executes an invalid instruction as a crash. However, after such situation a computer system may or may not terminate that application or service. 

Therefore, I propose to consider crashes as situations when a system or a component is not observed anymore. For example, a running application or service disappears from Task Manager, computer system shows blue screen or reboots. In hang situations we can observe that existence of a failed component in Task Manager or a computer system doesn’t reboot automatically and shows some screen image different from BSOD or panic message. The so called sluggish behavior or long response time can also be considered as hang situations.

Here is a simple rough diagram I devised to illuminate the proposed terminological difference:

Based on the clarification above the task of collecting memory or crash dumps is much simpler and clearer.

In the case of a system crash or hang we need to setup correct crash dump options in Advanced System Settings in Control Panel and check page file size in case of the complete memory dump option. A system crash will save the dump automatically. For system hangs we need to actively trigger crash dump saving procedure using either standard keyboard method, SystemDump tool or live system debugging.   

In the case of an application crash we need to set up a postmortem debugger, get WER report or attach a debugger to a component and wait for a failure to happen. In the case of a hang we save a memory dump manually either by using process dumpers like userdump.exe or attaching a debugger.

Links to some dump collection techniques can be found in the previously published part 3 (crashes explained) and part 4 (hangs explained). Forthcoming Windows® Crash Dump Analysis book will discuss all memory dump collection methods thoroughly and in detail.

- Dmitry Vostokov @ DumpAnalysis.org -

TOC for Windows® Crash Dump Analysis

October 15th, 2007

Following up the announcement of the forthcoming book I’ve published a preliminary Table of Contents which can be found here:

http://www.dumpanalysis.org/index.php?q=TOC+for+Windows+Crash+Dump+Analysis+Book

In November I’m going to publish a sample chapter and by that time try to finalize TOC.

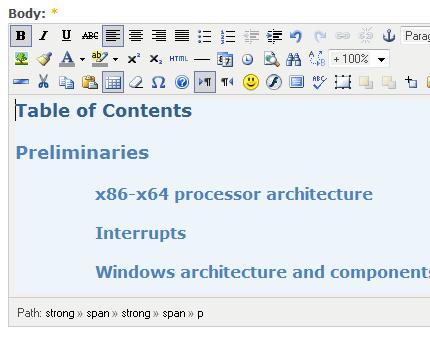
As a part of my preparatory work I also installed TinyMCE module for my Drupal installation and can now enjoy writing anytime and anywhere:

At the same time I’m trying to improve my writing by reading these two books:

Spring Into Technical Writing for Engineers and Scientists (Spring Into… Series)

Buy from Amazon

BUGS in Writing, Revised Edition: A Guide to Debugging Your Prose (2nd Edition)

Buy from Amazon

- Dmitry Vostokov @ DumpAnalysis.org -

Crash Dump Analysis Patterns (Part 30)

October 15th, 2007

When a system is unresponsive or sluggish we usually check _ERESOURCE locks in kernel or complete memory dumps to see deadlock or high resource contention. However there is some chance that reported locks are purely accidental and appear in a crash dump because they just happened at that time. We need to look at Contention Count, Ticks and KernelTime in both blocking and blocked threads to recognize an Accidental Lock. Also the current version of WinDbg doesn’t distinguish between prolonged and accidental locks when we use !analyze -v -hang command and merely reports some lock chain it finds among equal alternatives.

Here is an example. The system was reported hang and kernel memory dump was saved. WinDbg analysis command reports one thread blocking 3 other threads and the driver on top of the blocking thread stack is AVDriver.sys. The algorithm WinDbg uses to point to specific image name is described here and in our case it chooses AVDriver:  

BLOCKED_THREAD:  8089d8c0

BLOCKING_THREAD:  8aab4700

LOCK_ADDRESS:  8859a570 -- (!locks 8859a570)

Resource @ 0x8859a570    Exclusively owned
    Contention Count = 3
    NumberOfExclusiveWaiters = 3
     Threads: 8aab4700-01<*>
     Threads Waiting On Exclusive Access:
              885d0020       88a7c020       8aafc7d8

1 total locks, 1 locks currently held

BUGCHECK_STR:  LOCK_HELD

FAULTING_THREAD:  8aab4700

STACK_TEXT:
f592f698 80832f7a nt!KiSwapContext+0x26
f592f6c4 80828705 nt!KiSwapThread+0x284
f592f70c f720a394 nt!KeDelayExecutionThread+0x2ab
WARNING: Stack unwind information not available. Following frames may be wrong.
f592f734 f720ae35 AVDriver+0×1394
f592f750 f720b208 AVDriver+0×1e35
f592f794 f721945a AVDriver+0×2208
f592f7cc 8081dcdf AVDriver+0×1045a
f592f7e0 f5b9f76a nt!IofCallDriver+0×45
f592f7f0 f5b9c621 Driver!FS_Dispatch+0xa4
f592f7fc 8081dcdf Driver!Kernel_dispatch+0×53
f592f810 f5eb2856 nt!IofCallDriver+0×45
f592f874 8081dcdf AVFilter!QueryFullName+0×5c10
f592f888 f5e9eae3 nt!IofCallDriver+0×45
f592f8b8 f5e9eca4 DrvFilter!PassThrough+0×115
f592f8d4 8081dcdf DrvFilter!Create+0xda
f592f8e8 808f8275 nt!IofCallDriver+0×45
f592f9d0 808f86bc nt!IopParseDevice+0xa35
f592fa08 80936689 nt!IopParseFile+0×46
f592fa88 80932e04 nt!ObpLookupObjectName+0×11f
f592fadc 808ea231 nt!ObOpenObjectByName+0xea
f592fb58 808eb4cb nt!IopCreateFile+0×447
f592fbb4 f57c8efd nt!IoCreateFile+0xa3
f592fc24 f57c9f29 srv!SrvIoCreateFile+0×36d
f592fcf0 f57ca5e4 srv!SrvNtCreateFile+0×5cc
f592fd78 f57adbc6 srv!SrvSmbNtCreateAndX+0×15c
f592fd84 f57c3451 srv!SrvProcessSmb+0xb7
f592fdac 80948bd0 srv!WorkerThread+0×138
f592fddc 8088d4e2 nt!PspSystemThreadStartup+0×2e
00000000 00000000 nt!KiThreadStartup+0×16

STACK_COMMAND:  .thread 0xffffffff8aab4700 ; kb

FOLLOWUP_IP:
AVDriver+1394
f720a394 eb85            jmp     AVDriver+0x131b (f720a31b)

MODULE_NAME: AVDriver

IMAGE_NAME:  AVDriver.sys

Motivated by this “discovery” we want to see all locks:

0: kd> !locks
**** DUMP OF ALL RESOURCE OBJECTS ****
KD: Scanning for held locks...

Resource @ 0x895a62d8    Shared 1 owning threads
     Threads: 89570520-01<*>

Resource @ 0x897ceba8    Shared 1 owning threads
     Threads: 89584020-01<*>

Resource @ 0x8958e020    Shared 1 owning threads
     Threads: 89555020-01<*>

Resource @ 0x89590608    Shared 1 owning threads
     Threads: 89666020-01<*>

Resource @ 0x89efc398    Shared 1 owning threads
     Threads: 89e277c0-01<*>

Resource @ 0x88d70820    Shared 1 owning threads
     Threads: 88e43948-01<*>

Resource @ 0x89f2fb00    Shared 1 owning threads
     Threads: 89674688-01<*>

Resource @ 0x89c80370    Shared 1 owning threads
     Threads: 888496b8-01<*>

Resource @ 0x89bfdf08    Shared 1 owning threads
     Threads: 88b62910-01<*>

Resource @ 0x888b5488    Shared 1 owning threads
     Threads: 88536730-01<*>

Resource @ 0x89f2e348    Shared 1 owning threads
     Threads: 89295930-01<*>

Resource @ 0x891a0838    Shared 1 owning threads
     Threads: 88949020-01<*>

Resource @ 0x8825bf08    Shared 1 owning threads
     Threads: 882b9a08-01<*>

Resource @ 0x881a6510    Shared 1 owning threads
     Threads: 88a88338-01<*>

Resource @ 0x885c5890    Shared 1 owning threads
     Threads: 881ab020-01<*>

Resource @ 0x886633a8    Shared 1 owning threads
     Threads: 89b5f8b0-01<*>

Resource @ 0x88216390    Shared 1 owning threads
     Threads: 88820020-01<*>

Resource @ 0x88524490    Shared 1 owning threads
     Threads: 88073020-01<*>

Resource @ 0x88f6a020    Shared 1 owning threads
     Threads: 88e547b0-01<*>

Resource @ 0x88cf2020    Shared 1 owning threads
     Threads: 89af32d8-01<*>

Resource @ 0x889cea80    Shared 1 owning threads
     Threads: 88d18b40-01<*>

Resource @ 0x88486298    Shared 1 owning threads
     Threads: 88af7db0-01<*>

Resource @ 0x88b22270    Exclusively owned
    Contention Count = 4
    NumberOfExclusiveWaiters = 4
     Threads: 8aad07d8-01<*>
     Threads Waiting On Exclusive Access:
              8ad78020       887abdb0       88eb39a8       8aa1f668

Resource @ 0x88748c20    Exclusively owned
    Contention Count = 2
    NumberOfExclusiveWaiters = 2
     Threads: 8873c8d8-01<*>
     Threads Waiting On Exclusive Access:
              88477478       88db6020

Resource @ 0x8859a570    Exclusively owned
    Contention Count = 3
    NumberOfExclusiveWaiters = 3
     Threads: 8aab4700-01<*>
     Threads Waiting On Exclusive Access:
              885d0020       88a7c020       8aafc7d8

KD: Scanning for held locks...
18911 total locks, 25 locks currently held

We can ignore shared locks and concentrate on the last 3 exclusively owned resources. It looks suspicious that Contention Count has the same number as the number of threads waiting on exclusive access (NumberOfExclusiveWaiters). This means that these resources had never been used before. If we dump locks verbosely we would see that blocked threads had been waiting no more than 2 seconds, for example, for resource 0×8859a570:

0: kd> !thread 885d0020; !thread 88a7c020; !thread 8aafc7d8
THREAD 885d0020  Cid 0004.1c34  Teb: 00000000 Win32Thread: 00000000 WAIT: (Unknown) KernelMode Non-Alertable
    89908d50  SynchronizationEvent
    885d0098  NotificationTimer
Not impersonating
DeviceMap                 e10022c8
Owning Process            8ad80648 Image:         System
Wait Start TickCount      7689055  Ticks: 127 (0:00:00:01.984)
Context Switch Count      248
UserTime                  00:00:00.000
KernelTime                00:00:00.000
Start Address srv!WorkerThread (0xf57c3394)
Stack Init b4136000 Current b4135b74 Base b4136000 Limit b4133000 Call 0
Priority 9 BasePriority 9 PriorityDecrement 0
ChildEBP RetAddr
b4135b8c 80832f7a nt!KiSwapContext+0×26
b4135bb8 8082925c nt!KiSwapThread+0×284
b4135c00 8087c1ad nt!KeWaitForSingleObject+0×346
b4135c3c 8087c3a1 nt!ExpWaitForResource+0xd5
b4135c5c f57c9e95 nt!ExAcquireResourceExclusiveLite+0×8d
b4135cf0 f57ca5e4 srv!SrvNtCreateFile+0×510
b4135d78 f57adbc6 srv!SrvSmbNtCreateAndX+0×15c
b4135d84 f57c3451 srv!SrvProcessSmb+0xb7
b4135dac 80948bd0 srv!WorkerThread+0×138
b4135ddc 8088d4e2 nt!PspSystemThreadStartup+0×2e
00000000 00000000 nt!KiThreadStartup+0×16

THREAD 88a7c020  Cid 0004.3448  Teb: 00000000 Win32Thread: 00000000 WAIT: (Unknown) KernelMode Non-Alertable
    89908d50  SynchronizationEvent
    88a7c098  NotificationTimer
Not impersonating
DeviceMap                 e10022c8
Owning Process            8ad80648  Image:         System
Wait Start TickCount      7689112   Ticks: 70 (0:00:00:01.093)
Context Switch Count      210
UserTime                  00:00:00.000
KernelTime                00:00:00.000
Start Address srv!WorkerThread (0xf57c3394)
Stack Init b55dd000 Current b55dcb74 Base b55dd000 Limit b55da000 Call 0
Priority 9 BasePriority 9 PriorityDecrement 0
ChildEBP RetAddr
b55dcb8c 80832f7a nt!KiSwapContext+0×26
b55dcbb8 8082925c nt!KiSwapThread+0×284
b55dcc00 8087c1ad nt!KeWaitForSingleObject+0×346
b55dcc3c 8087c3a1 nt!ExpWaitForResource+0xd5
b55dcc5c f57c9e95 nt!ExAcquireResourceExclusiveLite+0×8d
b55dccf0 f57ca5e4 srv!SrvNtCreateFile+0×510
b55dcd78 f57adbc6 srv!SrvSmbNtCreateAndX+0×15c
b55dcd84 f57c3451 srv!SrvProcessSmb+0xb7
b55dcdac 80948bd0 srv!WorkerThread+0×138
b55dcddc 8088d4e2 nt!PspSystemThreadStartup+0×2e
00000000 00000000 nt!KiThreadStartup+0×16

THREAD 8aafc7d8  Cid 0004.058c  Teb: 00000000 Win32Thread: 00000000 WAIT: (Unknown) KernelMode Non-Alertable
    89908d50  SynchronizationEvent
    8aafc850  NotificationTimer
Not impersonating
DeviceMap                 e10022c8
Owning Process            8ad80648  Image:         System
Wait Start TickCount      7689171   Ticks: 11 (0:00:00:00.171)
Context Switch Count      310
UserTime                  00:00:00.000
KernelTime                00:00:00.000
Start Address srv!WorkerThread (0xf57c3394)
Stack Init f592c000 Current f592bb18 Base f592c000 Limit f5929000 Call 0
Priority 9 BasePriority 9 PriorityDecrement 0
ChildEBP RetAddr
f592bb30 80832f7a nt!KiSwapContext+0×26
f592bb5c 8082925c nt!KiSwapThread+0×284
f592bba4 8087c1ad nt!KeWaitForSingleObject+0×346
f592bbe0 8087c3a1 nt!ExpWaitForResource+0xd5
f592bc00 f57c8267 nt!ExAcquireResourceExclusiveLite+0×8d
f592bc18 f57ff0ed srv!UnlinkRfcbFromLfcb+0×33
f592bc34 f57ff2ea srv!SrvCompleteRfcbClose+0×1df
f592bc54 f57b5e8f srv!CloseRfcbInternal+0xb6
f592bc78 f57ce8a9 srv!SrvCloseRfcbsOnSessionOrPid+0×74
f592bc94 f57e2b22 srv!SrvCloseSession+0xb0
f592bcb8 f57aeb12 srv!SrvCloseSessionsOnConnection+0xa9
f592bcd4 f57c79ed srv!SrvCloseConnection+0×143
f592bd04 f5808c50 srv!SrvCloseConnectionsFromClient+0×17f
f592bdac 80948bd0 srv!WorkerThread+0×138
f592bddc 8088d4e2 nt!PspSystemThreadStartup+0×2e
00000000 00000000 nt!KiThreadStartup+0×16

Blocking threads themselves are not blocked and active: the number of ticks passed since their last wait or preemption is 0. This could be a sign of CPU spike pattern. However their accumulated KernelTime is less than a second:

0: kd> !thread 8aad07d8
THREAD 8aad07d8  Cid 0004.0580  Teb: 00000000 Win32Thread: 00000000 WAIT: (Unknown) KernelMode Non-Alertable
    8aad0850  NotificationTimer
IRP List:
    8927ade0: (0006,0220) Flags: 00000884  Mdl: 00000000
Impersonation token:  eafdc030 (Level Impersonation)
DeviceMap                 e5d69340
Owning Process            8ad80648       Image:         System
Wait Start TickCount      7689182        Ticks: 0
Context Switch Count      915582
UserTime                  00:00:00.000
KernelTime                00:00:00.125
Start Address srv!WorkerThread (0xf57c3394)
Stack Init f59d8000 Current f59d7680 Base f59d8000 Limit f59d5000 Call 0
Priority 9 BasePriority 9 PriorityDecrement 0

0: kd> !thread 8873c8d8
THREAD 8873c8d8  Cid 0004.2898  Teb: 00000000 Win32Thread: 00000000 WAIT: (Unknown) KernelMode Non-Alertable
    8873c950  NotificationTimer
IRP List:
    882a8de0: (0006,0220) Flags: 00000884  Mdl: 00000000
Impersonation token:  eafdc030 (Level Impersonation)
DeviceMap                 e5d69340
Owning Process            8ad80648       Image:         System
Wait Start TickCount      7689182        Ticks: 0
Context Switch Count      917832
UserTime                  00:00:00.000
KernelTime                00:00:00.031
Start Address srv!WorkerThread (0xf57c3394)
Stack Init ac320000 Current ac31f680 Base ac320000 Limit ac31d000 Call 0
Priority 9 BasePriority 9 PriorityDecrement 0

0: kd> !thread 8aab4700
THREAD 8aab4700  Cid 0004.0588  Teb: 00000000 Win32Thread: 00000000 WAIT: (Unknown) KernelMode Non-Alertable
    8aab4778  NotificationTimer
IRP List:
    88453008: (0006,0220) Flags: 00000884  Mdl: 00000000
Impersonation token:  e9a82728 (Level Impersonation)
DeviceMap                 eb45f108
Owning Process            8ad80648       Image:         System
Wait Start TickCount      7689182        Ticks: 0
Context Switch Count      1028220
UserTime                  00:00:00.000
KernelTime                00:00:00.765
Start Address srv!WorkerThread (0xf57c3394)
Stack Init f5930000 Current f592f680 Base f5930000 Limit f592d000 Call 0
Priority 9 BasePriority 9 PriorityDecrement 0

Based on this observation we could say that locks were accidental and indeed, when the problem happened again, the new dump didn’t show them.

- Dmitry Vostokov @ DumpAnalysis.org -

Minidump Analysis (Part 4)

October 11th, 2007

In part 3 we explored raw stack dumps. Now suppose we have a minidump with a stack trace that involves our product driver and due to some reason WinDbg doesn’t pick symbols automatically and shows the following stack trace and crash address that point to driver.sys module:

1: kd> kL
ChildEBP RetAddr
WARNING: Stack unwind information not available. Following frames may be wrong.
ba0fd0e4 bfabd64b driver+0×2df2a
ba0fd1c8 bf8b495d driver+0×1f64b
ba0fd27c bf9166ae win32k!NtGdiBitBlt+0×52d
ba0fd2d8 bf9168d0 win32k!TileWallpaper+0xd4
ba0fd2f8 bf826c83 win32k!xxxDrawWallpaper+0×50
ba0fd324 bf8651df win32k!xxxDesktopPaintCallback+0×48
ba0fd388 bf8280f3 win32k!xxxEnumDisplayMonitors+0×13a
ba0fd3d4 bf8283ab win32k!xxxInternalPaintDesktop+0×66
ba0fd3f8 80833bdf win32k!NtUserPaintDesktop+0×41
ba0fd3f8 7c9485ec nt!KiFastCallEntry+0xfc

1: kd> r
eax=000007d0 ebx=000007d0 ecx=00000086 edx=bfb371a3 esi=bc492000 edi=bfb3775b
eip=bfacbf2a esp=ba0fd0b8 ebp=ba0fd0e4 iopl=0 nv up ei pl nz na po nc
cs=0008 ss=0010 ds=0023 es=0023 fs=0030 gs=0000 efl=00010202
driver+0×2df2a:
bfacbf2a f3a5 rep movs dword ptr es:[edi],dword ptr [esi] es:0023:bfb3775b=e4405a64 ds:0023:bc492000=????????

We can get timestamp of this module too: 

1: kd> lmv m driver
start    end        module name
bfa9e000 bfb42a00   driver   T (no symbols)
    Loaded symbol image file: driver.sys
    Image path: driver.sys
    Image name: driver.sys
    Timestamp:        Thu Mar 01 20:50:04 2007 (45E73C7C)
    CheckSum:         000A5062
    ImageSize:        000A4A00
    Translations:     0000.04b0 0000.04e0 0409.04b0 0409.04e0

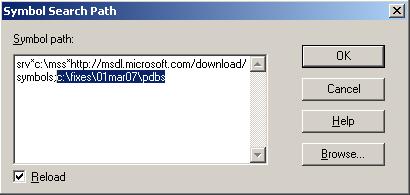
We see that no symbols for driver.sys were found and this is also indicated by the absence of function names and huge code offsets like 0×2df2a. Perhaps we don’t have a symbol server and store our symbol files somewhere. Or we got symbols from the developer of the recent fix that bugchecks and we want to apply them. In any case if we add a path to Symbol Search Path dialog (File -> Symbol File Path …) or use .sympath WinDbg command

we are able to get better stack trace and crash point:

1: kd> .reload
Loading Kernel Symbols
...
Loading User Symbols
Loading unloaded module list
...
Unable to load image driver.sys, Win32 error 0n2
*** WARNING: Unable to verify timestamp for driver.sys

1: kd> kL
ChildEBP RetAddr
ba0fd0c0 bfabc399 driver!ProcessBytes+0×18
ba0fd0e4 bfabd64b driver!ProcessObject+0xc9
ba0fd1c8 bf8b495d driver!CacheBitBlt+0×13d
ba0fd27c bf9166ae win32k!NtGdiBitBlt+0×52d
ba0fd2d8 bf9168d0 win32k!TileWallpaper+0xd4
ba0fd2f8 bf826c83 win32k!xxxDrawWallpaper+0×50
ba0fd324 bf8651df win32k!xxxDesktopPaintCallback+0×48
ba0fd388 bf8280f3 win32k!xxxEnumDisplayMonitors+0×13a
ba0fd3d4 bf8283ab win32k!xxxInternalPaintDesktop+0×66
ba0fd3f8 80833bdf win32k!NtUserPaintDesktop+0×41
ba0fd3f8 7c9485ec nt!KiFastCallEntry+0xfc

1: kd> r
eax=000007d0 ebx=000007d0 ecx=00000086 edx=bfb371a3 esi=bc492000 edi=bfb3775b
eip=bfacbf2a esp=ba0fd0b8 ebp=ba0fd0e4 iopl=0 nv up ei pl nz na po nc
cs=0008 ss=0010 ds=0023 es=0023 fs=0030 gs=0000 efl=00010202
driver!ProcessBytes+0×18:
bfacbf2a f3a5 rep movs dword ptr es:[edi],dword ptr [esi] es:0023:bfb3775b=e4405a64 ds:0023:bc492000=????????

Because WinDbg reports that it was unable to verify timestamp for driver.sys we might want to double check the return address saved when ProcessBytes function was called. If symbols are correct then disassembling the return address backwards will most likely show ProcessObject function code and “call” instruction with ProcessBytes address. Unfortunately minidumps don’t have code except for the currently executing function:

1: kd> ub bfabc399
                 ^ Unable to find valid previous instruction for 'ub bfabc399'

1: kd> uf driver!ProcessObject
No code found, aborting

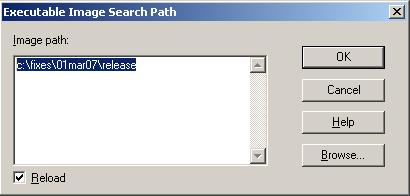
Therefore we need to point WinDbg to our driver.sys which contains executable code. This can be done by specifying a path in Executable Image Search Path dialog (File -> Image File Path …) or using .exepath WinDbg command.

Now we get more complete stack trace and we are able to double check the return address:

1: kd> .reload
Loading Kernel Symbols
...
Loading User Symbols
Loading unloaded module list
...

1: kd> kL
ChildEBP RetAddr
ba0fd0c0 bfabc399 driver!ProcessBytes+0×18
ba0fd0e4 bfabd64b driver!ProcessObject+0xc9
ba0fd104 bfac5aac driver!CacheBitBlt+0×13d
ba0fd114 bfac6840 driver!ProcessCommand+0×150
ba0fd140 bfac1878 driver!CheckSurface+0×258
ba0fd178 bfaba0ee driver!CopyBitsEx+0xfa
ba0fd1c8 bf8b495d driver!DrvCopyBits+0xb6
ba0fd27c bf9166ae win32k!NtGdiBitBlt+0×52d
ba0fd2d8 bf9168d0 win32k!TileWallpaper+0xd4
ba0fd2f8 bf826c83 win32k!xxxDrawWallpaper+0×50
ba0fd324 bf8651df win32k!xxxDesktopPaintCallback+0×48
ba0fd388 bf8280f3 win32k!xxxEnumDisplayMonitors+0×13a
ba0fd3d4 bf8283ab win32k!xxxInternalPaintDesktop+0×66
ba0fd3f8 80833bdf win32k!NtUserPaintDesktop+0×41
ba0fd3f8 7c9485ec nt!KiFastCallEntry+0xfc

1: kd> ub bfabc399
driver!ProcessObject+0xb7:
bfabc387 57              push    edi
bfabc388 40              inc     eax
bfabc389 50              push    eax
bfabc38a e861fb0000      call    driver!convert (bfacbef0)
bfabc38f ff7508          push    dword ptr [ebp+8]
bfabc392 57              push    edi
bfabc393 50              push    eax
bfabc394 e879fb0000      call    driver!ProcessBytes (bfacbf12)

- Dmitry Vostokov @ DumpAnalysis.org -

Software Technical Support Patterns

October 9th, 2007

I was wondering today whether there are any published patterns for software technical support and to my delight I found this interesting EuroPLoP conference paper:

Technical Support Patterns

- Dmitry Vostokov @ DumpAnalysis.org -

Crash Dump Analysis Patterns (Part 29)

October 8th, 2007

Some Windows synchronization objects like executive resources and critical sections have a struct member called ContentionCount. This is the number of times a resource was accessed or, in another words, it is the accumulated number of threads waiting for an object: when a thread tries to acquire an object and put into a wait state the count is incremented. Hence the name of this pattern: High Contention.

Here is an example. In a kernel memory dump we have just one exclusively owned lock and seems no other threads were blocked by it at the time the dump was saved. However the high contention count reveals CPU spike:

3: kd> !locks
**** DUMP OF ALL RESOURCE OBJECTS ****
KD: Scanning for held locks...

Resource @ 0x8abc11f0    Exclusively owned
    Contention Count = 19648535
     Threads: 896395f8-01<*>
KD: Scanning for held locks…

Resource @ 0x896fab88    Shared 1 owning threads
     Threads: 88c78608-01<*>
KD: Scanning for held locks...
15464 total locks, 2 locks currently held

3: kd> !thread 896395f8
THREAD 896395f8  Cid 04c0.0138  Teb: 7ffde000 Win32Thread: bc922d20 RUNNING on processor 1
Not impersonating
DeviceMap                 e3d4c008
Owning Process            8a035020       Image:         MyApp.exe
Wait Start TickCount      36969283       Ticks: 0
Context Switch Count      1926423                 LargeStack
UserTime                  00:00:53.843
KernelTime                00:13:10.703
Win32 Start Address 0×00401478
Start Address 0×77e617f8
Stack Init ba14b000 Current ba14abf8 Base ba14b000 Limit ba146000 Call 0
Priority 11 BasePriority 6 PriorityDecrement 5
ChildEBP RetAddr  Args to Child
ba14ac94 bf8c6505 001544c8 bf995948 000c000a nt!_wcsicmp+0×3a (FPO: [Non-Fpo])
ba14ace0 bf8c6682 00000000 00000000 00000000 win32k!_FindWindowEx+0xfb (FPO: [Non-Fpo])
ba14ad48 8088978c 00000000 00000000 0012f8d4 win32k!NtUserFindWindowEx+0xef (FPO: [Non-Fpo])
ba14ad48 7c8285ec 00000000 00000000 0012f8d4 nt!KiFastCallEntry+0xfc (FPO: [0,0] TrapFrame @ ba14ad64)

3: kd> !process 8a035020
PROCESS 8a035020  SessionId: 9  Cid: 04c0    Peb: 7ffdf000  ParentCid: 10e8
    DirBase: cffaf7a0  ObjectTable: e4ba30a0  HandleCount:  73.
    Image: MyApp.exe
    VadRoot 88bc1bf8 Vads 82 Clone 0 Private 264. Modified 0. Locked 0.
    DeviceMap e3d4c008
    Token                             e5272028
    ElapsedTime                       00:14:19.360
    UserTime                          00:00:53.843
    KernelTime                        00:13:10.703
    QuotaPoolUsage[PagedPool]         40660
    QuotaPoolUsage[NonPagedPool]      3280
    Working Set Sizes (now,min,max)  (1139, 50, 345) (4556KB, 200KB, 1380KB)
    PeakWorkingSetSize                1141
    VirtualSize                       25 Mb
    PeakVirtualSize                   27 Mb
    PageFaultCount                    1186
    MemoryPriority                    BACKGROUND
    BasePriority                      6
    CommitCharge                      315

- Dmitry Vostokov @ DumpAnalysis.org -

Reading Windows-based Code (Part 6)

October 4th, 2007

The HTML version of the presentation is located here:

Reading Windows-based Code (Part 6)

Contents:

  • Function pointers
  • Reading declarations
  • Pointers to structures

In Part 7 I’m planning to include the following topics:

  • Linked lists and their implementation overview
  • Windows linked lists (SINGLE_LIST_ENTRY, LIST_ENTRY)
  • Anatomy of a typical Windows service

- Dmitry Vostokov @ DumpAnalysis.org -

XEN from a system programmer’s perspective

October 3rd, 2007

I’m trying to educate myself about virtualization and XEN and found the book The Definitive Guide to the Xen Hypervisor written by David Chisnall that is about to be published:

Buy from Amazon

Table of Contents

I’ll write a review once I get it and read it.  

- Dmitry Vostokov @ DumpAnalysis.org -

Heaps and heap corruption explained

October 2nd, 2007

Excellent free chapter explaining process heap implementation and debugging heap corruption issues from the authors of Advanced Windows Debugging book:

Sample Chapter

- Dmitry Vostokov @ DumpAnalysis.org -

My unsorted collection of books

October 1st, 2007

Recently brought almost all my programming and math books into one place:

Will spend some time sorting them and publish the new picture afterwards.  

- Dmitry Vostokov @ DumpAnalysis.org -