Crash Dumps for Dummies (Part 3)
This part follows Dumps for Dummies (Part 2) and here I’ll try to explain crashes, dumps and postmortem debuggers.
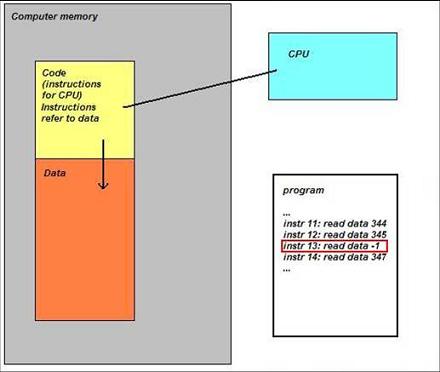
Sometimes a computer (CPU, Central Processing Unit) cannot perform its job because the instruction it gets to do some calculations, read or write data is wrong. Imagine a situation when you get an address to deliver a message to and you find that it doesn’t exist… The following idealized picture shows this situation (if memory locations/addresses are indexed from 0 then -1 is obviously wrong address):
When referencing invalid address CPU executes special sequence of actions (called trap) that ultimately leads to saving memory so you could later examine its contents and find out which instruction was invalid. If crash happens inside Windows operating system then you see blue screen and then a kernel memory or full computer physical memory is saved in a file (called either kernel or complete memory dump respectively). If you have a crash in a running application or service then its memory contents are saved in a file (called user dump). The latter file is also called a postmortem dump and we call a program which saves it a postmortem debugger. There can be several such programs and the one which is specified in the registry to execute whenever a crash happens in a running application or service is called a default postmortem debugger. The following picture illustrates this (here spooler service, spoolsv.exe, crashed by faulty printer driver):

By default it is Dr. Watson (drwtsn32.exe) but sometimes it doesn’t work in terminal services environment and has limitations so we always recommend setting NTSD (ntsd.exe) as a default postmortem debugger:
How to Set NTSD as a Default Windows Postmortem Debugger
I prefer to call both user and kernel/complete memory dumps postmortem (not only user dumps) because they are saved after application, service or system is dead already (crash or fatal error already happened). This distinguishes them from live memory dumps saved manually whenever we want them. This brings us to dump classification that I show you in forthcoming parts.
- Dmitry Vostokov @ DumpAnalysis.org -
May 20th, 2007 at 10:35 am
Vista update:
http://www.dumpanalysis.org/blog/index.php/2007/05/20/custom-postmortem-debuggers-on-vista/
December 14th, 2008 at 10:29 am
[…] to some dump collection techniques can be found in the previously published part 3 (crashes explained) and part 4 (hangs explained). Forthcoming Windows® Crash Dump Analysis book will discuss all […]
June 24th, 2009 at 8:19 pm
[…] Crashes explained, The difference between crashes and hangs […]